Top 11 Kubernetes Monitoring Tools in 2026 [Open Source Included]
Monitoring a Kubernetes cluster isn't optional—it's essential. Without proper observability, identifying performance bottlenecks, debugging failed pods, or understanding system behavior at scale becomes nearly impossible.
In this guide, we've compiled 11 popular Kubernetes monitoring tools, including open-source, self-hosted, and fully-managed SaaS solutions. For each tool, we'll outline what it's good at, where it may fall short, and ideal use cases.
- SigNoz (Open-Source)
- Prometheus (Free)
- Grafana (Open-Source)
- EFK Stack
- Datadog
- New Relic + Pixie
- Dynatrace
- Sematext
- Kubernetes Dashboard (Free)
- cAdvisor (Free)
- bpfman
📝 Note: Open-source tools like SigNoz and Grafana can be self-hosted, which means you only pay for the underlying infrastructure and maintenance—not for the software license itself.
Top Kubernetes Monitoring Tools at a glance
| Tool | Best For | Standout Feature for K8s Monitoring | Weaknesses | Pricing |
|---|---|---|---|---|
| SigNoz | Full-stack observability (metrics, traces, logs) | Native OpenTelemetry support for Kubernetes; correlates pod-level metrics, traces, and logs for deep troubleshooting | Requires infra management if self-hosting | Free (self-hosted); $49/mo (cloud) |
| Prometheus | Time-series metrics collection | Auto-discovers Kubernetes resources and scrapes metrics via service discovery; strong PromQL support for cluster insights | No native dashboarding or tracing support | Free |
| Grafana | Visualization and dashboards | Integrates seamlessly with Prometheus and other K8s data sources to build custom dashboards for cluster health | Needs external data sources like Prometheus | Free / $299/mo (Pro) |
| EFK Stack | Log aggregation and search | Centralizes and indexes logs from all Kubernetes pods for cluster-wide troubleshooting | Resource-heavy, complex to manage | Free (self-hosted) |
| Datadog | Managed, cloud-native observability | Kubernetes-native agent provides unified metrics, logs, and events with auto-discovery and tagging | Cost can spike with cluster scale | Starts at $15/host/month |
| New Relic + Pixie | Managed observability with auto-instrumentation | Instant, code-less Kubernetes instrumentation with Pixie; live pod-level telemetry and AI-driven insights | Can get expensive at scale | Free tier; usage-based |
| Dynatrace | Enterprise-grade, automated monitoring | AI-powered root cause analysis and auto-discovery of K8s clusters, workloads, and dependencies | High learning curve, enterprise pricing | Free trial; usage-based |
| Sematext | Cost-effective infra and log monitoring | Agent auto-discovers K8s resources and provides out-of-the-box dashboards and alerts for clusters | UI less flexible than Grafana | Starts at $3.6/host/month |
| Kubernetes Dashboard | Quick visual overview for small clusters | Native UI for real-time monitoring of pods, nodes, and workloads directly in Kubernetes | Limited metrics; not scalable for large clusters | Free |
| cAdvisor | Container-level resource usage | Exposes live resource usage and performance stats for each Kubernetes container/pod | Lacks aggregation and long-term storage | Free |
| bpfman | eBPF program management | Manages eBPF programs for deep, low-overhead Kubernetes node and pod monitoring | Requires privileged access, complex setup | Free (self-hosted) |
SigNoz – OpenTelemetry-Native APM
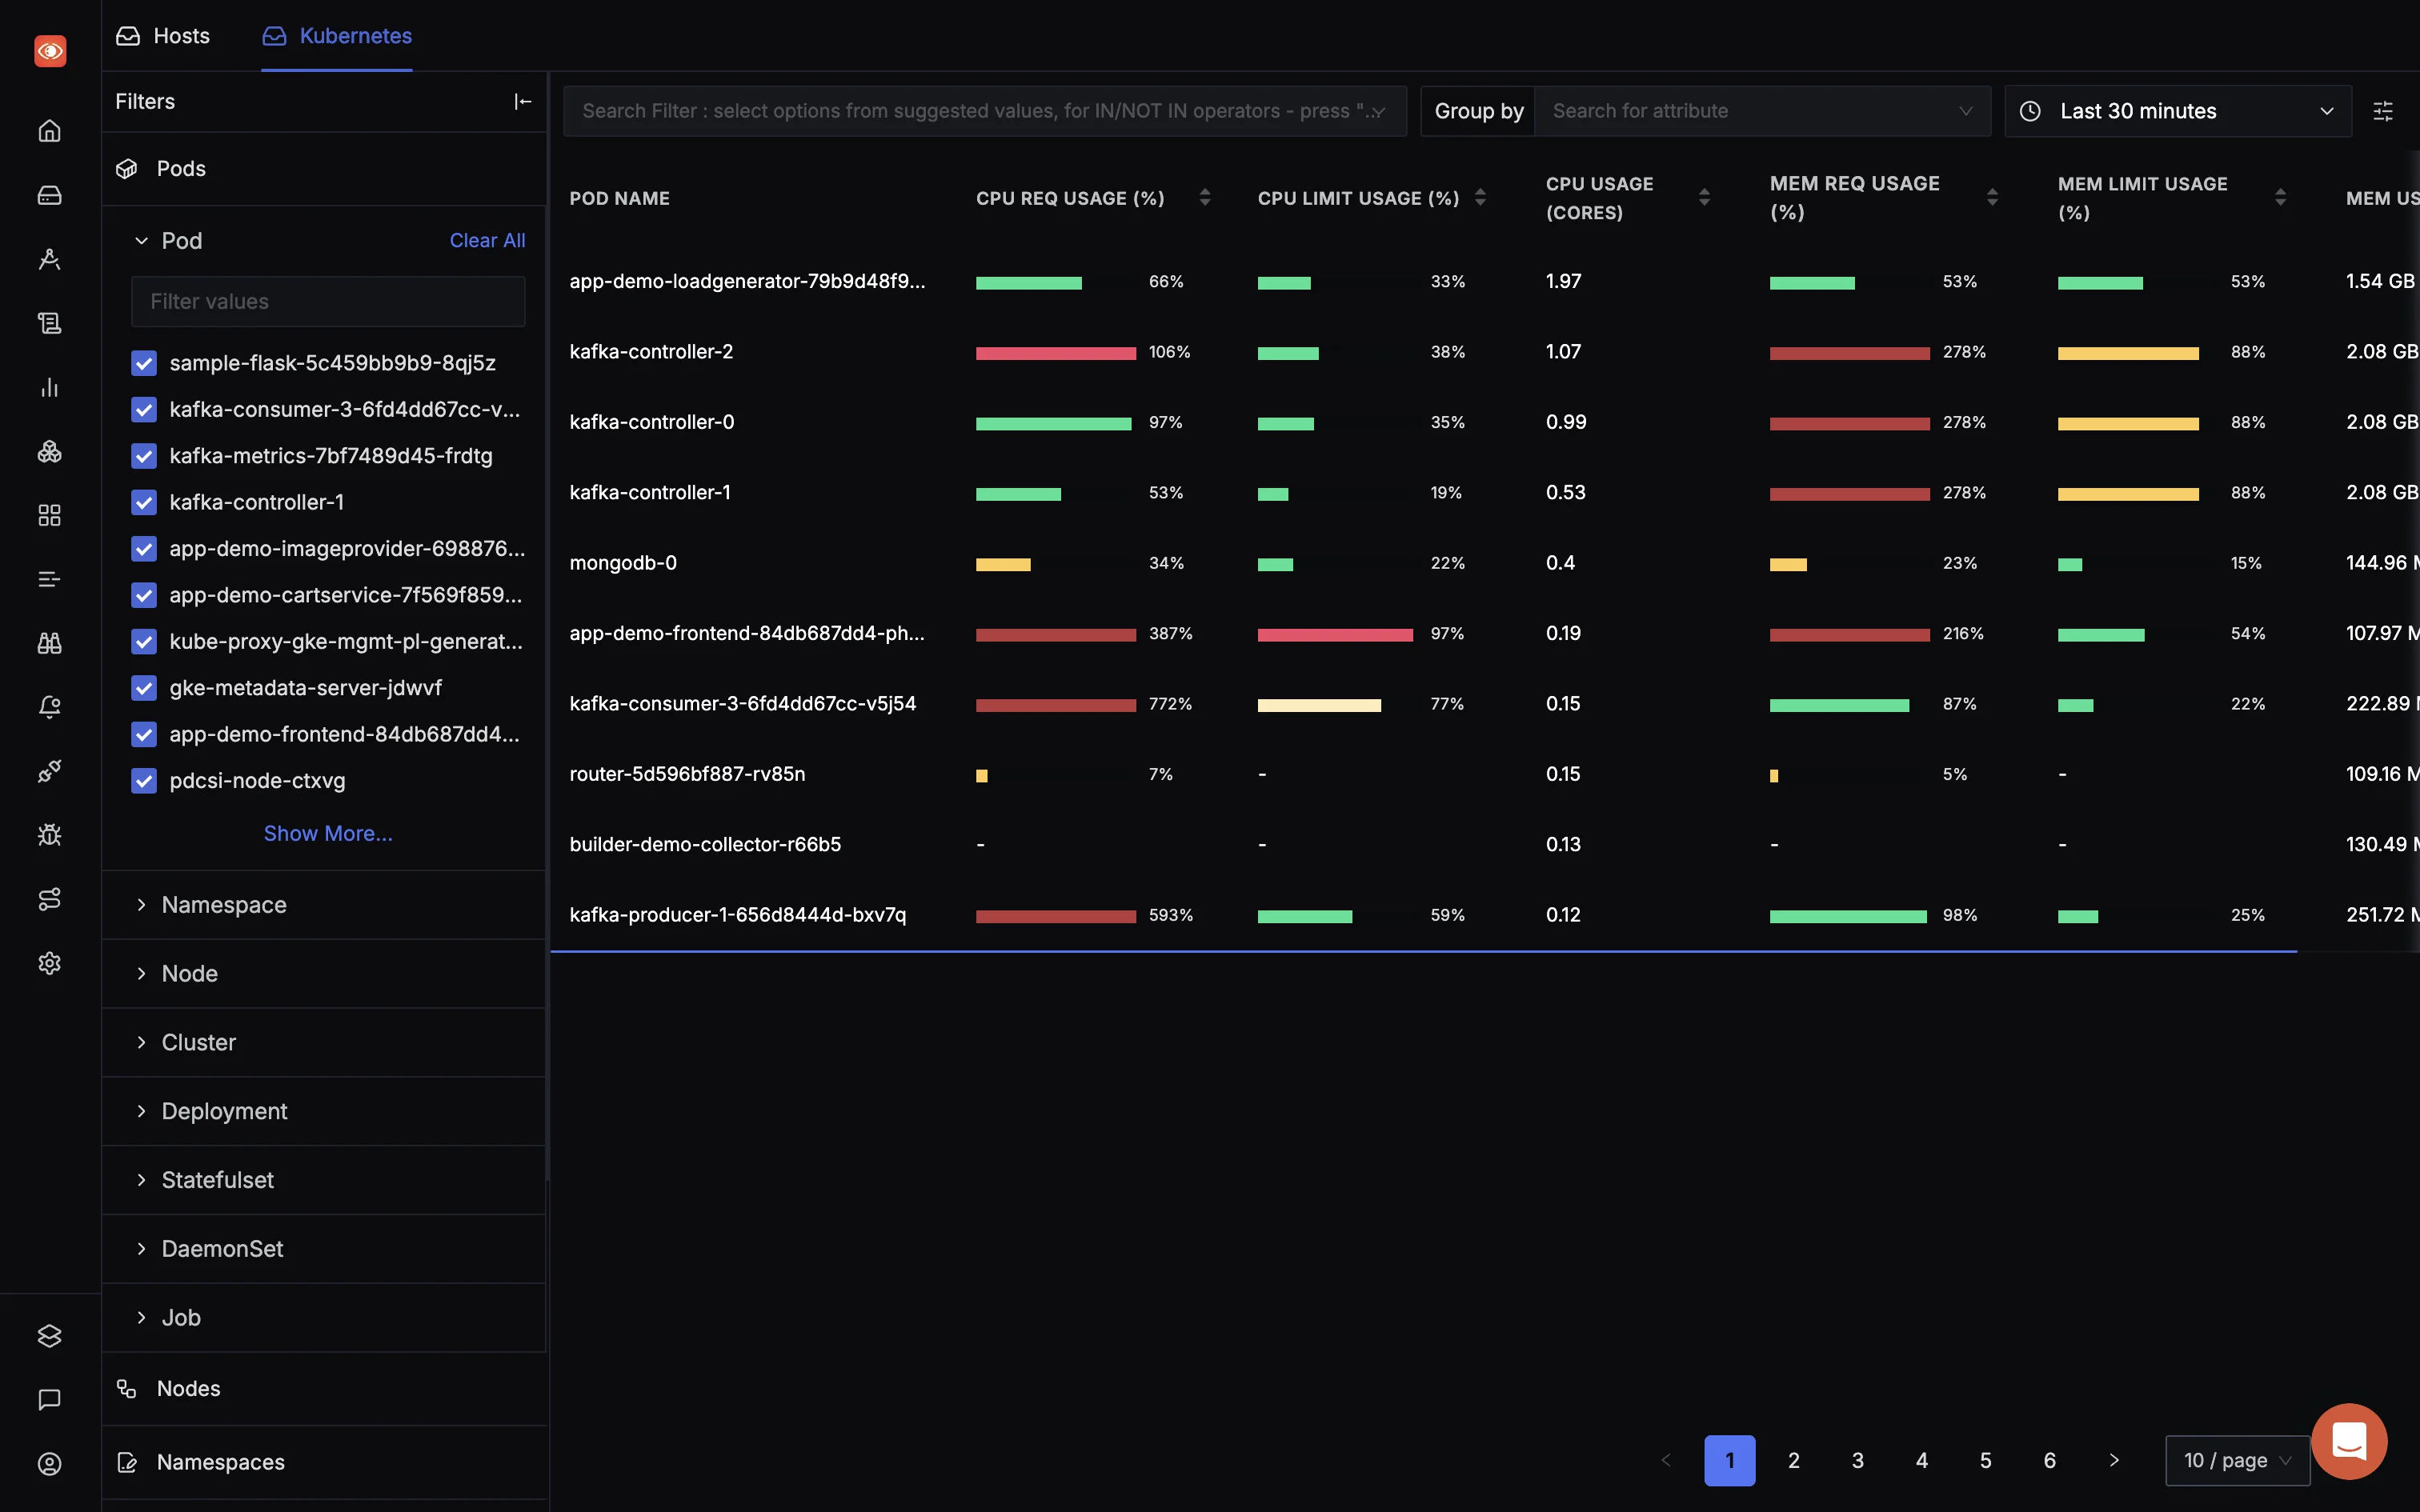
SigNoz is an open-source unified observability platform built natively on OpenTelemetry, the emerging standard in modern observability. It provides seamless collection and correlation of metrics, traces, logs, and alerts — all in one place — with a strong focus on Kubernetes-native environments.
Why Use SigNoz for Kubernetes Monitoring
SigNoz excels in distributed tracing and real-time metrics. For Kubernetes environments, it shines with:
- OpenTelemetry-native support makes it easy to instrument Kubernetes-native apps across languages, without worrying about vendor lock-in.
- Out-of-the-box dashboards for Kubernetes metrics — including CPU/memory usage per node, pod restarts, and resource saturation — simplify cluster observability from day one.
- p90/p99 latency tracking, request throughput, and error rate visualization help pinpoint service-level degradation in microservices running on Kubernetes.
- A columnar database backend enables scalable and efficient storage of high-cardinality Kubernetes metrics and logs, making it well-suited for observability use cases.
- Unified correlation of logs, metrics, and traces helps identify issues spanning across multiple pods or microservices, especially in distributed, autoscaling Kubernetes environments.
Limitations
- Resource constraints in Kubernetes environments could impact performance if the OpenTelemetry Collector is not allocated sufficient resources.
Other Highlights
- SigNoz's OpenTelemetry-native design ensures broad compatibility and future-proof observability.
- Flamegraphs and Gantt charts enable deep performance analysis and granular root cause investigation.
- Teams can extract business and custom metrics directly from trace data to monitor key KPIs.
- Flexible deployment options — cloud or self-hosted — give organizations full control over data and infrastructure.
Pricing
- Self-Hosted: Free & open-source.
- Managed Cloud: Paid plans based on data volume and retention. Free trial available.
💡 For small to mid-size Kubernetes clusters, the self-hosted option can save you a lot of costs, especially if you already have the infrastructure in place to host it.
Prometheus – The De Facto Standard for Metrics
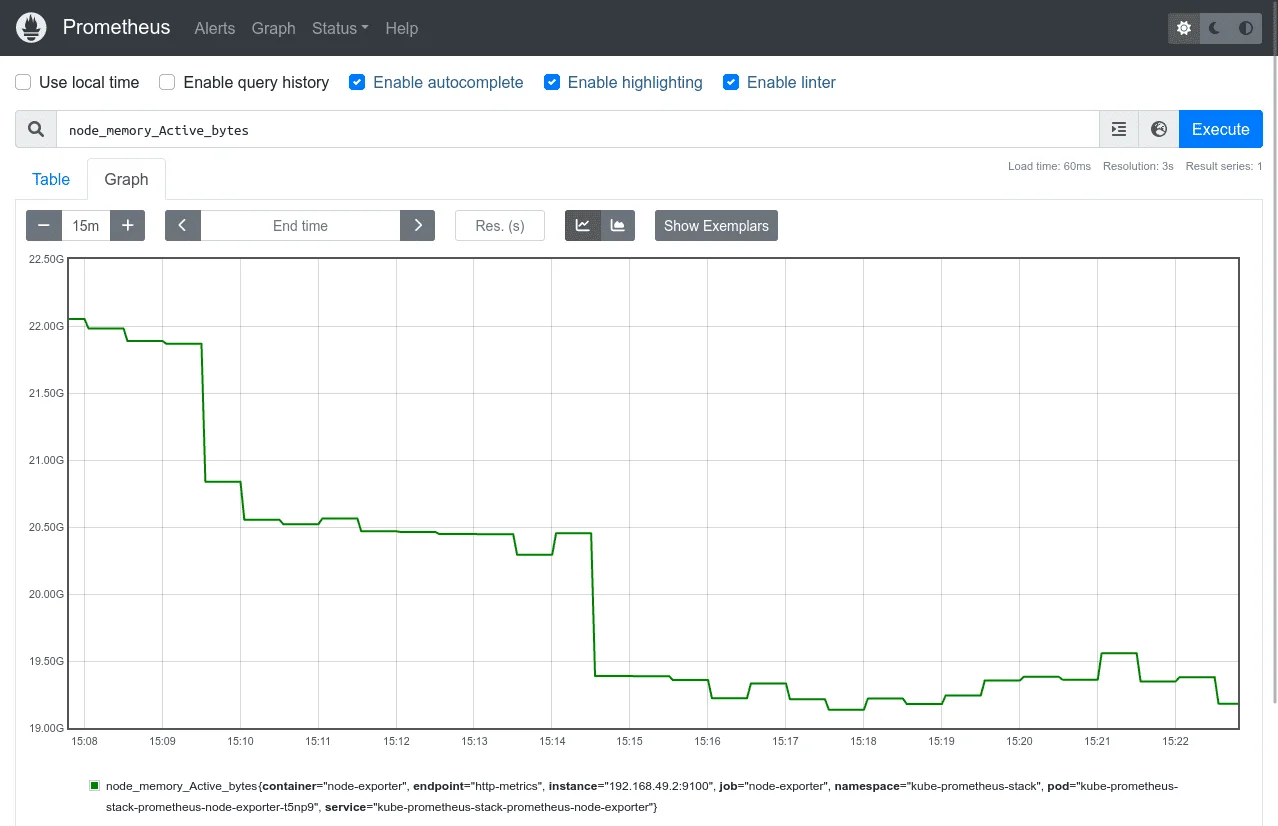
Prometheus is a leading open-source monitoring system and time-series database, purpose-built for metrics collection and alerting in dynamic environments like Kubernetes.
Why Use Prometheus for Kubernetes Monitoring
- Native Kubernetes Service Discovery – Automatically detects and scrapes metrics from Pods, Nodes, Services, and Endpoints without manual config.
- Granular Metrics with PromQL – Enables advanced querying for pod-level metrics, SLO tracking, and custom alerting tailored to Kubernetes workloads.
- Rich Ecosystem for K8s – Integrates with kube-state-metrics, node-exporter, Grafana, and Alertmanager for a complete observability stack.
- Production-Ready Helm Charts – The
kube-prometheus-stackHelm chart offers out-of-the-box dashboards and alerts optimized for Kubernetes clusters
Limitations
- No Native Tracing or Logging: Metrics-only; needs integrations for full observability.
- Storage Challenges: Scaling long-term storage can be complex.
- Manual Correlation: No built-in span or trace correlation for incidents.
Other Highlights
- CNCF-supported and widely adopted in production clusters.
- PromQL enables custom metrics and powerful alerts.
- Large ecosystem of exporters for app, infra, and services.
- Integrates with Alertmanager for flexible alert routing.
Pricing
- 100% Free & Open Source: Ideal for self-managed Kubernetes setups.
- Can be extended with Thanos or Cortex for long-term storage & high availability.
💡 Prometheus is perfect if you want a mature, metrics-focused tool with a massive ecosystem and community support.
Grafana – The Visualization Powerhouse
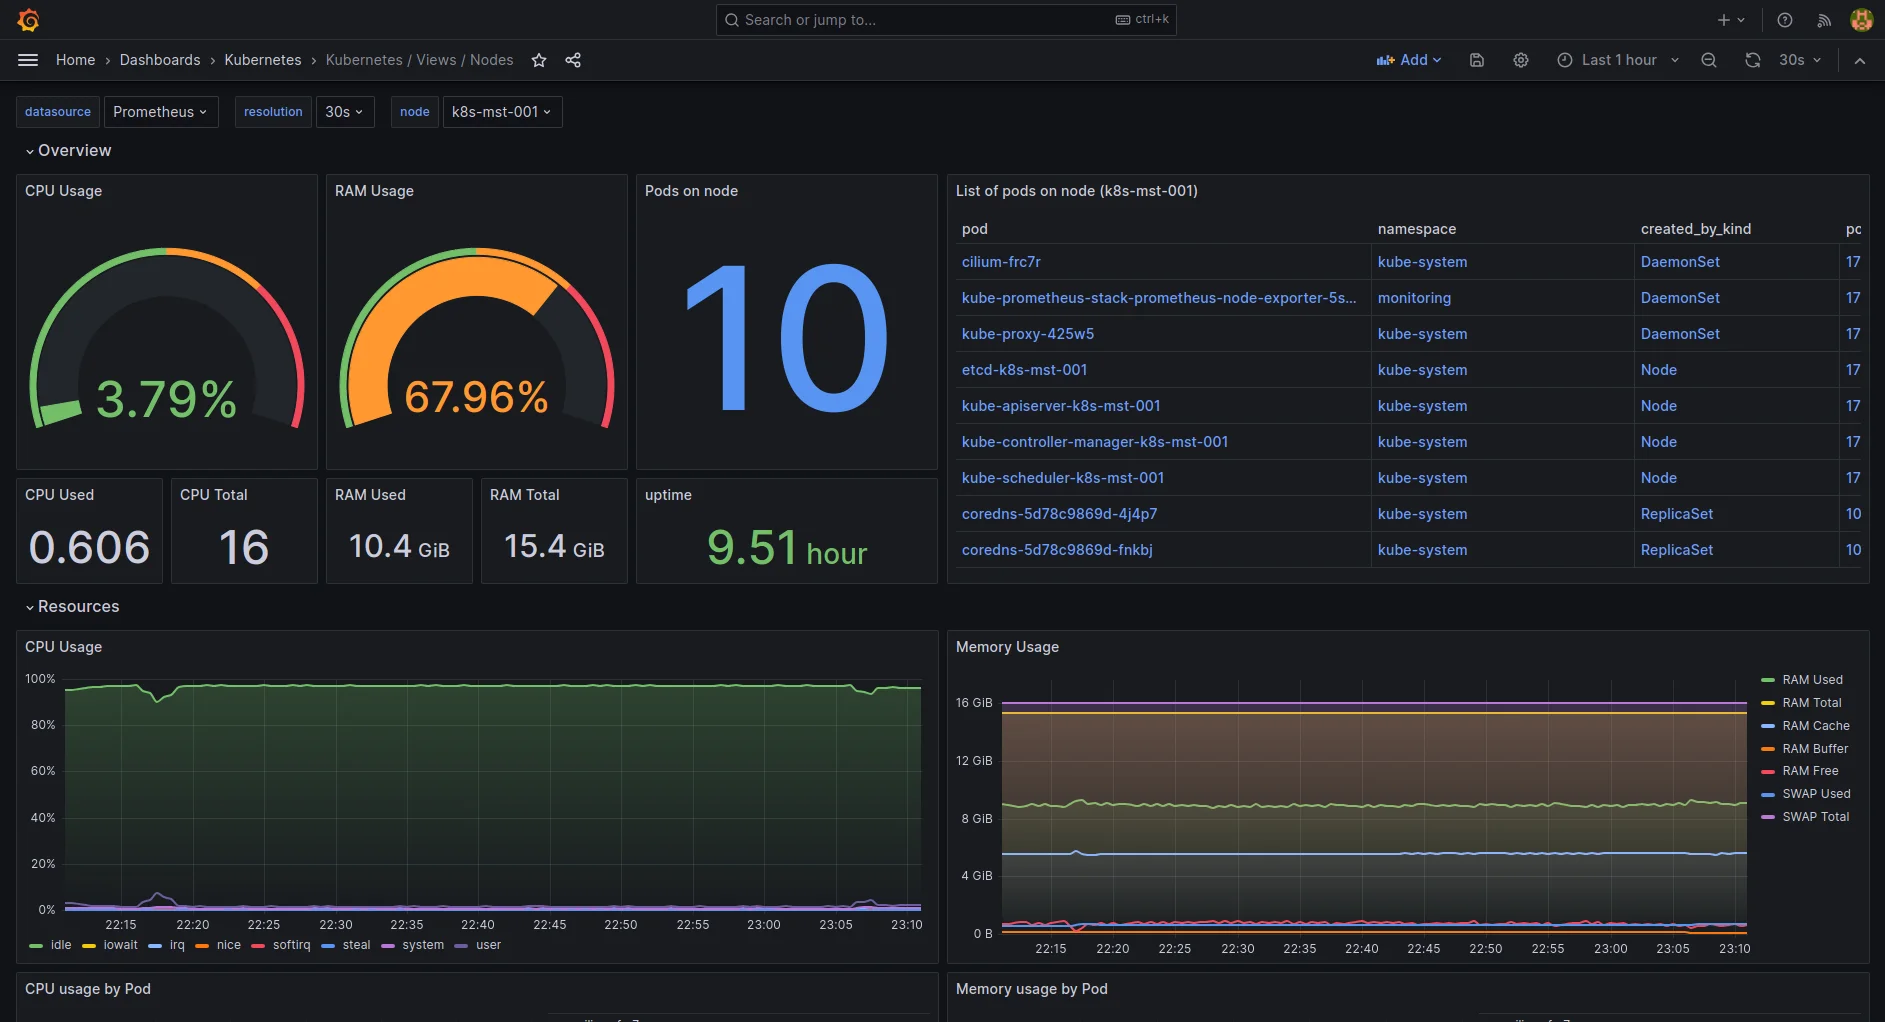
Grafana is the most popular open-source tool for creating robust, customizable dashboards and visualizing metrics, logs, and traces. It's often paired with tools like Prometheus, Loki, and Tempo to build a complete observability stack.
Why Use Grafana for Kubernetes Monitoring
- Kubernetes-Optimized Dashboards – Pre-built dashboards visualize pod health, node performance, resource usage, and cluster status with minimal setup.
- Multi-Source Correlation – Connects to Prometheus, Loki, and Tempo to correlate metrics, logs, and traces for K8s observability.
- Alerting for K8s Events – Set custom alerts on K8s metrics and send notifications via Slack, PagerDuty, or email.
- Team Collaboration & Annotations – Add deployment markers or incident notes directly on dashboards to improve post-mortems and team visibility.
Limitations
- No native data collection – depends on tools like Prometheus or Loki.
- Complex alerting setup across different data sources.
- May need tuning and optimization for large-scale environments.
Other Highlights
- Unified observability experience with Grafana Cloud (includes metrics, logs, traces).
- Grafana Tempo and Loki add tracing and logging support.
- Built-in role-based access and data source permissions.
- Open-source and enterprise options available with advanced features.
Pricing
- Grafana OSS: Completely free and self-hosted.
- Grafana Cloud: Free tier with 10k series, logs, and traces; paid plans scale by usage.
💡 Grafana is ideal if you want to visualize multiple data sources in one place and build powerful dashboards for your Kubernetes infrastructure.
EFK Stack – The Powerful Logging Solution for Kubernetes
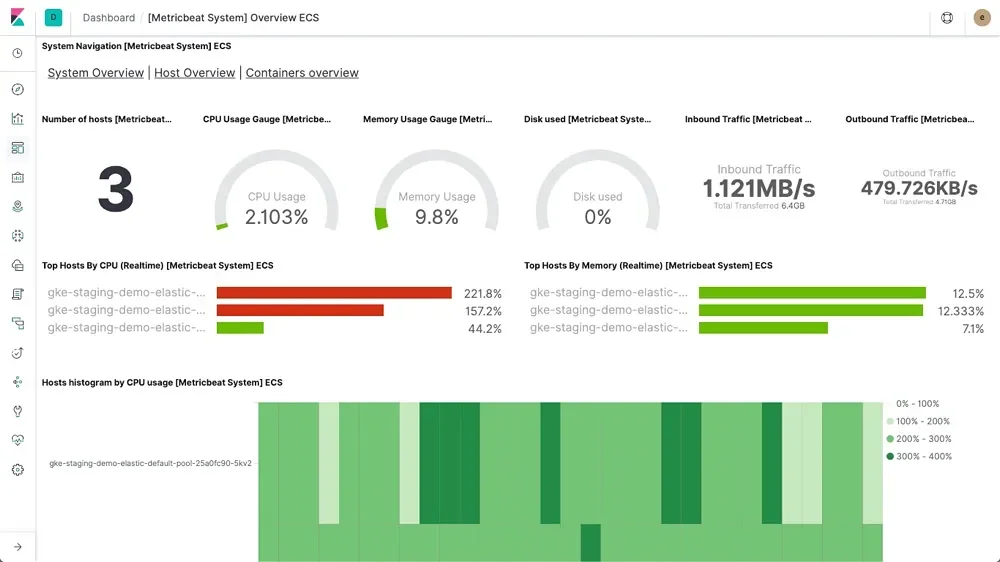
The EFK Stack (Elasticsearch, Fluentd, Kibana) is a popular open-source solution for managing and analyzing logs in Kubernetes environments. It combines Elasticsearch for log storage and search, Fluentd for log collection and aggregation, and Kibana for visualization and analysis.
Why Use EFK for Kubernetes Monitoring
- Centralized Log Aggregation – Fluentd collects logs from Kubernetes pods and nodes, forwarding them to Elasticsearch.
- Advanced Log Querying – Elasticsearch enables fast, full-text search and filtering across massive log volumes.
- Kubernetes-Aware Logging – Easily tag logs with pod names, namespaces, and labels for better traceability.
- Visual Insights with Kibana – Build dashboards to monitor application logs, detect errors, and debug issues in your K8s cluster.
Limitations
- Resource-Intensive: The stack requires significant computational resources for large-scale environments.
- Complex Setup: Setting up and configuring the EFK stack requires advanced knowledge and is more complex than standalone tools.
- Lack of Native Metrics/Tracing: EFK focuses on logs; you need additional tools like Prometheus for metrics and tracing.
- Scaling Challenges: As log volume increases, scaling and maintaining Elasticsearch becomes complex.
Other Highlights
- Centralized Logging for all Kubernetes pods, nodes, and applications.
- Custom Log Dashboards with Kibana for easy monitoring and troubleshooting.
- Fluentd's Flexibility allows you to route logs to multiple outputs and parse them with custom logic.
- Scalable and Reliable with Elasticsearch as the backend, ideal for large deployments.
Pricing
- 100% Free & Open Source: You can run the entire stack on your own infrastructure.
- Elastic Cloud: Paid plans for managed services with enhanced features like security, advanced analytics, and scaling.
💡 The EFK stack is ideal for teams needing a powerful, scalable, and flexible log aggregation and analysis solution in Kubernetes environments, especially when combined with Elasticsearch's search capabilities.
Datadog – Comprehensive Monitoring for Kubernetes and Beyond
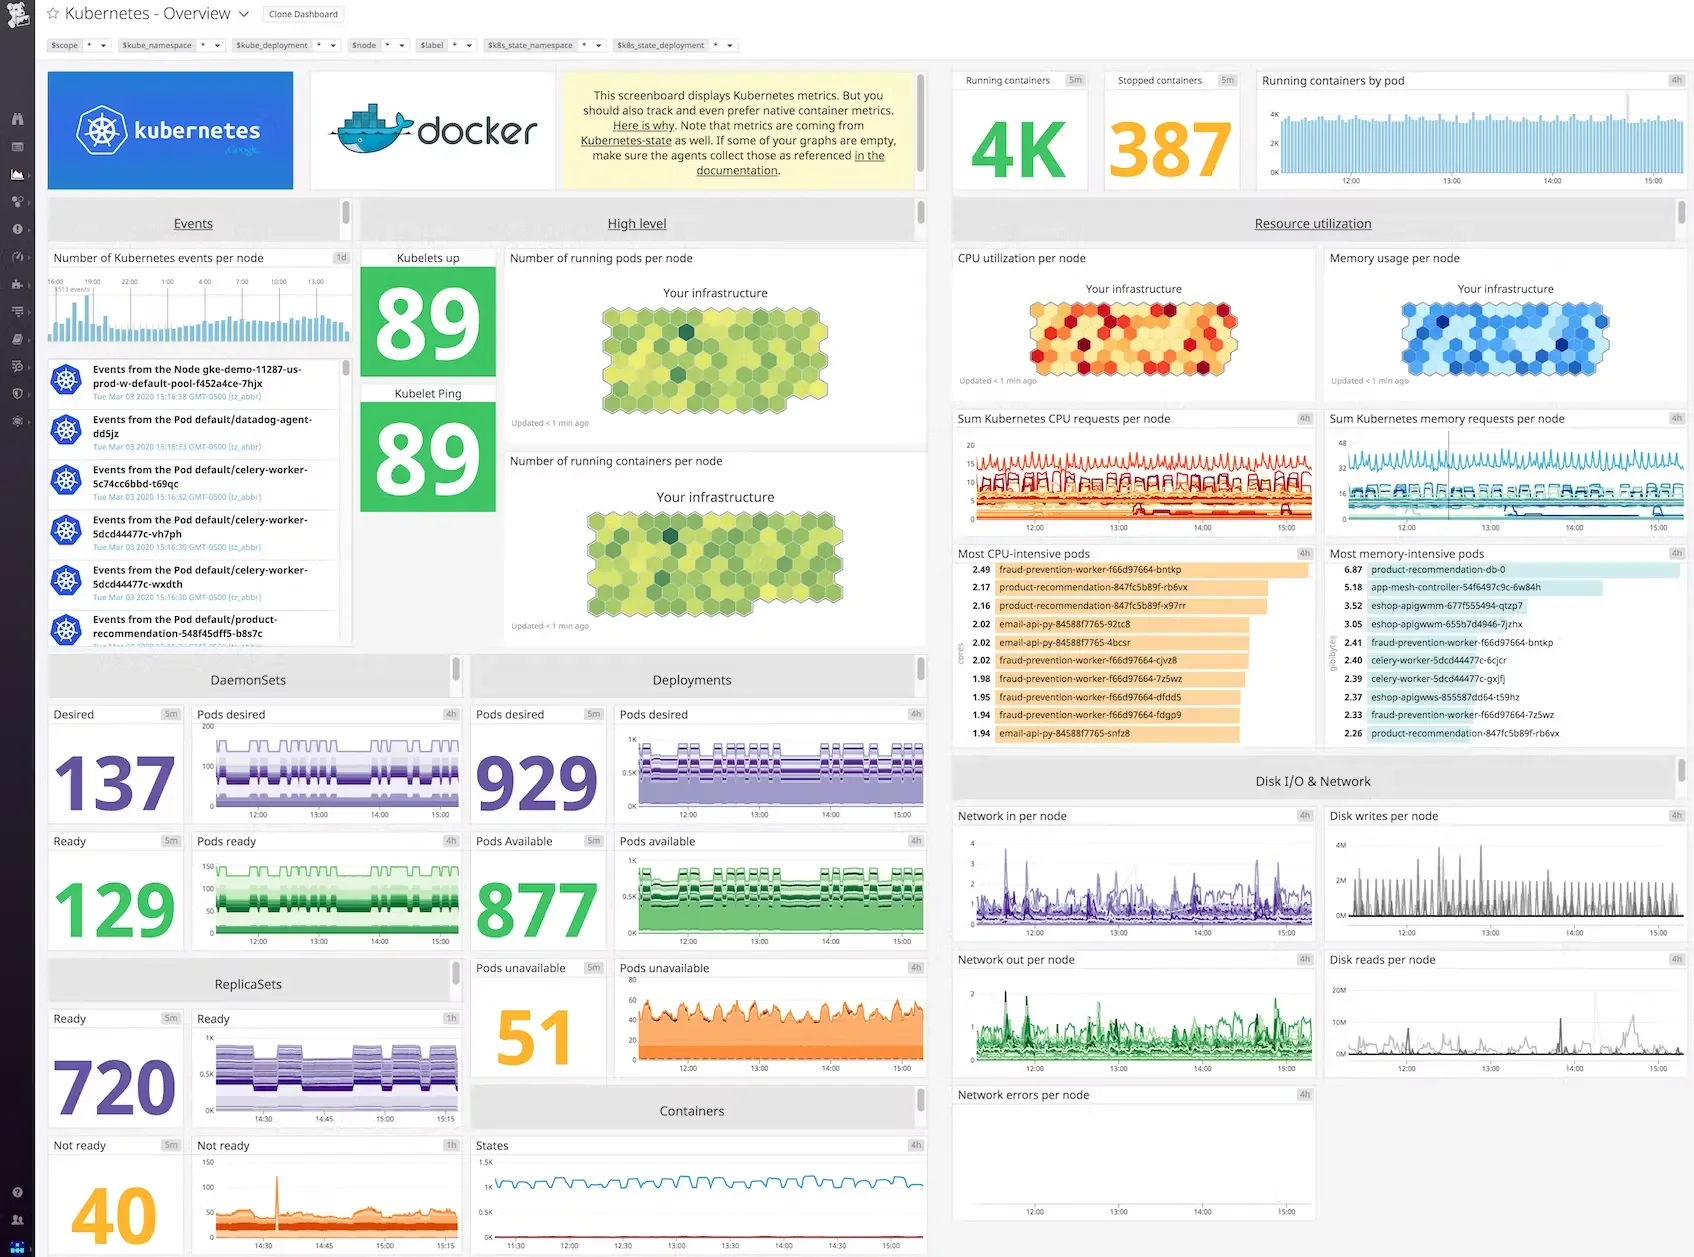
Datadog is a cloud-native monitoring and security platform that provides full visibility into your Kubernetes clusters, workloads, applications, and infrastructure. With over 600+ integrations, including native Kubernetes support, Datadog offers powerful observability capabilities out of the box—covering metrics, logs, traces, and more.
Why Use Datadog for Kubernetes Monitoring
- Pre-Built Kubernetes Dashboards – Ready-to-use dashboards for monitoring clusters, nodes, pods, and workloads out of the box.
- Comprehensive Observability – Seamlessly integrates metrics, logs, traces, and security data into a unified view.
- Auto-Discovery of Kubernetes Resources – Automatically detects new containers, pods, and services as your cluster evolves.
- Custom Metrics and Tagging – Easily tag and filter metrics at the container and service level for more granular insights.
Limitations
- Paid Tiers for Key Features: Full observability features like APM, tracing, and advanced dashboards are available only in higher pricing tiers.
- Cost Grows with Scale: Pricing can grow quickly in dynamic environments with many containers.
- Data Retention Limits: Historical data retention depends on your subscription plan.
Other Highlights
- Live Container Maps to visualize your entire Kubernetes ecosystem in real-time.
- Autoinjection of APM agents for trace collection without code changes.
- Integrated security monitoring for containers, workloads, and hosts.
- Seamless support for multi-cloud and hybrid Kubernetes environments.
Pricing
- Free Tier: Available with basic metrics and limited retention.
- Pro & Enterprise Tiers: Usage-based pricing depending on hosts, containers, log volume, and features.
💡 Datadog is a great choice for teams seeking powerful Kubernetes observability and security in a single platform, especially those already operating in multi-cloud or hybrid environments.
New Relic + Pixie – All-in-One Observability for Kubernetes
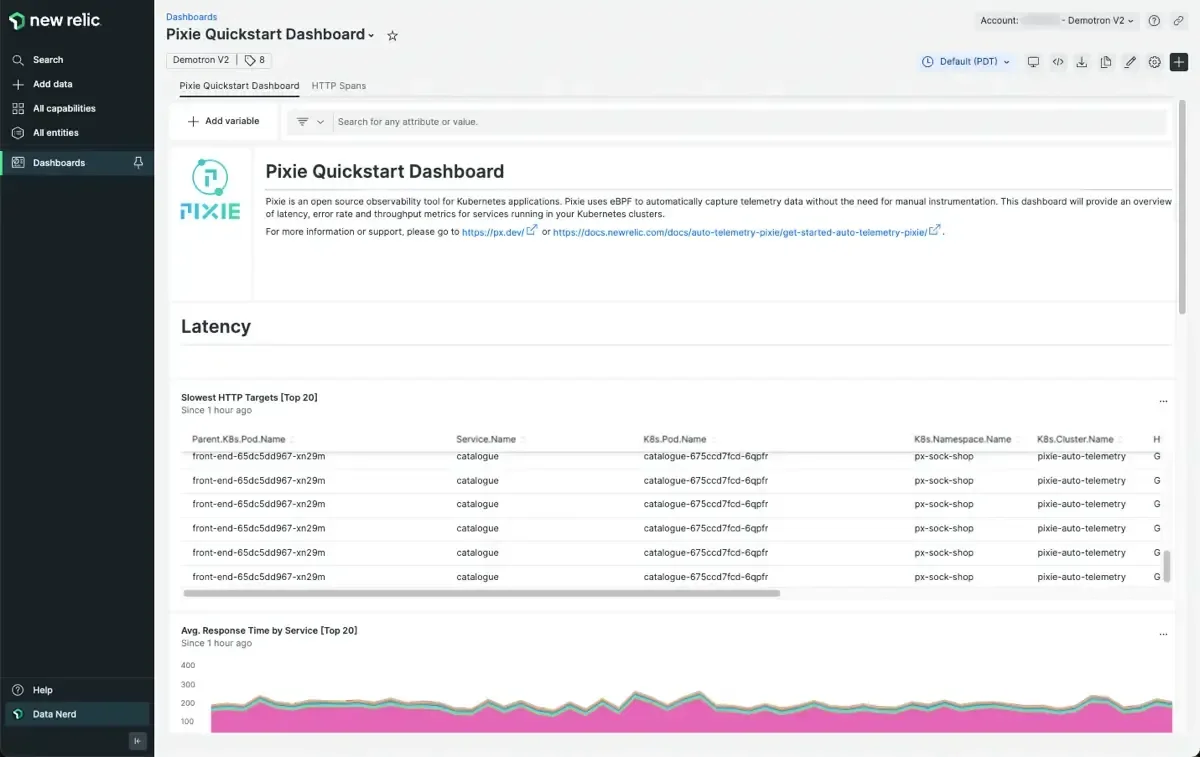
New Relic is a powerful observability platform that offers seamless Kubernetes monitoring with over 700+ integrations. When paired with Pixie, it brings real-time, eBPF-based visibility into Kubernetes clusters with zero-instrumentation and no code changes required. This combo enables instant debugging, telemetry analysis, and long-term data retention—all from a rich UI.
Why Use New Relic + Pixie for Kubernetes Monitoring
- Real-Time Telemetry with eBPF – Pixie captures metrics, traces, and logs from Kubernetes without code changes.
- Instant Cluster Visibility – Auto-discovers services, pods, and nodes to provide deep observability out-of-the-box.
- Historical Data Retention – Store Pixie's short-term telemetry in New Relic for long-term analysis and auditing.
- Unified Observability – View metrics, traces, logs, and alerts in one place—tailored for Kubernetes environments.
Limitations
- Paid Subscription Required: Access to full features, long-term data storage, and advanced AI tools comes at a cost.
- Potential Vendor Lock-In: Deep integration with New Relic's ecosystem may create dependency.
- Steep Learning Curve: Rich features and UI can overwhelm new users or small teams.
Other Highlights
- Advanced Kubernetes Navigator helps drill down into nodes, pods, and services easily.
- Language-agnostic observability makes it ideal for polyglot environments.
- Supports incident correlation and proactive alerting for faster resolution times.
Pricing
- Free Tier Available: Limited data retention and features.
- Pro & Enterprise Plans: Paid plans include extended data retention, AI features, custom dashboards, and team collaboration tools.
💡 New Relic + Pixie is perfect for DevOps and SRE teams looking for real-time, code-free Kubernetes observability with built-in AI and long-term telemetry storage—all in one place.
Dynatrace – AI-Powered Full-Stack Observability for Kubernetes
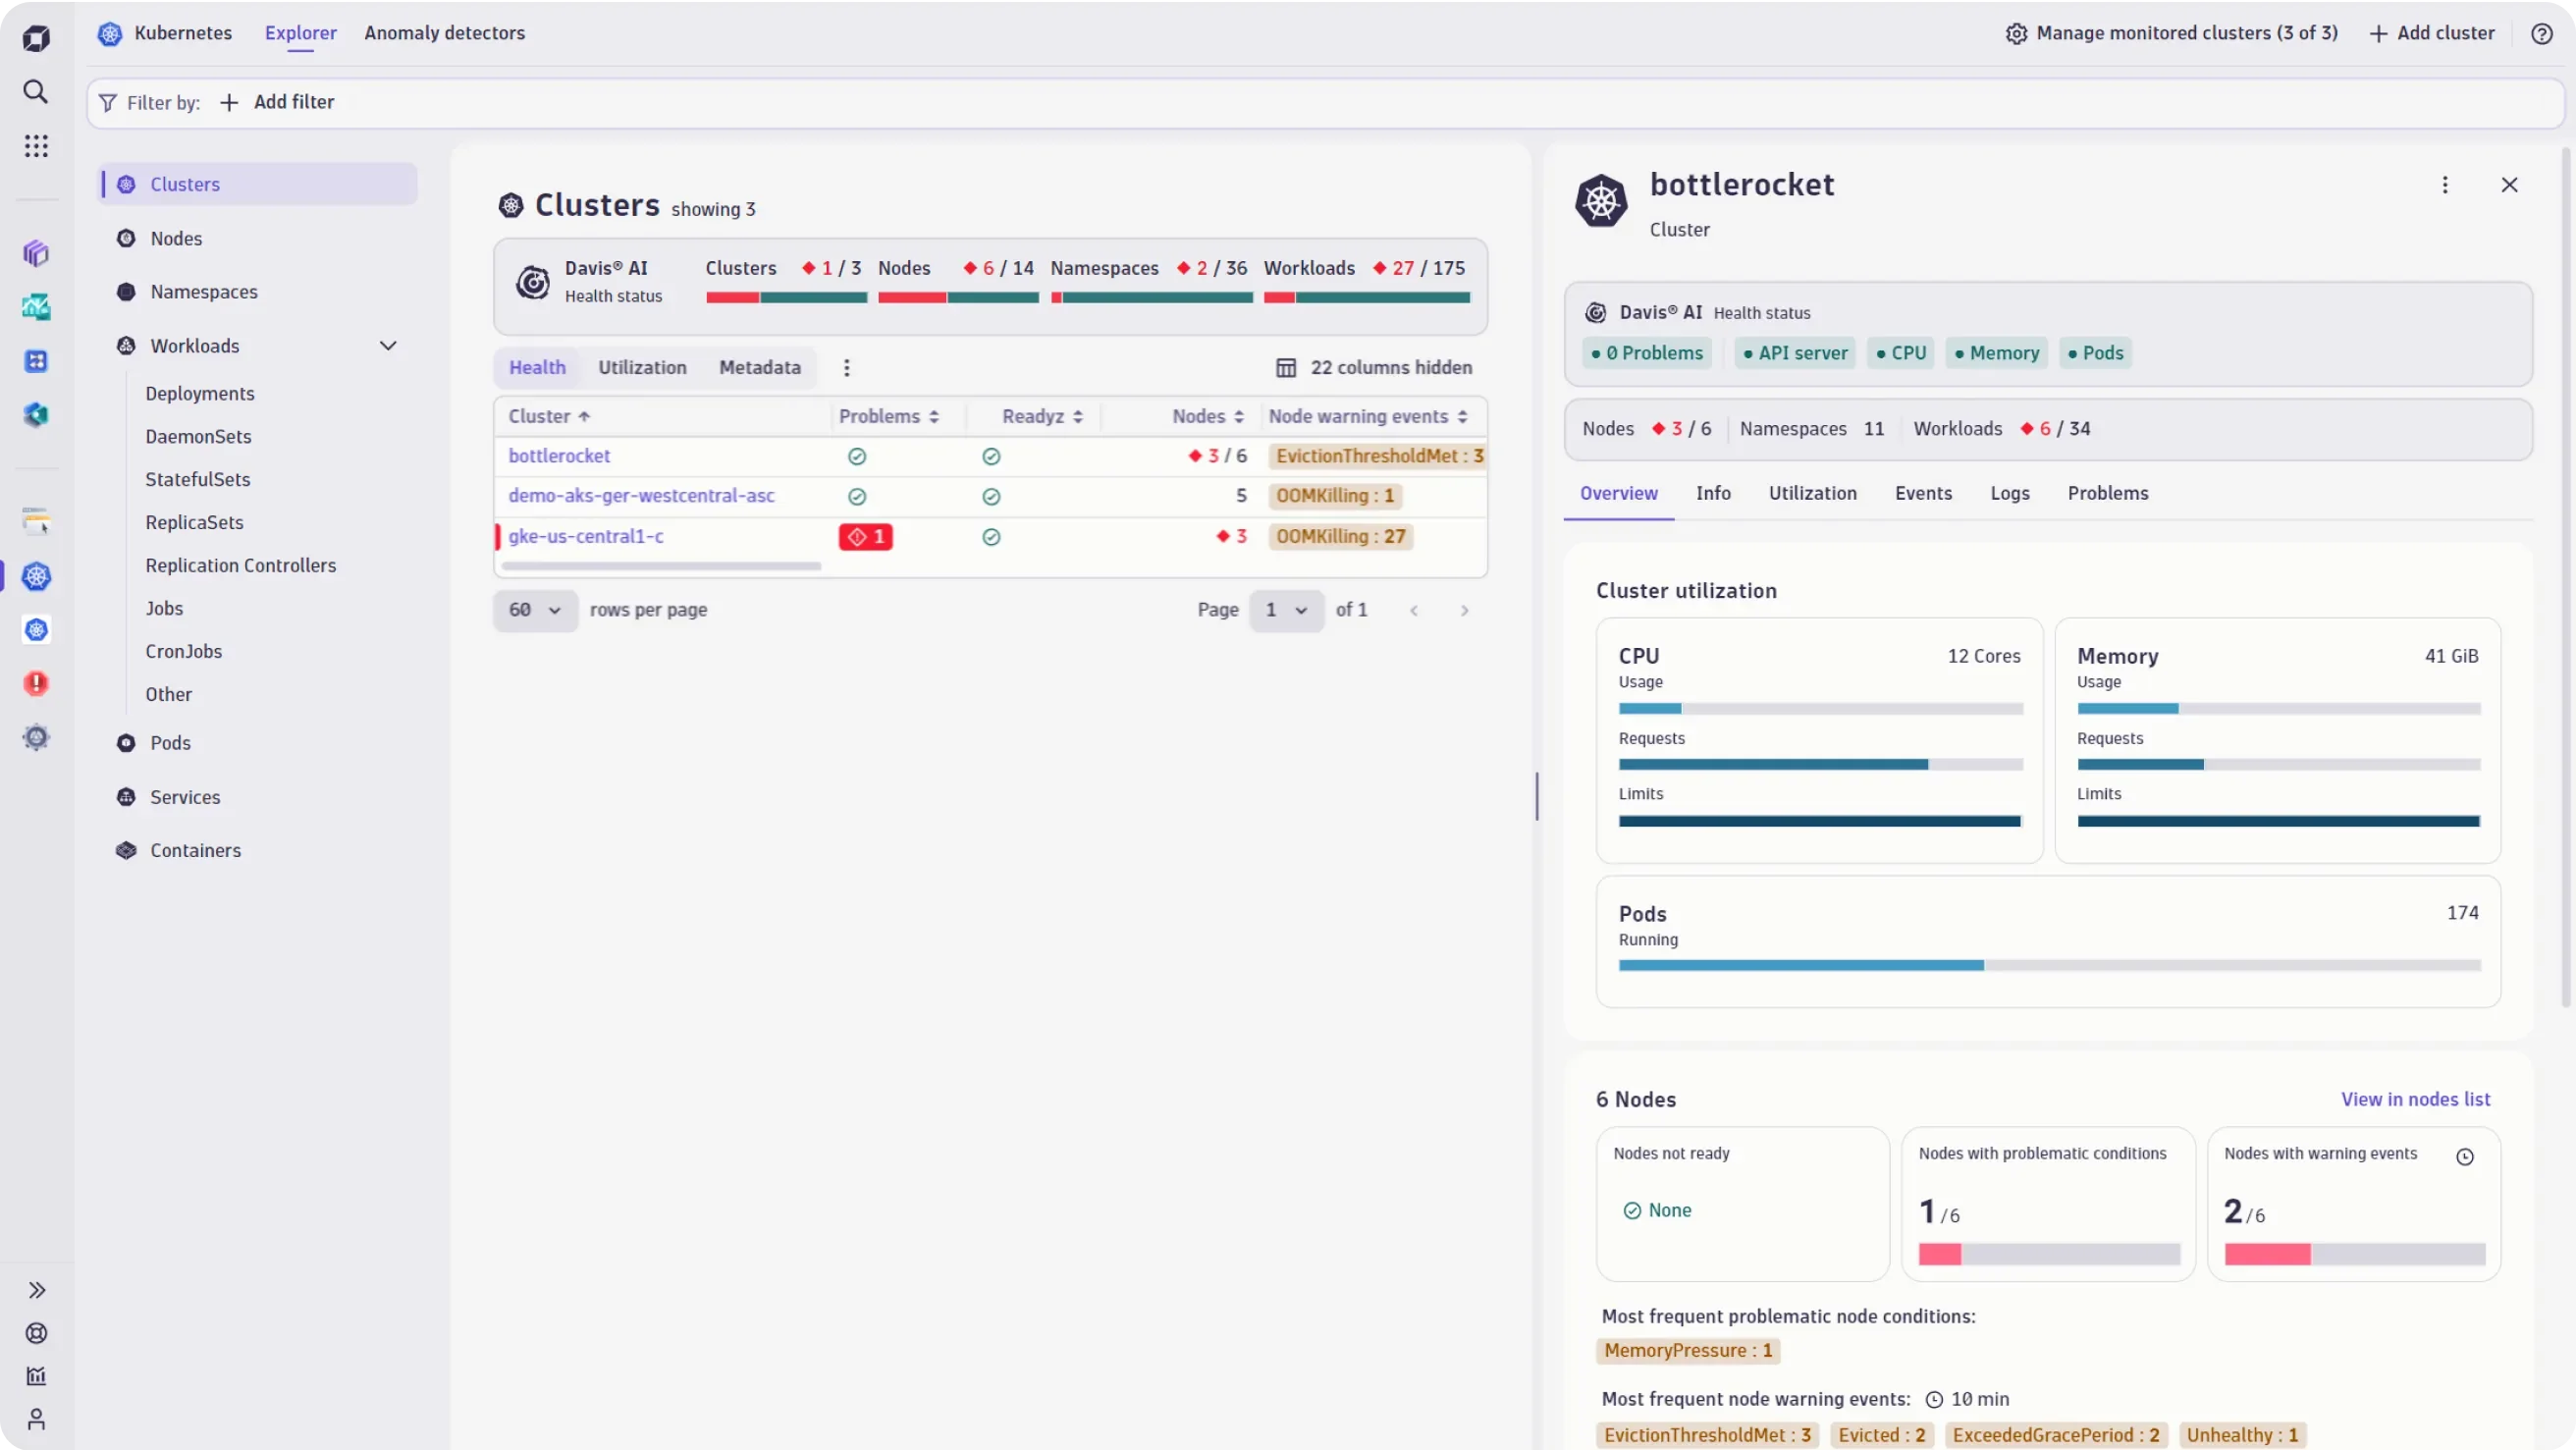
Dynatrace is a robust enterprise-grade observability platform offering deep insights into applications, infrastructure, and Kubernetes clusters. It leverages OneAgent and Davis AI to provide auto-discovery, smart alerting, and precise root-cause analysis with minimal manual setup. Dynatrace supports Kubernetes-native monitoring, offering real-time visibility into pods, nodes, and workloads.
Why Use Dynatrace for Kubernetes Monitoring
- Auto-Discovery & Monitoring: Automatically discovers Kubernetes components and starts monitoring without manual configuration.
- Smart Root-Cause Analysis: Powered by Davis AI, it identifies performance bottlenecks and anomalies in real time.
- Unified Dashboard: Full-stack visibility from container to application layer through a single pane of glass.
- Seamless K8s Integration: Works out-of-the-box with managed Kubernetes services like EKS, AKS, and GKE.
- Context-Rich Observability: Links metrics, logs, traces, and user sessions for full context.
Limitations
- Enterprise-Focused Pricing: May be expensive for startups or small teams.
- High Resource Overhead: OneAgent can be resource-intensive in large environments.
- Complex Customization: Advanced configurations and dashboard tuning can require steep learning.
Other Highlights
- Supports automatic Kubernetes version upgrades and rolling updates.
- Provides real-time dependency mapping between services and infrastructure.
- AI-assisted anomaly detection with noise reduction for alert fatigue.
- Built-in support for SLO tracking, business metrics, and digital experience monitoring.
Pricing
- Free Trial Available: 15-day trial with access to full features.
- Paid Plans: Custom pricing based on host units, features, and retention duration.
💡 Dynatrace is ideal for large-scale Kubernetes environments where deep automation, AI-driven insights, and full-stack visibility are critical for performance, reliability, and quick incident response.
Sematext – Lightweight & Easy Monitoring for Kubernetes
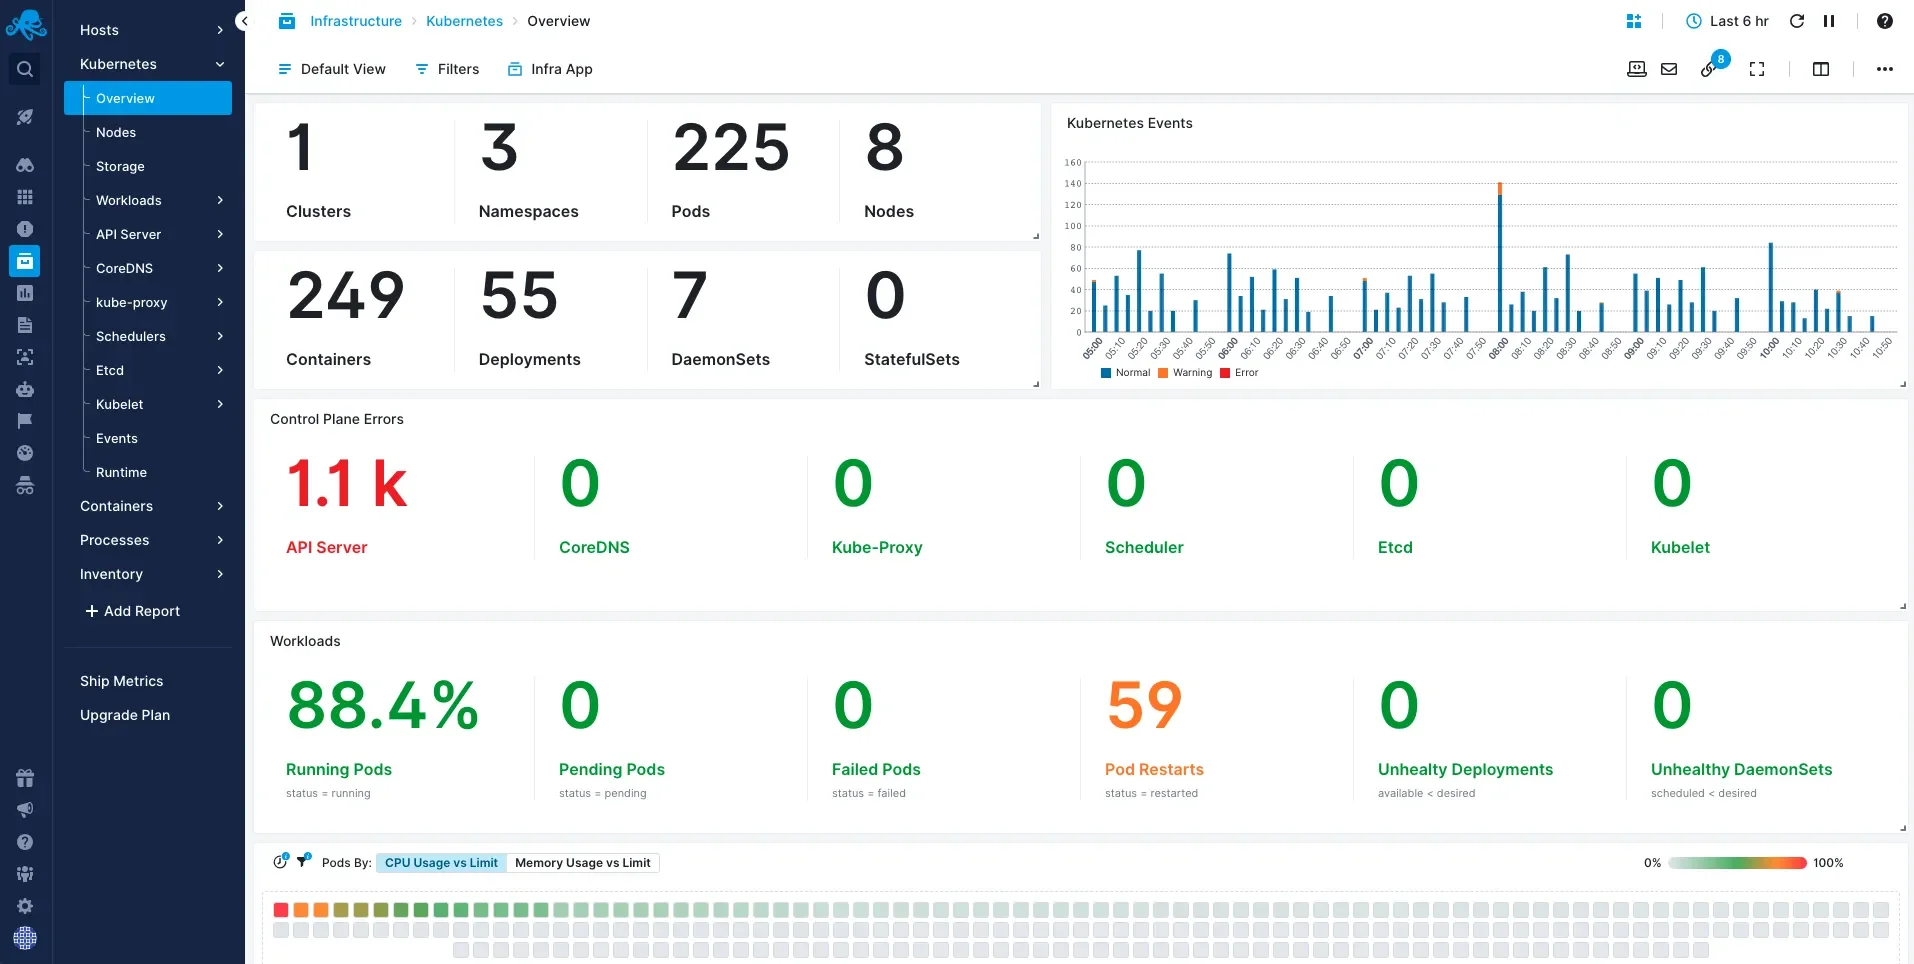
Sematext is a full-stack observability solution offering logs, metrics, events, and real-user monitoring (RUM) from a single platform. Designed with simplicity and ease of use in mind, Sematext provides out-of-the-box Kubernetes monitoring with automated service discovery and minimal setup effort.
Why Use Sematext for Kubernetes Monitoring
- All-in-One Platform: Collects logs, metrics, events, and traces from Kubernetes in one place.
- Easy Setup: Deploy with a single Helm chart—ideal for teams seeking fast onboarding.
- Smart Dashboards: Automatically generated dashboards tailored for Kubernetes resources.
- Built-In Alerting: Pre-configured alerts for node restarts, CPU/memory limits, and more.
- Auto Discovery: Automatically detects and starts monitoring new pods and services.
Limitations
- Less Customization than Prometheus/Grafana: Dashboards are predefined with limited extensibility.
- Free Tier Limitations: Free plan has limited data retention and capped metrics/logs volume.
- Not Ideal for Large Enterprises: May lack some enterprise-level controls and integrations.
Other Highlights
- Supports both agent-based and agentless Kubernetes monitoring.
- Integrates with container runtimes like Docker and CRI-O.
- Includes Log Management with powerful search and filtering for troubleshooting.
- Built-in anomaly detection for proactive issue detection.
Pricing
- Free Tier: Basic usage with limited logs and metrics.
- Standard & Pro Plans: Affordable pricing based on usage, ideal for startups and small teams.
- On-Prem Option Available: For teams that require self-hosted observability.
💡 Sematext is perfect for small to mid-size teams that want a hassle-free, unified observability solution for Kubernetes with quick setup and solid core features.
Kubernetes Dashboard – The Default K8s Web UI
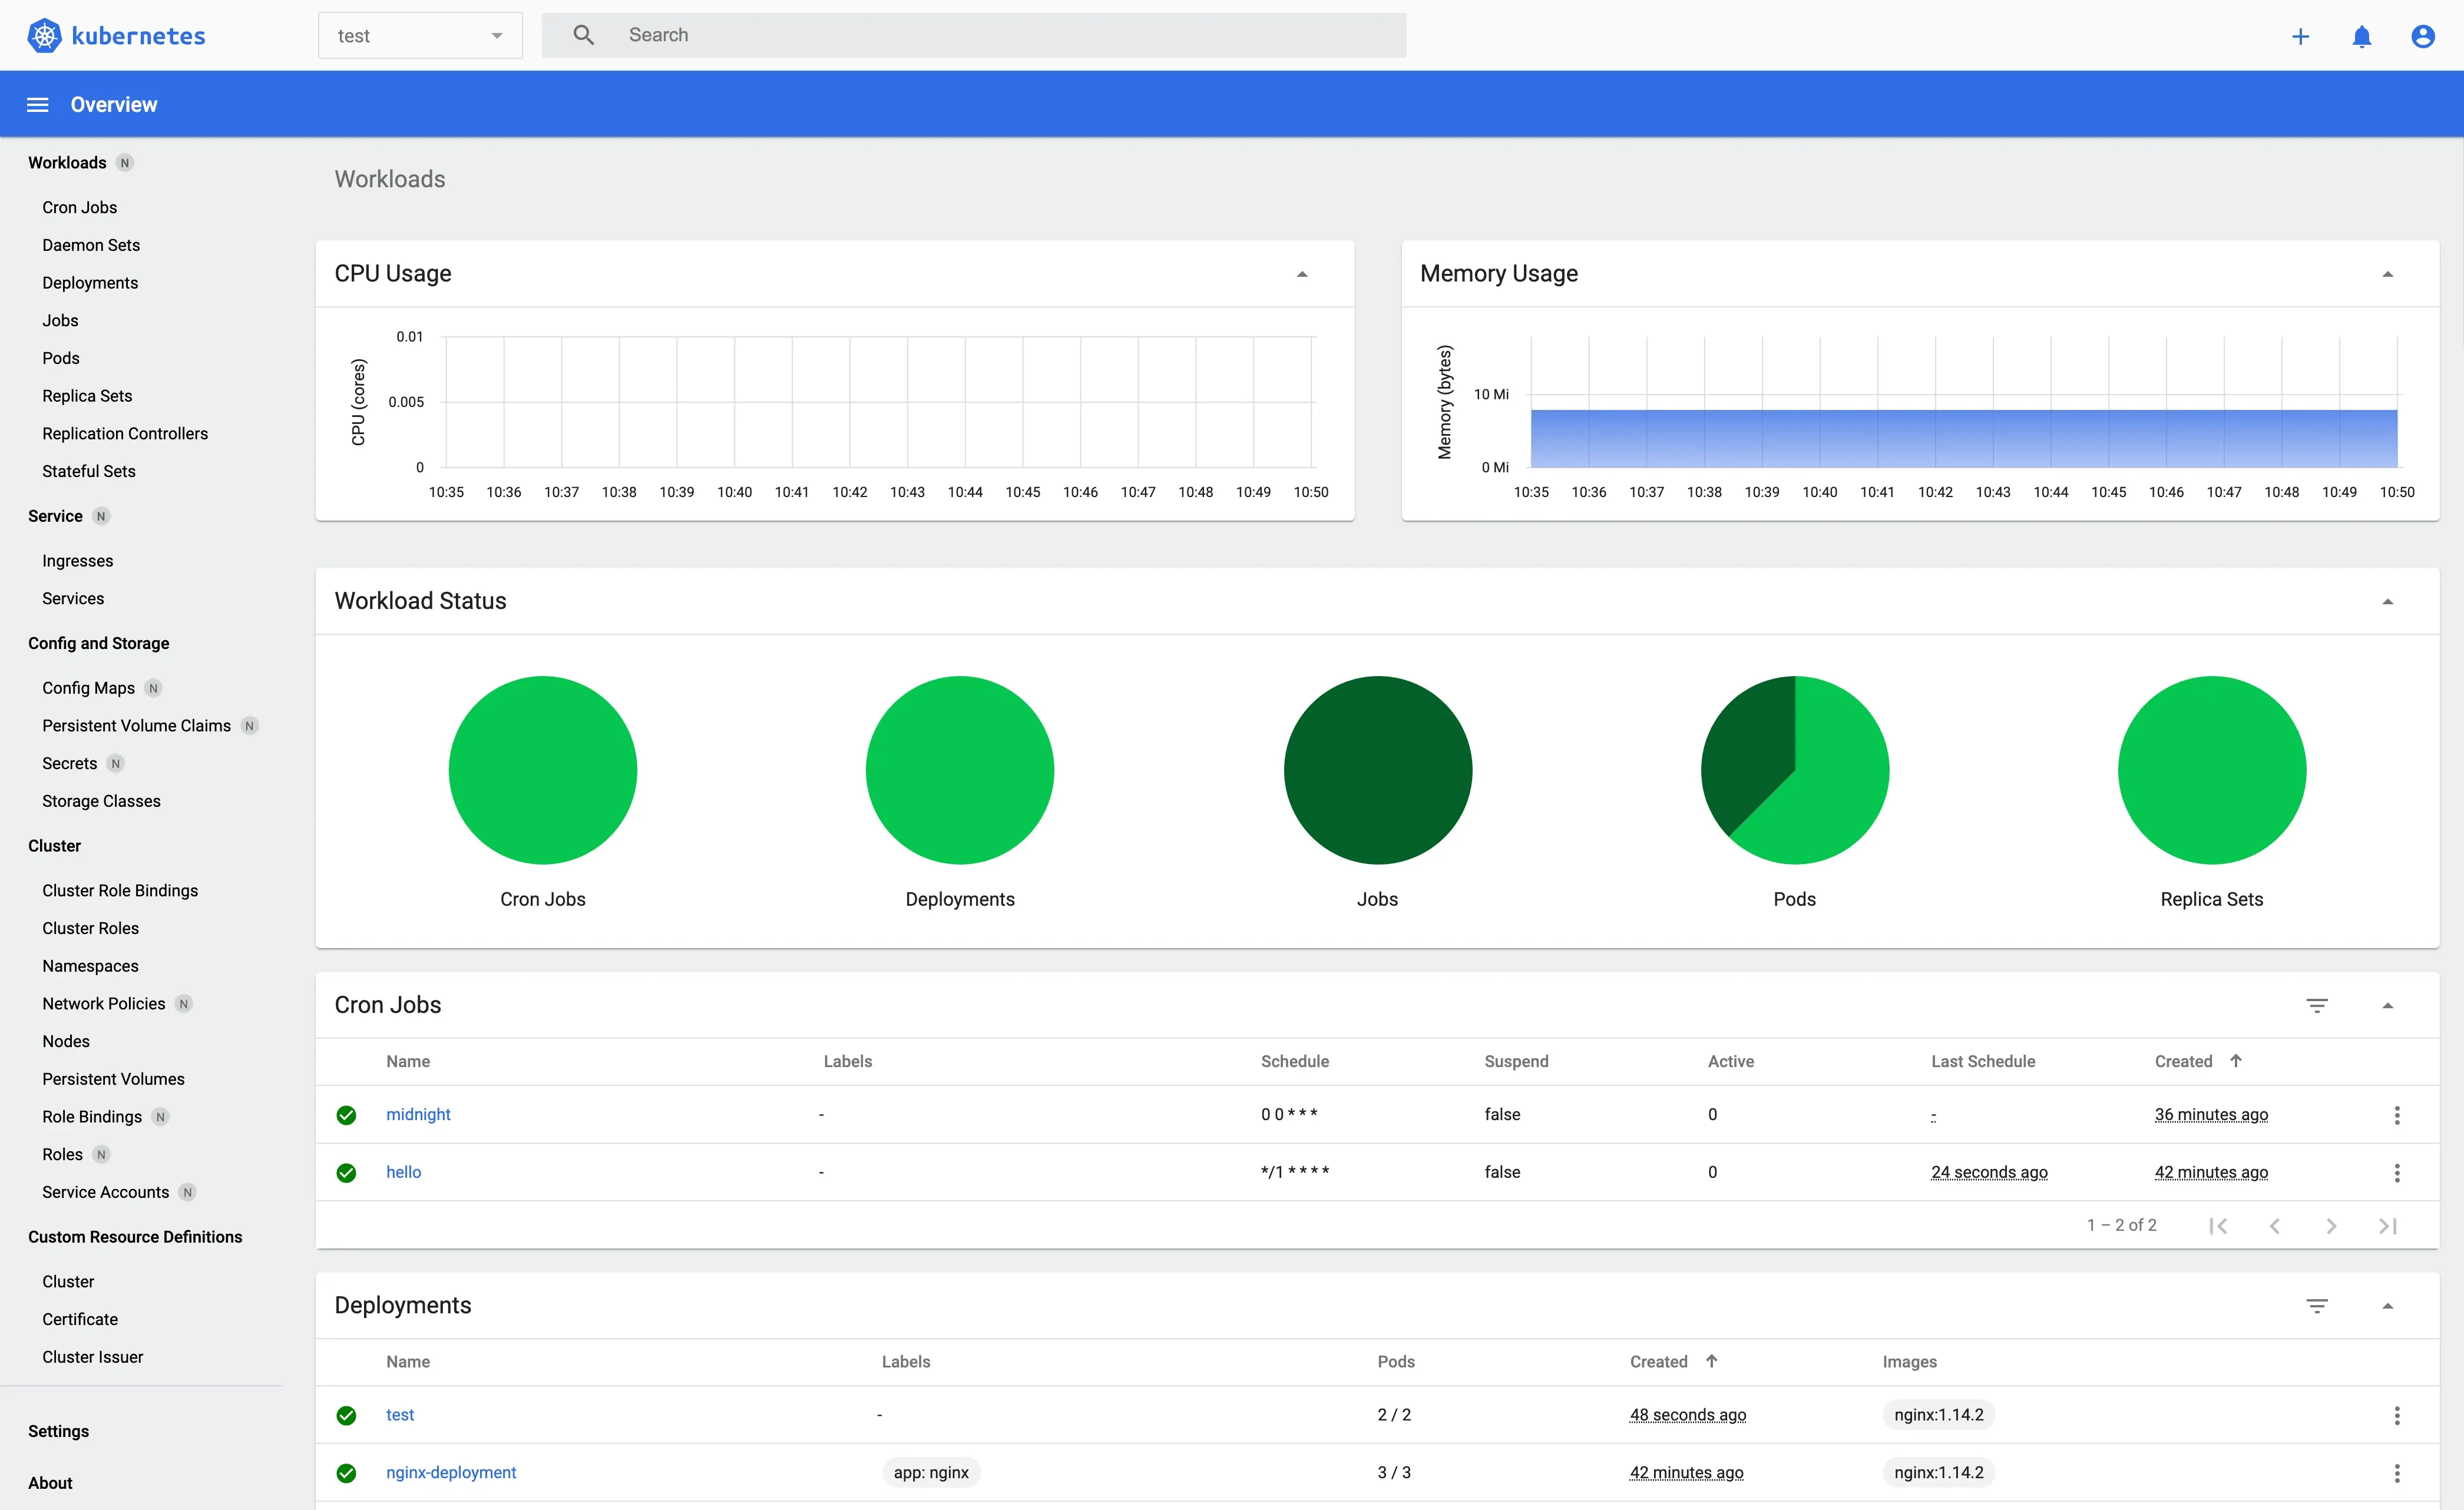
Kubernetes Dashboard is the official web-based user interface for managing Kubernetes clusters. It provides an easy way to interact with the Kubernetes API, view cluster resources, and perform basic operations.
Why Use Kubernetes Dashboard for Kubernetes Monitoring
- Native Web UI – A built-in visual interface to monitor and manage Kubernetes workloads directly in the cluster.
- Pod & Node Health Visibility – Real-time view of pods, nodes, and workloads to assess cluster health at a glance.
- Basic Troubleshooting – Inspect pod logs, monitor events, and debug issues without using
kubectl. - RBAC-Secured Access – Uses Kubernetes RBAC to control user permissions and ensure secure access to cluster data.
Limitations
- Limited Monitoring: Doesn't offer deep insights or visualizations like Prometheus or Grafana.
- Basic Functionality: Lacks advanced features like custom dashboards, detailed alerting, or multi-cluster views.
- No Built-in Logging or Tracing: Doesn't provide log or trace aggregation by default; needs integration with tools like Loki or Elasticsearch.
Other Highlights
- Easy-to-read metrics like CPU, memory usage, and pod health.
- Switch between different namespaces in your cluster for granular access.
- Perform Create, Read, Update, and Delete (CRUD) operations on Kubernetes resources.
Pricing
- 100% Free & Open Source: No cost involved, as it's part of the Kubernetes ecosystem.
💡 Kubernetes Dashboard is best if you need a simple, native UI for monitoring and managing your Kubernetes resources directly from the Kubernetes API, with minimal setup.
cAdvisor – Container Monitoring with a Focus on Resource Usage
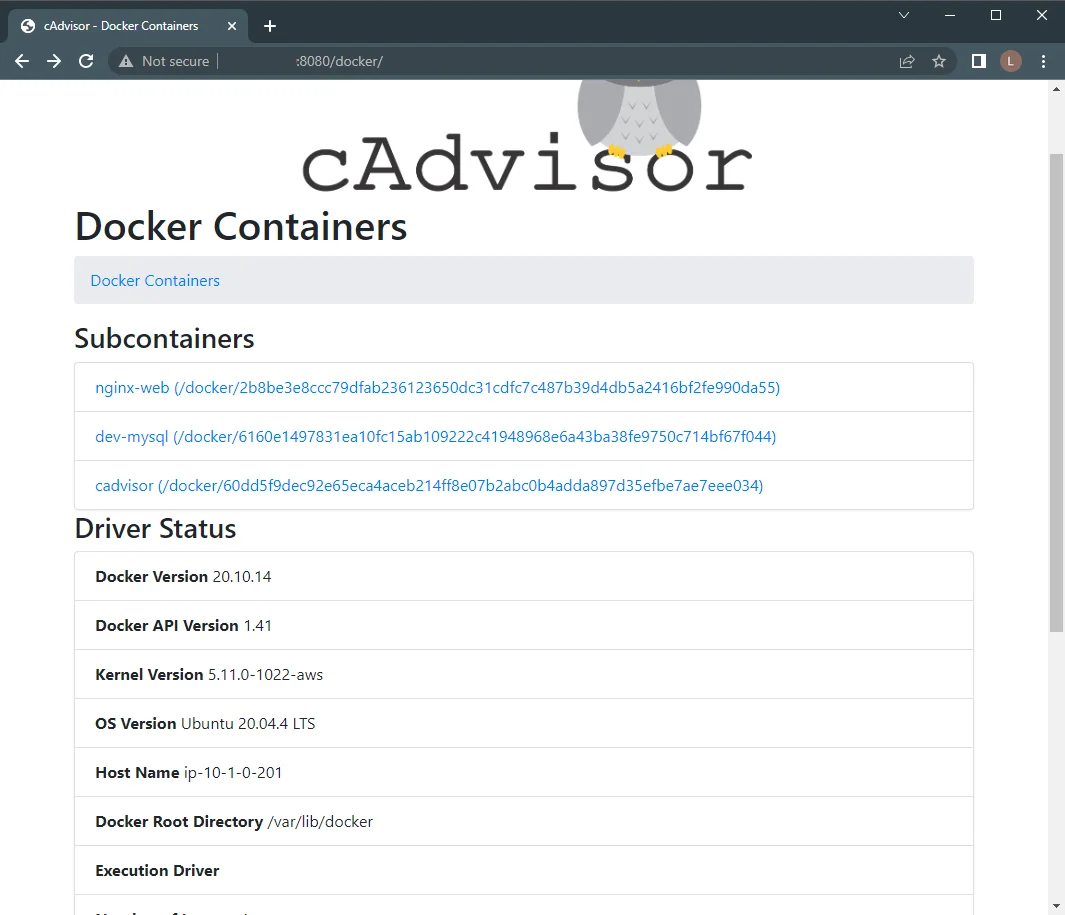
cAdvisor is an open-source container monitoring tool developed by Google, designed to collect and expose container-level resource usage metrics. It provides insight into the CPU, memory, disk, and network usage of running containers.
Why Use cAdvisor for Kubernetes Monitoring
- Granular Container Metrics – Provides per-container stats like CPU, memory, and I/O usage directly from the kubelet.
- Real-Time Monitoring – Captures live resource usage data for pods and containers.
- Lightweight Agent – Runs as a daemon with minimal overhead, perfect for edge or resource-constrained clusters.
- Prometheus-Friendly – Easily scrapes metrics into Prometheus for visualization via Grafana.
Limitations
- No Built-In Storage: Does not provide long-term storage; needs external tools like Prometheus to store and analyze historical data.
- Limited Visualization: Basic UI that's useful for quick checks but lacks advanced analytics or dashboards.
- No Distributed Monitoring: Does not support monitoring across clusters or nodes without additional integrations.
Other Highlights
- cAdvisor can be easily run as a container within Kubernetes, making it simple to deploy and manage.
- Works with both Docker and rkt containers for monitoring.
- Exposes metrics in a format easily scraped by Prometheus.
- Provides detailed resource usage stats on CPU, memory, network, and I/O operations for each container.
Pricing
- 100% Free & Open Source: No costs associated, as it's freely available under an open-source license.
💡 cAdvisor is perfect for teams needing a simple, efficient tool to monitor container-level metrics in real-time, with minimal setup required.
bpfman – eBPF Manager for Kubernetes
bpfman is an open-source eBPF management tool that simplifies the deployment, lifecycle management, and monitoring of eBPF programs within Kubernetes clusters. It provides a secure, efficient way to manage eBPF programs across your entire Kubernetes environment.
Why Use bpfman for Kubernetes Monitoring
bpfman excels in eBPF program management and secure deployment. It is highly beneficial for Kubernetes environments with the following features:
- eBPF Program Management: Simplifies the lifecycle of eBPF programs across Kubernetes clusters, with easy deployment and removal of programs through Kubernetes custom resources like
XdpProgramandTcProgram. - Enhanced Security: The bpfman daemon tightly controls the loading of eBPF programs, ensuring only authorized users or services can interact with the eBPF ecosystem, significantly improving security.
- Multi-Program Support: Supports the coexistence of multiple eBPF programs, ensuring smooth interaction between programs like XDP and TC, which is often a challenge in Kubernetes.
- Visibility & Debugging: Provides deep visibility into all eBPF programs running on your nodes, enhancing debugging capabilities for both developers and administrators.
- Easy Integration with Kubernetes CRDs: bpfman provides Kubernetes CRDs for eBPF program deployment, enabling fine-grained control over the execution and management of programs.
Limitations
- Requires Privileged Access: eBPF programs require privileged pods (CAP_BPF), which can introduce security concerns if not managed properly.
- Complex Setup: Setting up eBPF programs in Kubernetes requires careful planning, especially for managing pod restarts and program lifecycle.
- Debugging Challenges: Troubleshooting issues with eBPF programs can be complex, particularly if there's interference between different programs or if programs are not properly monitored.
- Limited Ecosystem Integration: While bpfman simplifies eBPF program management, it lacks some of the broader ecosystem integrations seen with other Kubernetes observability tools.
Other Highlights
- Fine-Grained Version Control for userspace and kernelspace eBPF programs.
- eBPF Bytecode Image Specifications allow for separate versioning control and signing for bytecode ownership verification.
- Secure RBAC Integration ensures that only authorized users can deploy or modify eBPF programs across nodes.
- Detailed eBPF Program State Monitoring for full visibility into which eBPF programs are running and their impact.
Pricing
- Self-Hosted: Free and open-source.
- Managed Services: No official managed cloud offering. Suitable for self-hosted Kubernetes clusters.
💡 If you're running Kubernetes with eBPF-based networking, security, or observability tools, bpfman provides a highly efficient, secure way to manage your eBPF programs without requiring deep system-level expertise.
Key Takeaways
- Effective Kubernetes monitoring is fundamental for application reliability and stability.
- Choose tools that align with your team's expertise and your environment's complexity.
- Prioritize solutions offering visibility into metrics, logs, and ideally traces for comprehensive insights.
- Automation in alerting and anomaly detection is crucial for proactive issue resolution at scale.
- Consider the long-term scalability and cost-effectiveness of your chosen monitoring solution.
- Understanding your application's performance within the Kubernetes context is key for optimization.
- Open standards like OpenTelemetry offer flexibility and avoid vendor lock-in for observability data.
