Kubernetes Monitoring - What to Monitor, Tools and Best Practices
Kubernetes has since emerged as “THE” container orchestration platform for deploying and managing containerized workloads as a result of its robust capabilities. However, the complexity of its architecture and its dynamic nature present significant challenges in monitoring deployed workloads and the platform itself.
Kubernetes monitoring is crucial for maintaining the health, performance, and reliability of containerized applications. It provides insights into resource utilization, system behavior, and potential bottlenecks, ensuring optimal operation.
This article will discuss Kubernetes monitoring and why it is important, the key metrics to monitor, and best practices for monitoring.
What is Kubernetes Monitoring?
Kubernetes monitoring is a critical process for keeping your Kubernetes clusters running in fine health. It is a proactive approach that involves continuously tracking, analyzing, and visualizing the health and performance of a Kubernetes cluster. This approach enables the early detection and resolution of potential issues before they disrupt applications or the cluster itself.
Why is Kubernetes monitoring important?
Kubernetes monitoring is important for several reasons as it is necessary to keep your containerized infrastructure running properly. Here are some of the reasons why you should monitor your Kubernetes cluster:
- It provides complete visibility into your cluster and nodes.
- It helps in detecting anomalies or deviations from expected behavior, such as sudden increases in resource usage, pod failures, or application errors.
- It provides real-time performance insights for you to act on.
- It reduces MTTR as you can drill down into issues quickly to resolve problems.
- It helps in identifying and addressing potential issues before they impact applications and users.
What Kubernetes Metrics Should You Monitor?
Metrics are specific measurements or data points collected from systems. They provide quantifiable information about different aspects of the system, such as CPU usage, memory consumption, network traffic, and application performance.
Monitoring your Kubernetes clusters involves collecting and analyzing these metrics to gain insights into the health, performance, and overall well-being of your containerized applications. To effectively monitor your Kubernetes clusters, the first step is to decide what metrics are most relevant to your monitoring needs. Here are some key metrics to monitor in Kubernetes:
Control plane metrics
The control plane is responsible for managing the state of the cluster, including scheduling, orchestration, and policy enforcement. Issues with the control plane can lead to cluster instability, affecting the deployment and operation of applications so monitoring the control plane ensures the cluster operates smoothly and efficiently.
The control plane is made up of the API server, kube-scheduler, etcd, kube-controller-manager, and cloud-controller-manager. Here are some important metrics to monitor for each of these components:
- etcd:
- Request latency: High latency can indicate issues with etcd's ability to process requests efficiently, potentially leading to degraded cluster performance
- Leader elections: Frequent leader elections can signify instability in the etcd cluster, which could disrupt cluster operations. Leader elections should be rare.
- Database size: A rapidly growing database size might indicate a memory leak or excessive storage of unnecessary data, potentially impacting etcd's performance.
- API Server:
- Request rates, response times, and error rates: This helps you detect API server bottlenecks or failures that could prevent users and controllers from interacting with the cluster.
- Client Connections: Monitoring the number of concurrent client connections can help identify if the API server is becoming a bottleneck under high load.
- Authentication Failures: Tracking authentication failure rates can help in identifying unauthorized access attempts or misconfigurations.
- kube-scheduler:
- Scheduled Pods: Monitoring the rate of scheduled pods can give insights into the scheduler's efficiency and the overall demand on the cluster.
- Preemption Events: Keeping track of preemption events (when a pod is evicted from a node) can help in understanding the competition for resources among pods.
- kube-controller-manager:
- Reconcile Rates: Monitoring the frequency of reconciliations performed by controllers can help identify inefficiencies or bottlenecks in controller operations.
- Error Rates: Tracking errors in controller operations can highlight issues with the cluster's self-healing capabilities.
Monitoring these metrics is vital for maintaining the stability, performance, and reliability of the Kubernetes cluster.
Node metrics
Nodes are responsible for running containerized applications and executing tasks assigned by the control plane. Without the nodes, there would be nowhere for your pods to run which makes them important. Monitoring node metrics is crucial for promptly detecting issues such as resource constraints or performance bottlenecks. Here are some important node metrics to monitor:
- CPU/Memory/Disk Usage: Track these resource metrics per node to identify nodes nearing capacity. This allows you to proactively scale your cluster or redistribute pods to maintain healthy node utilization.
- Network Traffic (Bytes In/Out): Monitor network bandwidth usage to identify nodes experiencing heavy network traffic. This could indicate network bottlenecks or potential security threats.
- Node Conditions: Pay attention to
Ready,OutOfDisk, andMemoryPressureconditions. These provide vital information about the node's overall health and resource availability.
Pod metrics
Pods are responsible for running containers. Pod metrics can be collected and analyzed to understand how pods are utilizing resources. They provide insights into the behavior and performance of individual pods in a Kubernetes cluster. Pod metrics include pod health (running, pending, failed), CPU and memory usage, and network traffic. Here are some important pod metrics to monitor:
- Restart Counts: Frequent pod restarts may indicate problems with the application code or configuration.
- Resource Requests/Limits vs. Actual Usage: Compare pod resource requests and limits with their actual usage. This helps you understand whether you're allocating resources effectively.
- Liveness/Readiness Probes: Monitor the success/failure rates of liveness and readiness probes. Failed probes can indicate unhealthy pods that should be replaced.
Container metrics
Containers are responsible for encapsulating and running application code, along with its dependencies. Container metrics provide insights into the performance and resource utilization of individual containers within a pod. These metrics are crucial for ensuring that containers are functioning efficiently and not consuming more resources than necessary. Here are some important container metrics to monitor:
- CPU/Memory Usage: Track these per-container metrics to pinpoint resource-hungry containers that might need optimization or additional resources.
- Container Restarts: Similar to pod restarts, frequent container restarts are often a sign of underlying issues.
Kubernetes Monitoring Challenges
A primary challenge DevOps and SRE teams face in monitoring Kubernetes is its architectural complexity. This complexity arises from the need to monitor applications spanning multiple components like containers, pods, and namespaces in a cluster or across fleets of clusters.
Additionally, Kubernetes generates a vast amount of metrics from its different components. Traditional monitoring methods may focus on collecting specific metrics or support only certain types of sources. Even after metrics are collected, it is quite difficult to correlate them for effective analysis to identify and address issues.
Another monitoring challenge has to do with the ephemeral and dynamic nature of pods and containers. Pods and containers have a transient lifecycle - can be created, updated, restarted, and destroyed. These constant changes make it hard to track the health and performance of applications and services running in them.
Kubernetes Monitoring Best Practices
There are best practices to be adopted and implemented to effectively monitor the health, performance, and reliability of Kubernetes clusters and the applications running within them. Here are some of them:
Identify the right metrics to monitor
There are a vast number of Kubernetes metrics, if you are not careful, you may find yourself monitoring the wrong things. It is important to identify metrics in line with your monitoring objective. For instance, if performance is your focus, prioritize CPU usage, memory consumption, and request latency metrics.
Prioritize the use of tags and labels
Tags and labels provide additional context and organizational structure to your Kubernetes environment, making it easier to manage, monitor, and troubleshoot. By attaching consistent labels across various Kubernetes objects, such as pods, deployments, namespaces, and nodes, you can efficiently filter and analyze issues within specific parts of your application.
Tags and labels matter for the following reasons:
- Granular Filtering and Grouping: They enable easy filtering and grouping of metrics based on specific criteria such as environment (filter metrics for pods running in "production" vs. "staging"), application tier (isolate metrics for the "frontend" components of your application), or microservices (focus on metrics related to a specific microservice, such as the "payment" service).
- Troubleshooting: Quickly identify the source of an issue by filtering logs and metrics based on labels. For instance, you might investigate a latency problem by focusing on pods labeled with a specific version of your application.
- Alerting: It helps in creating targeted alerts that trigger only when specific labeled resources experience problems. For example, you could get an alert if CPU usage exceeds a threshold for pods labeled as "critical."
Implement “Single Pane of Glass” monitoring
This approach involves consolidating all monitoring data into a single, unified interface, making it easier to monitor and manage your cluster. This consolidated view simplifies the process of monitoring and managing your Kubernetes environment, as it eliminates the need to switch between multiple tools and interfaces.
This also helps in correlating monitoring data. By having all metrics, logs, traces, and events in one place, you can easily see how different parts of your system interact. This allows you to identify patterns and pinpoint the root cause of issues much faster.
Choose the right monitoring tool
Choosing the right Kubernetes monitoring tool is pivotal for the continuous health and performance of your Kubernetes clusters. Here are key factors to consider when selecting a tool:
- Performance Evaluation: Scrutinize the tool's performance metrics thoroughly.
- User-Friendly Interface: Assess the tool's interface for intuitiveness and accessibility.
- Ease of Implementation: Prioritize tools that are straightforward to deploy and manage.
- Integration Capabilities: Evaluate how seamlessly the tool integrates with existing systems and tools.
- Scalability: Ensure the tool can scale alongside your Kubernetes infrastructure.
- Cost Considerations: Analyze the pricing structure to align with your budget and needs.
- Community and Support: Opt for tools backed by active communities and robust support channels for troubleshooting and assistance.
Popular Kubernetes Monitoring Tools
Selecting the ideal monitoring tool requires a comprehensive evaluation of its features and pricing to your specific monitoring requirements. To aid in this decision-making process, we have compiled a list of the most popular Kubernetes monitoring tools available, ranging from open-source to SaaS solutions.
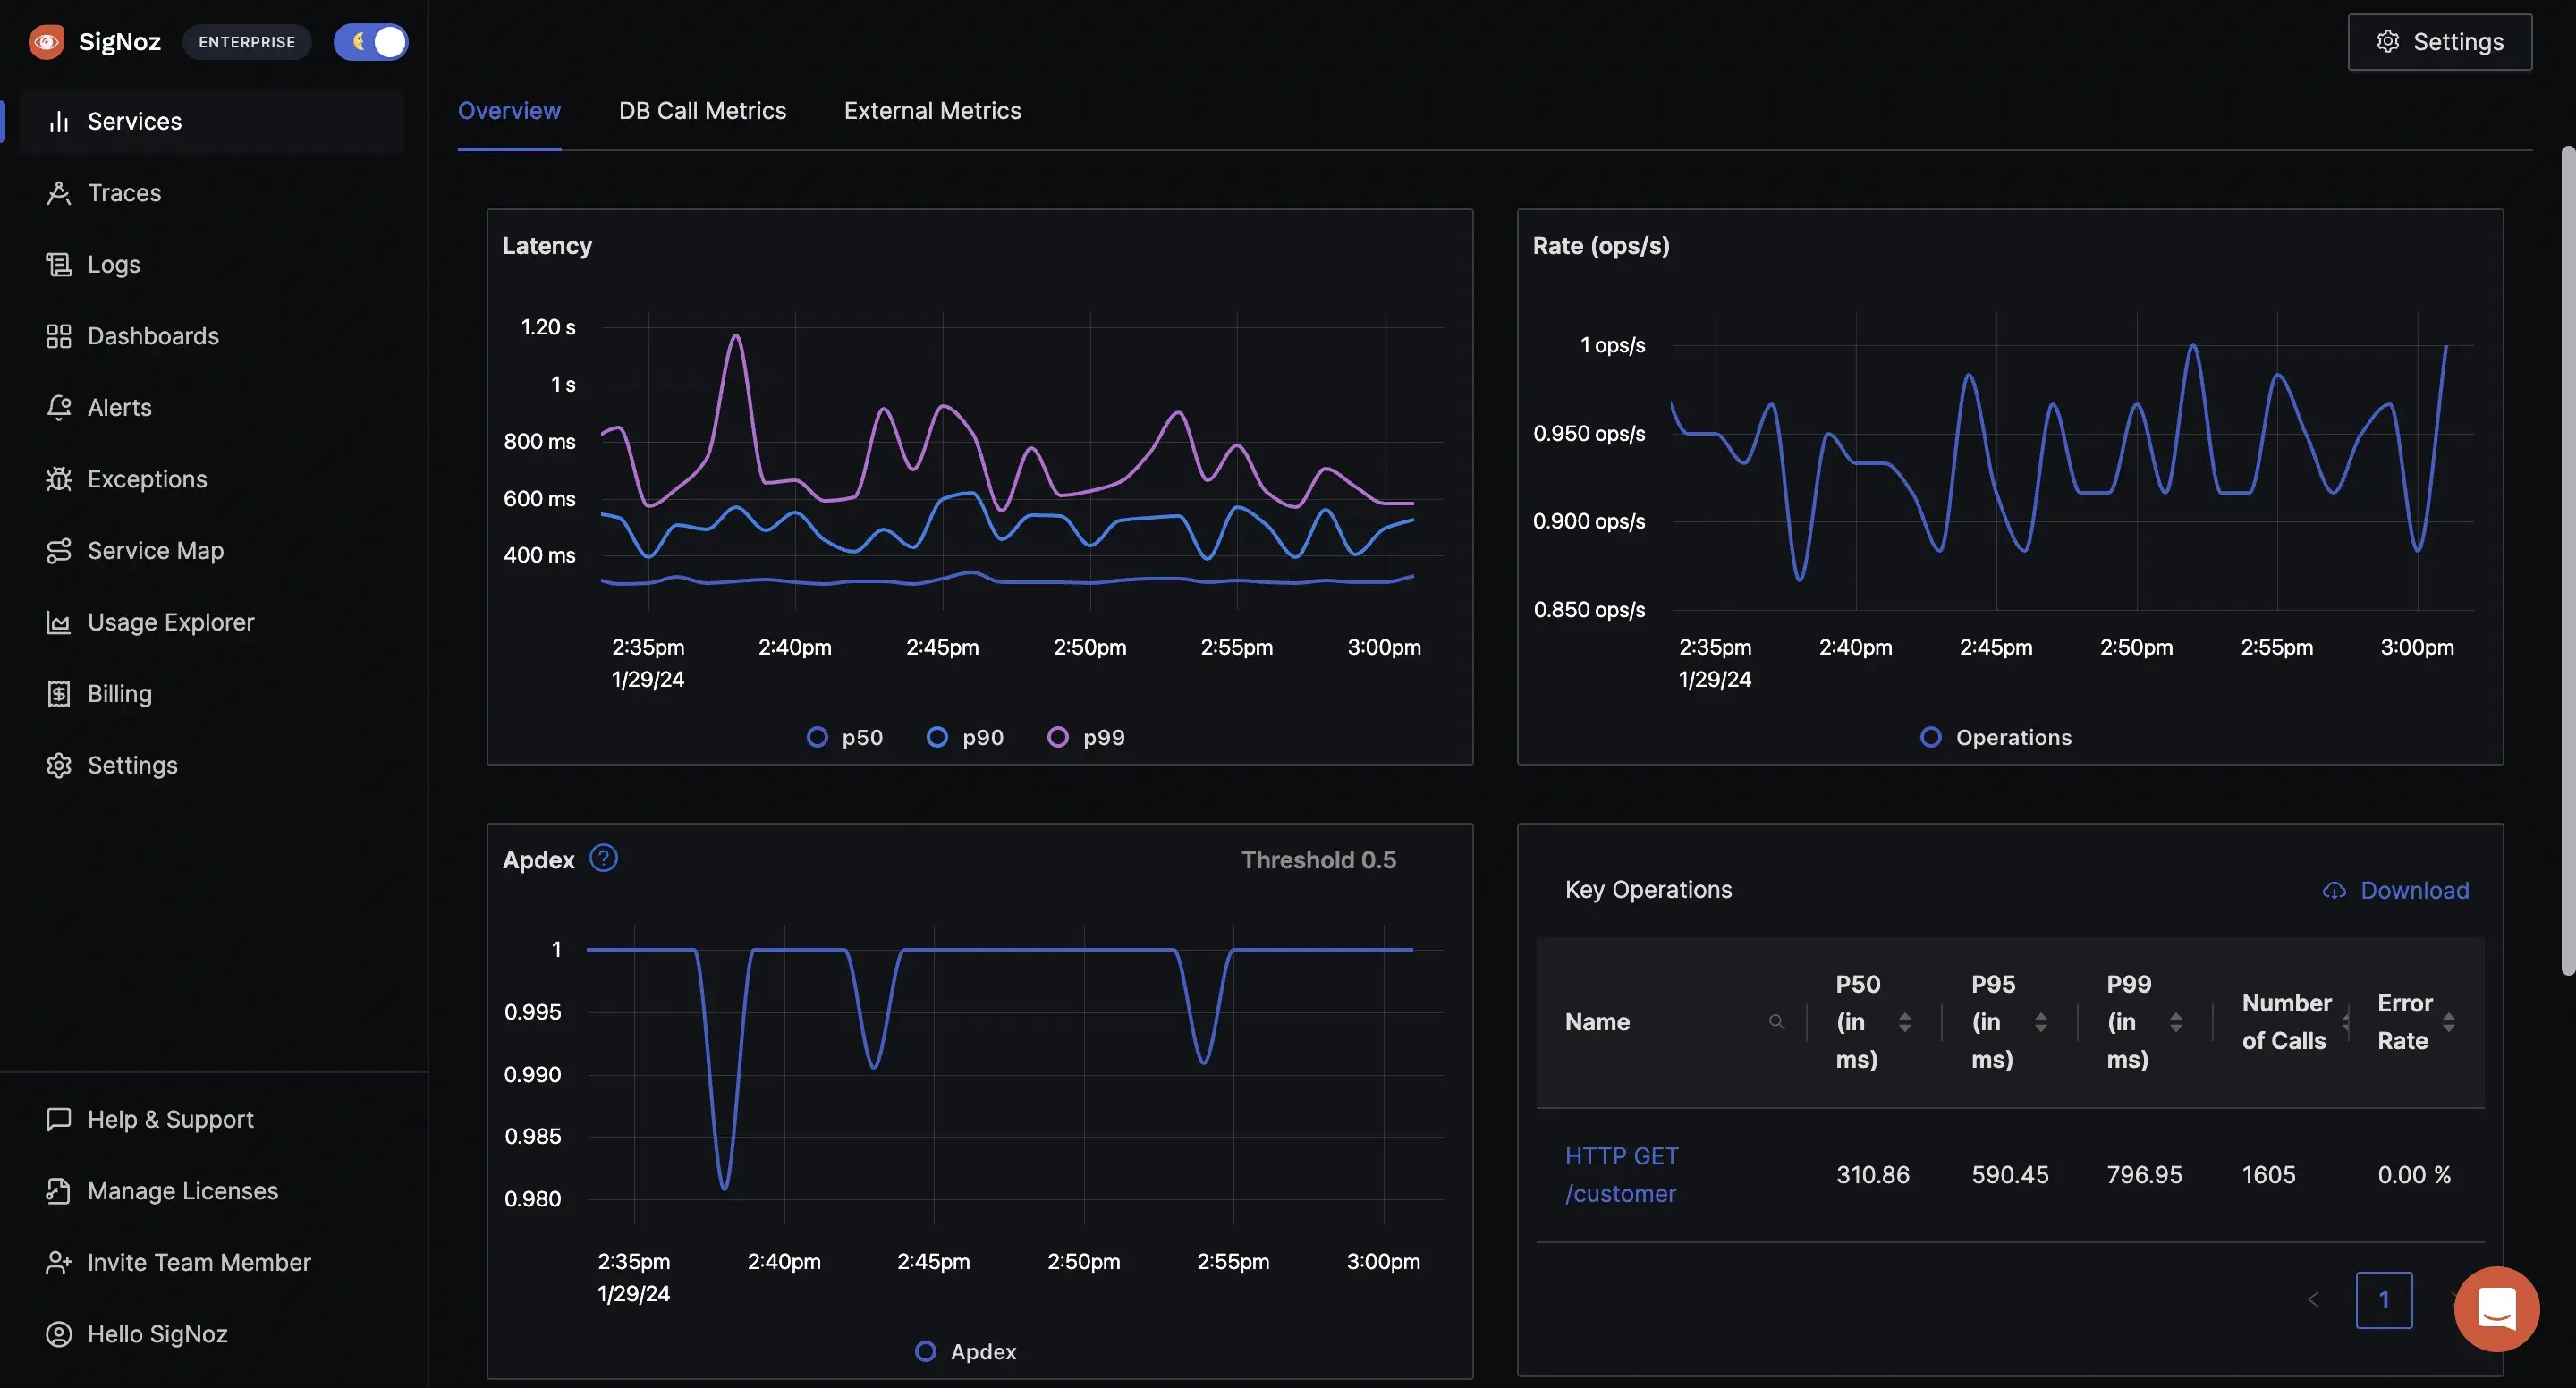
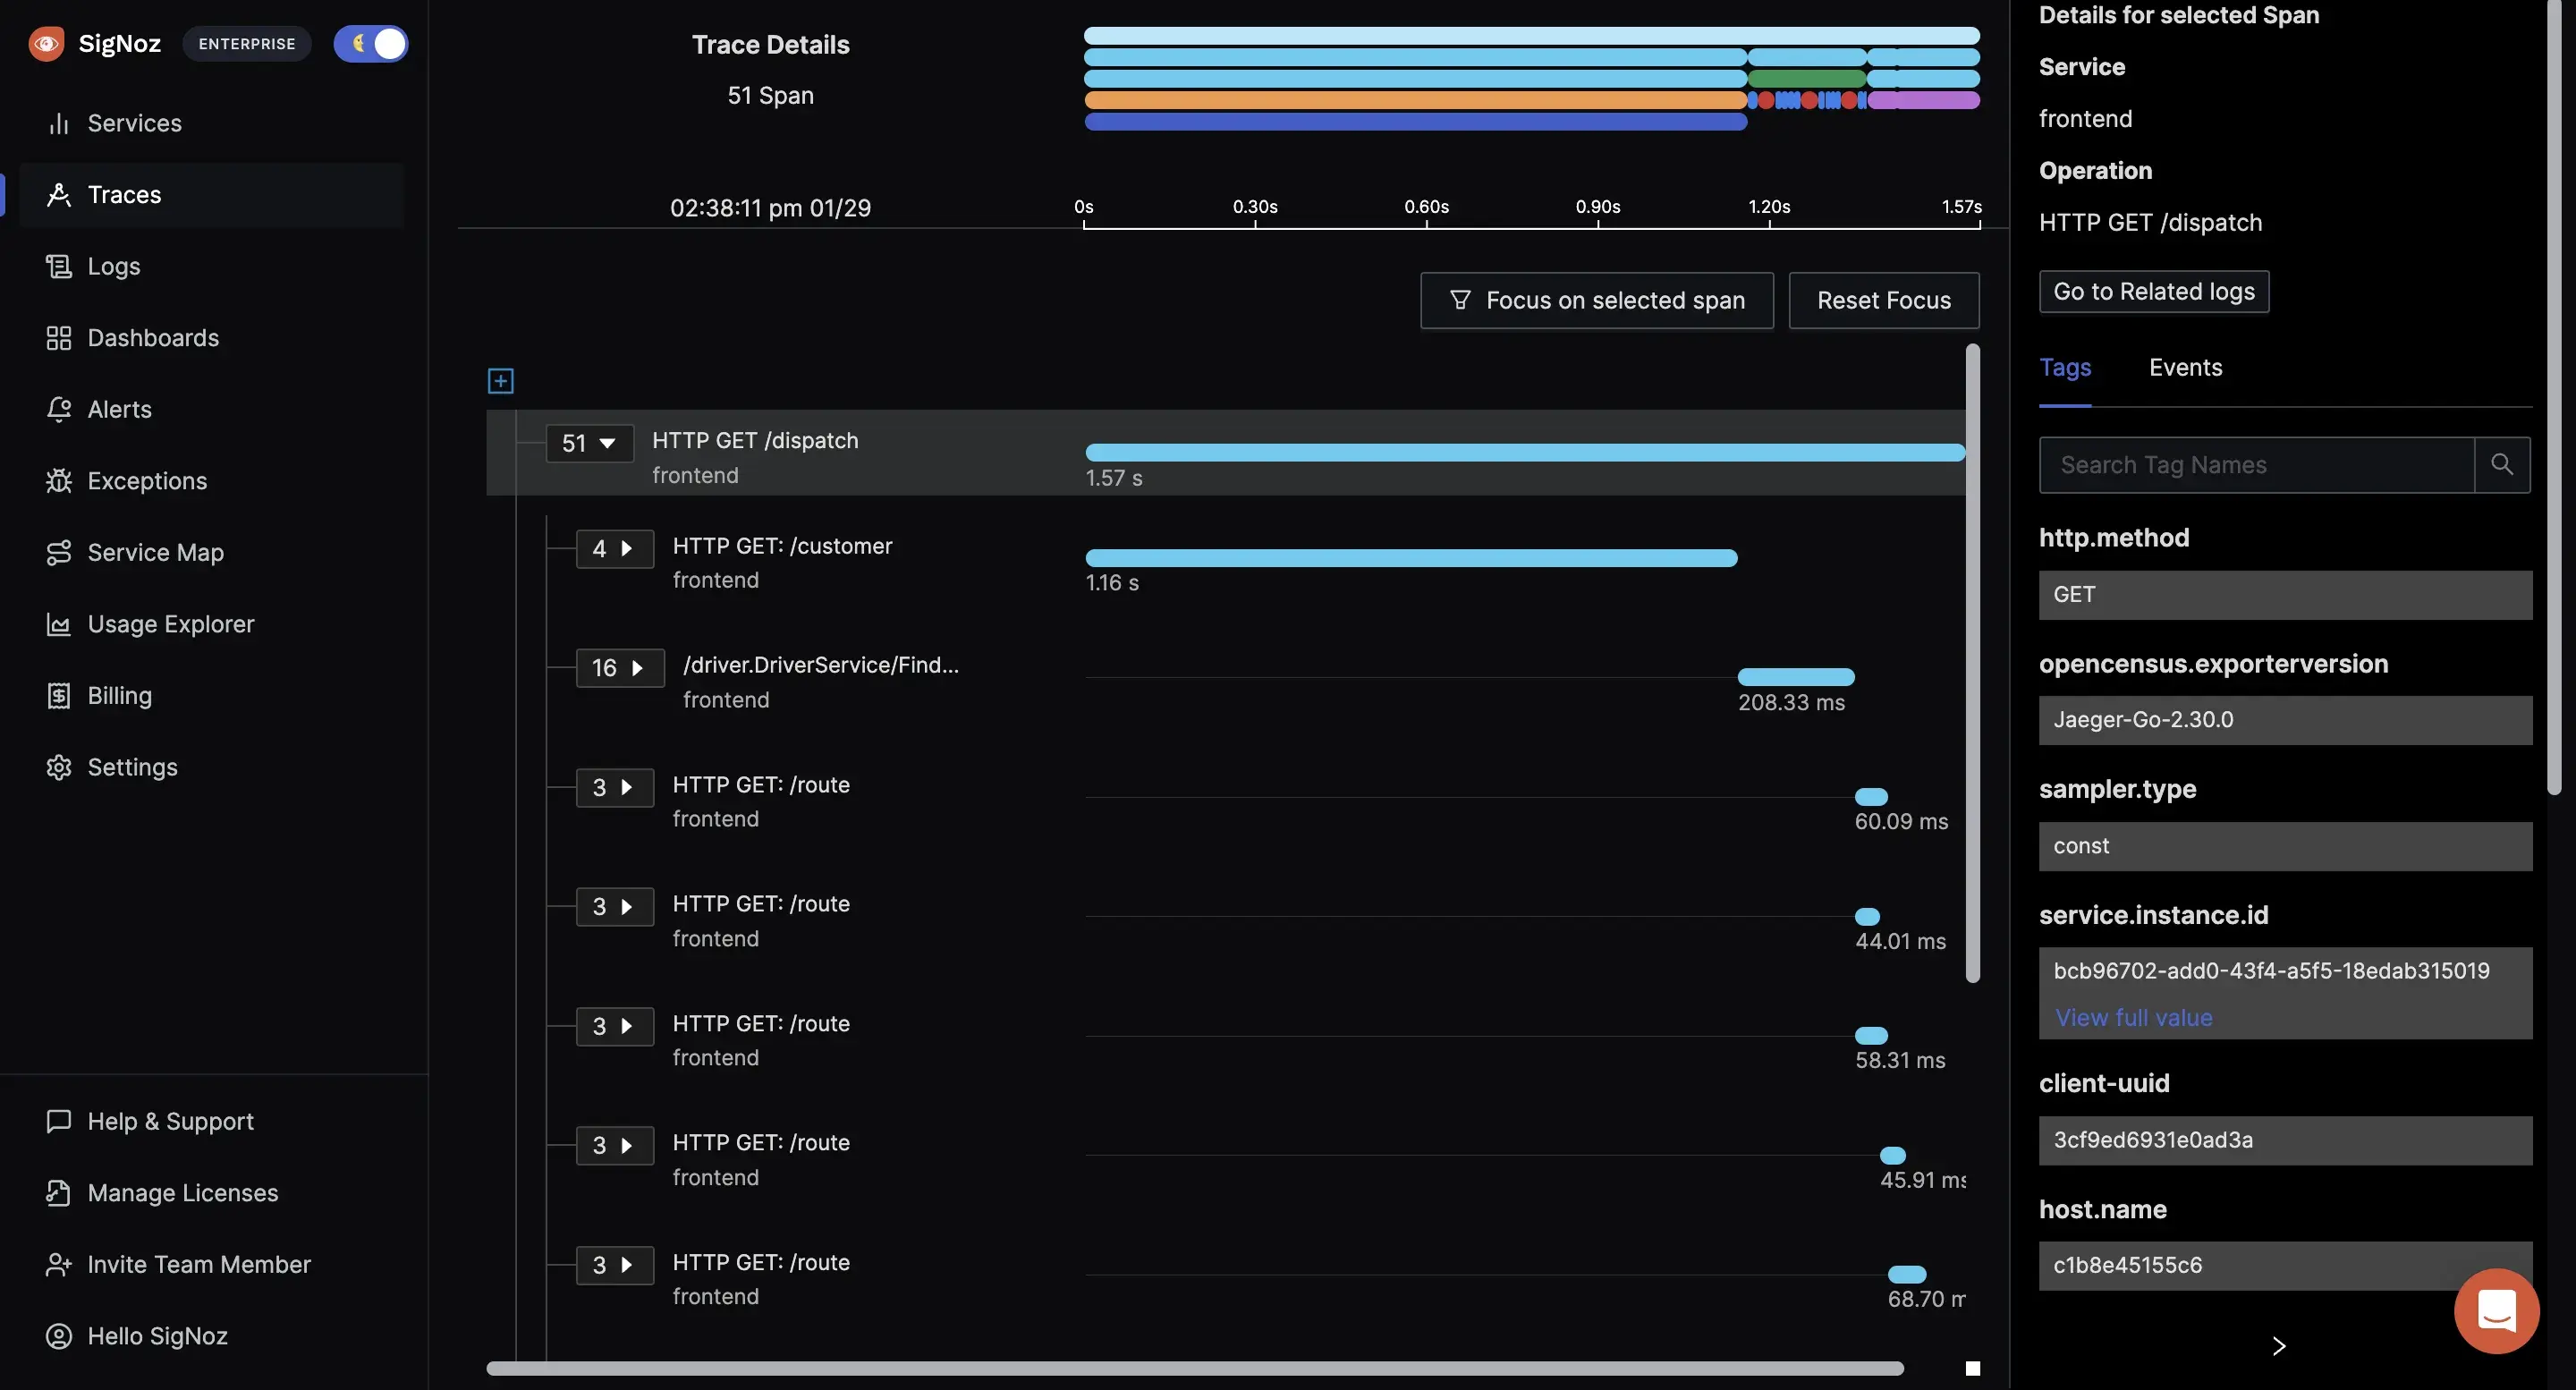
Monitoring Kubernetes with SigNoz
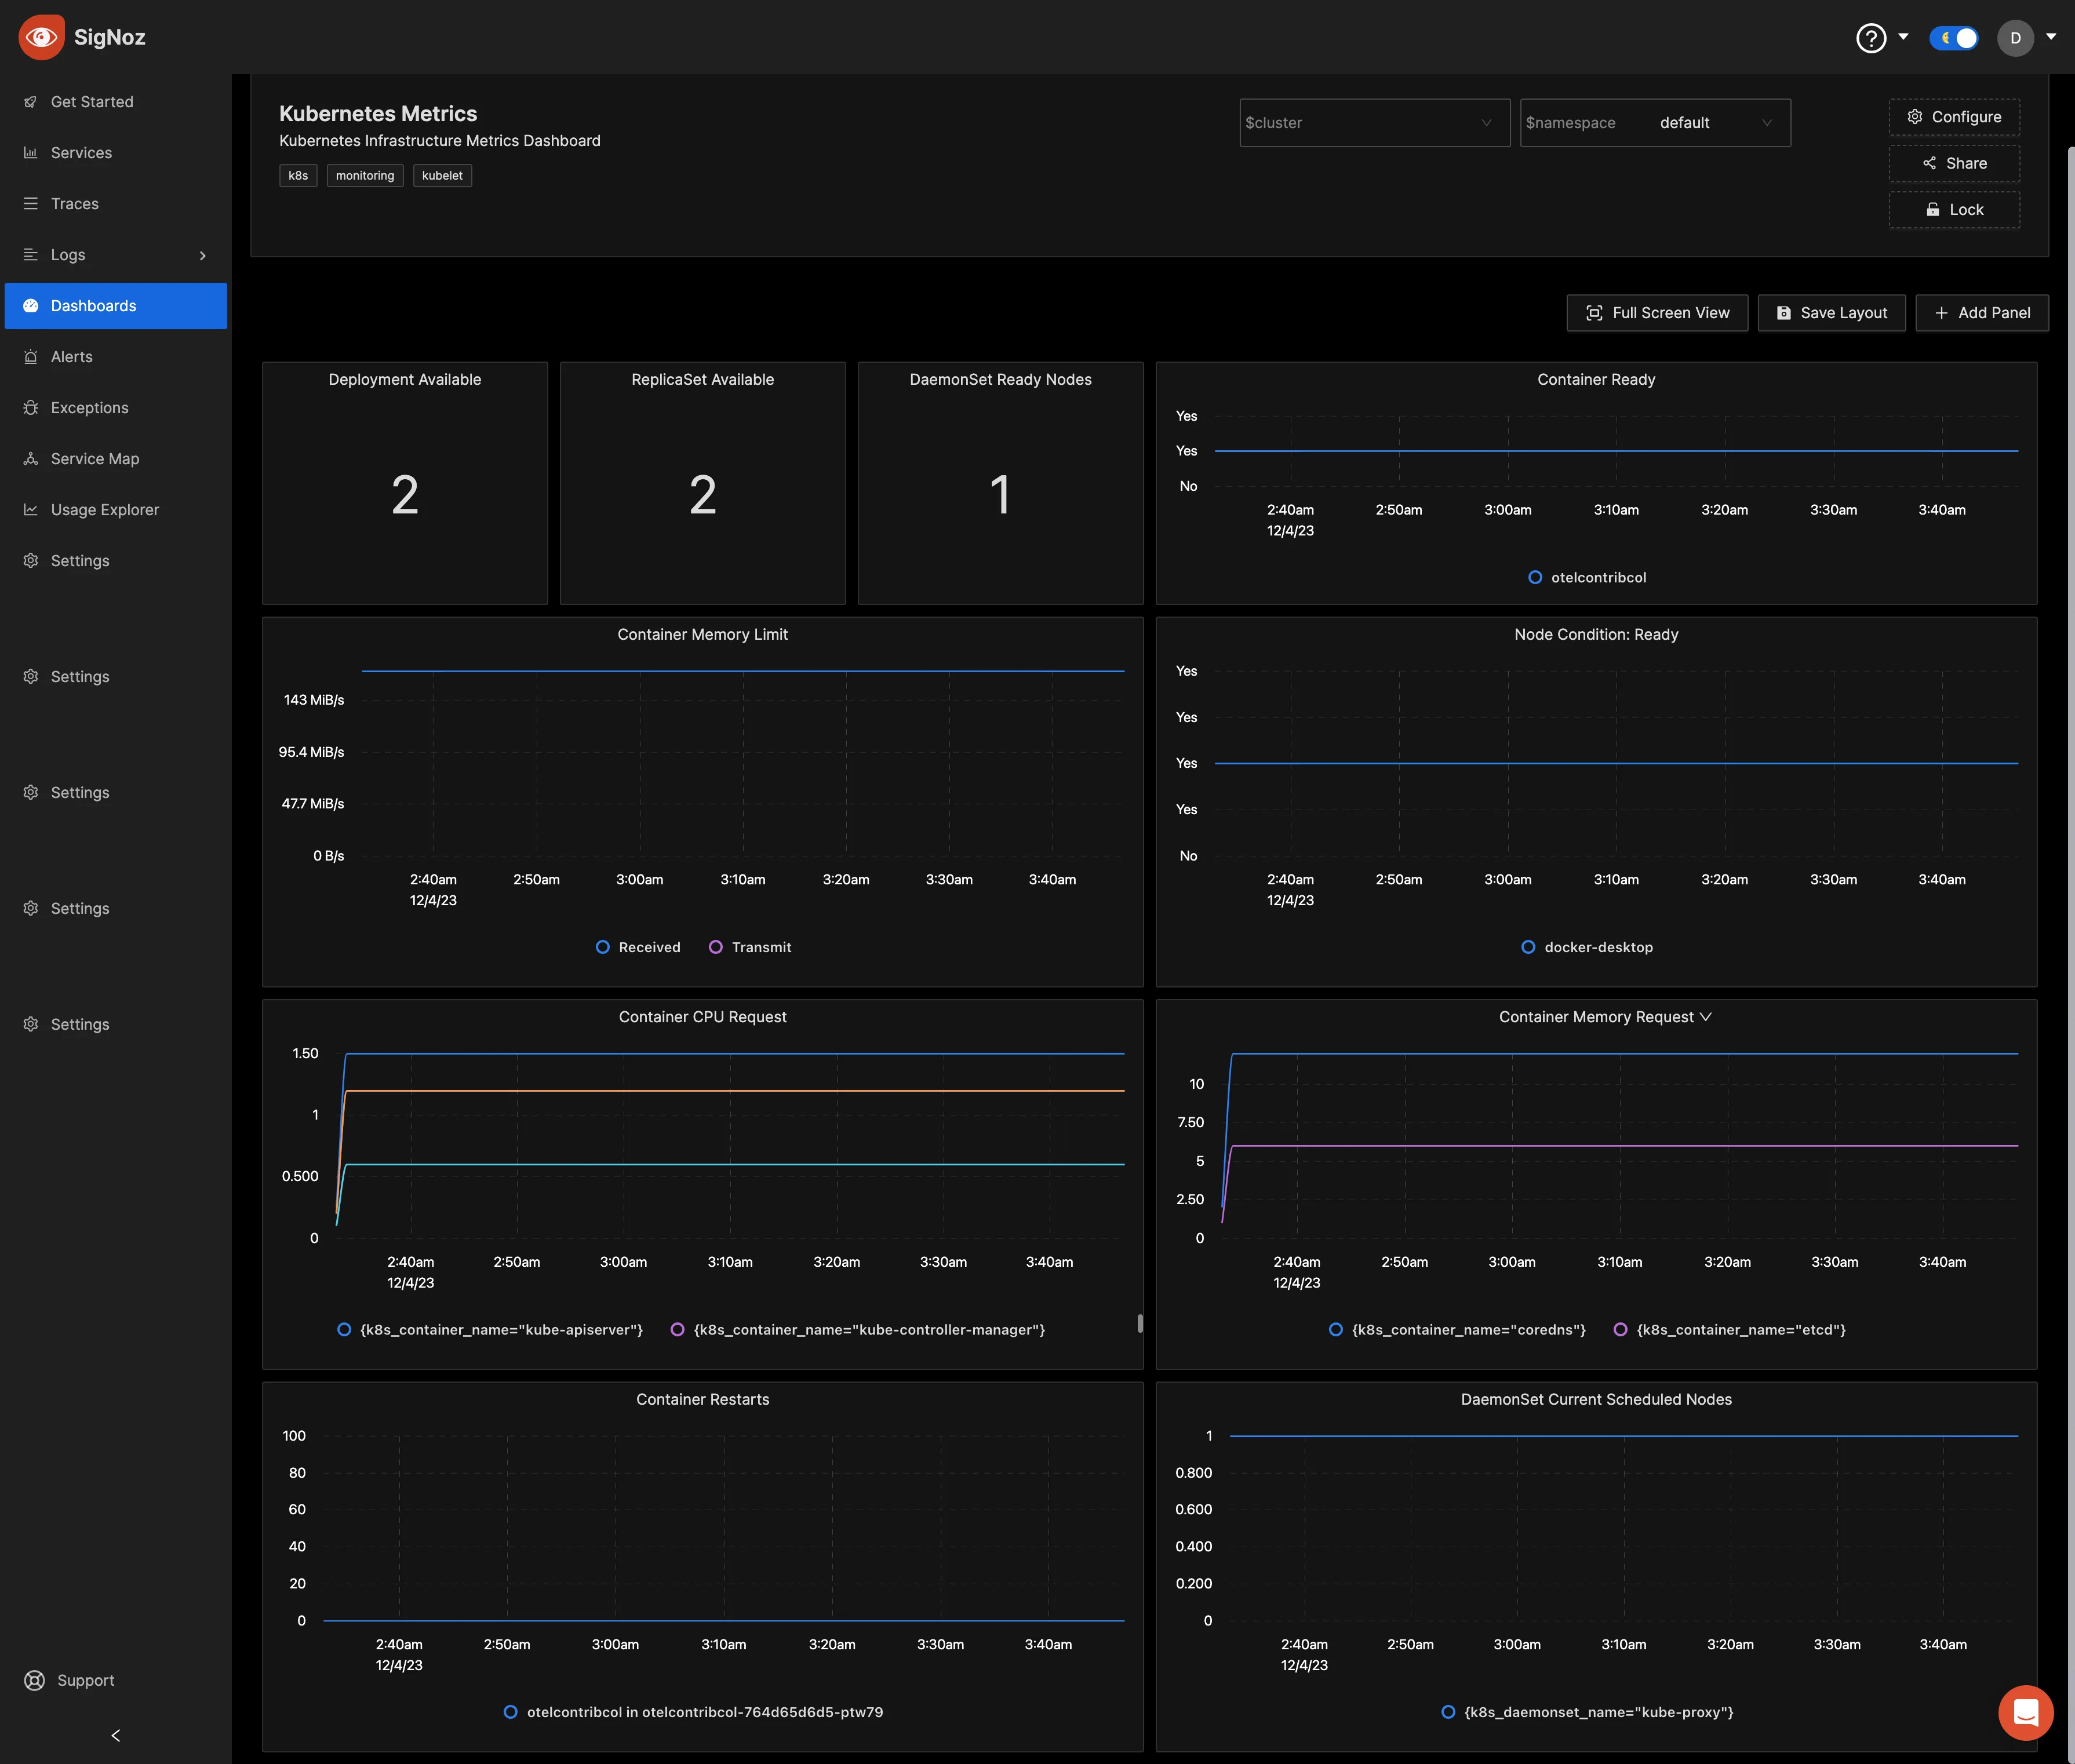
SigNoz is an open-source observability and monitoring platform that stands out as a powerful solution for Kubernetes monitoring. It is built on OpenTelemetry, an emerging standard for generating telemetry data (metrics, logs, traces). This foundation provides a unified approach to collecting and analyzing telemetry data with SigNoz, thereby avoiding vendor lock-in and facilitating seamless integration with various technologies and frameworks.
With SigNoz, monitoring Kubernetes environments is a streamlined process as it is facilitated by the OpenTelemetry components. This ensures comprehensive visibility into the intricate workings of your Kubernetes cluster and helps identify issues proactively.
With SigNoz, you can perform the following:
- You can visualize your Kubernetes metrics with the different views provided including charts, bars, gauges, etc.
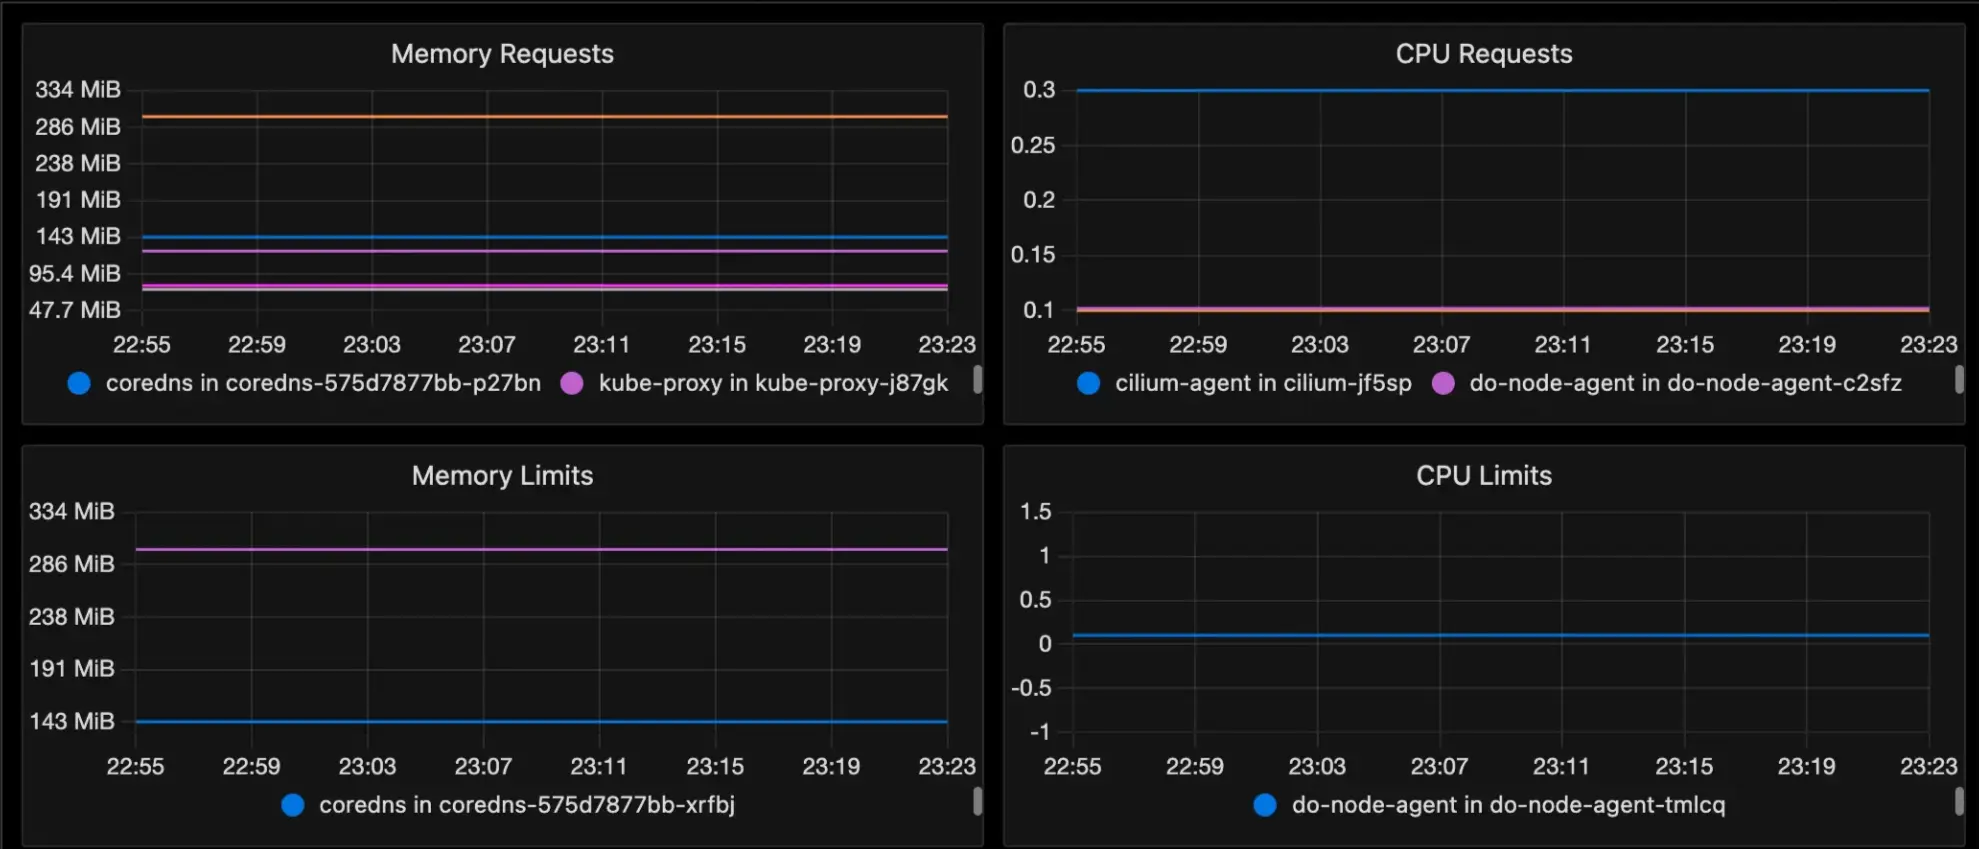
- You can create custom dashboards to monitor important metrics in your Kubernetes cluster.
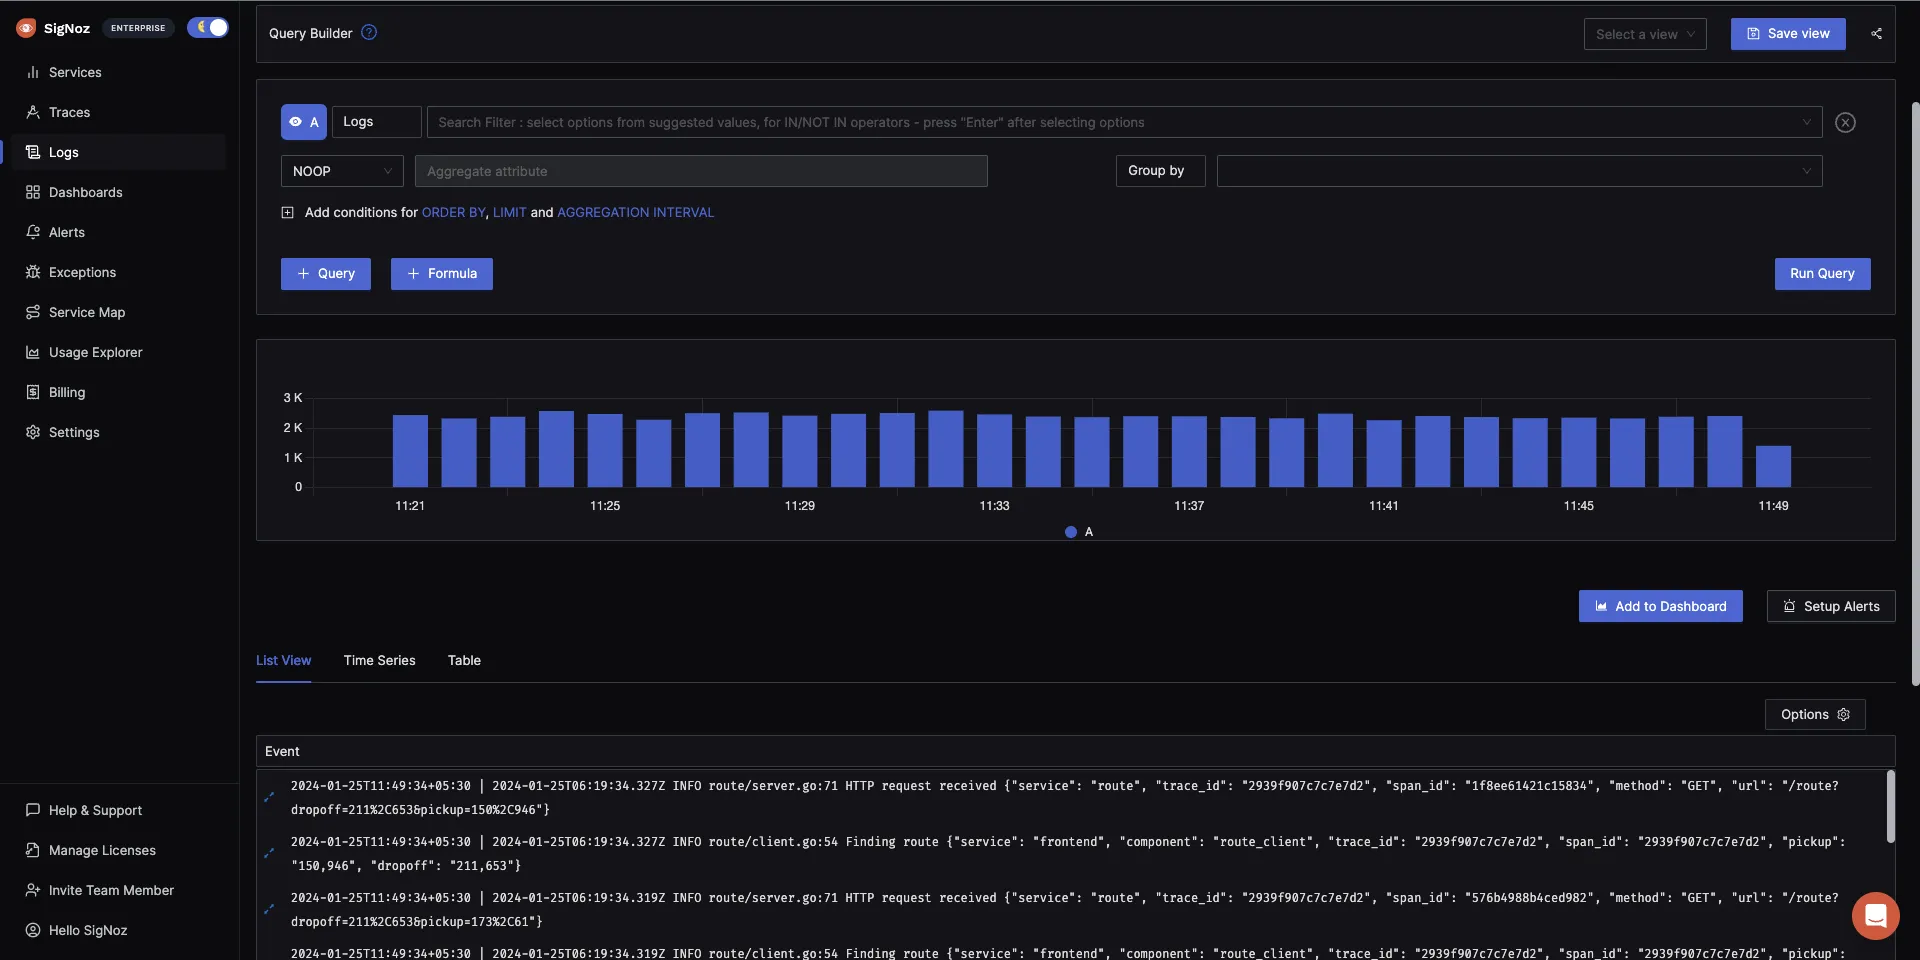
- You can visualize your cluster logs efficiently as it provides log management with advanced features like log query builder, search across multiple fields, structured table view, JSON view, etc.
If you are interested in trying out SigNoz, we have created detailed guides to get you started on monitoring your Kubernetes clusters.
Conclusion
Effective Kubernetes monitoring is essential for the smooth operation and optimal performance of Kubernetes environments. By implementing robust monitoring solutions, organizations can gain valuable insights into their clusters, proactively identify issues, and ensure the continuous health of their infrastructure.
If you are struggling to find the right monitoring tool for your Kubernetes cluster, a good option to consider is SigNoz.
Getting started with SigNoz
SigNoz Cloud is the easiest way to run SigNoz. Sign up for a free account and get 30 days of unlimited access to all features.

You can also install and self-host SigNoz yourself since it is open-source. With 24,000+ GitHub stars, open-source SigNoz is loved by developers. Find the instructions to self-host SigNoz.
Related Posts
