LangChain Observability: How to Monitor LLM Apps with OpenTelemetry (With Demo App)
LangChain has become one of the most popular frameworks for building LLM-powered applications, making it easier to create agents that can reason, plan, and take actions. But like any production-grade AI app, LangChain agents can run into performance bottlenecks, hallucinations, or tool call failures. And without proper LangChain observability, it’s hard to know where things break down.
In this practical guide, we will walk you through setting up observability for your Langchain application with OpenTelemetry, the open-source standard for generating telemetry data. We'll instrument a demo trip planner agent and show you how to visualize traces, token usage, and tool performance in SigNoz.
The trip planner agent helps users plan their travel itinerary by combining LLM reasoning with external services like flight ticket search, weather APIs, hotel booking engines, and nearby activity recommendations. By instrumenting it with OpenTelemetry, you can trace every step of the planning process, measure latency at each stage, and quickly debug issues that impact the user experience.
Why LangChain Observability Matters
LangChain agents are essentially reasoning loops: the LLM takes user input, decides which tools to call, processes their results, and iterates until it arrives at an answer. In a trip planner agent app, this might look like:
- Calling a flights API to check availability.
- Fetching hotel recommendations from a booking API.
- Looking up weather forecasts to suggest the best travel window.
- Stitching everything together into a coherent itinerary.
This chain of reasoning is amazing when it works but if one tool call fails, takes too long, or returns garbage, the whole experience collapses. Without observability, you won’t know whether the problem was:
- A slow external API call.
- An LLM misunderstanding the tool response.
- The reasoning loop going in circles.
Instrumentation with OpenTelemetry makes all of this visible from under the hood.
How OpenTelemetry and SigNoz can help
What is OpenTelemetry?
OpenTelemetry (OTel) is an open-source observability framework that provides a unified way to collect telemetry data—traces, metrics, and logs—from across your application stack. It’s a CNCF project with support for multiple programming languages and a wide range of integrations. The beauty of OTel is that you instrument your code once, and you can send that data to any observability backend you choose without vendor lock-in.
For LangChain-based agents, this means you can capture detailed performance and error data for each stage of the reasoning process: LLM calls, tool invocations (like flights, hotels, weather, and activity search), and the orchestration logic that stitches them together. Instead of treating your agent as a black box, you get fine-grained visibility into exactly how requests flow through your system.
What is SigNoz?
SigNoz is an all-in-one observability platform built on top of OpenTelemetry. It provides a rich UI to visualize traces, monitor performance metrics, and set alerts all in real time. With SigNoz, you can drill into slow external API calls, trace a single trip planning request end-to-end, or quickly identify where your LangChain agent might be looping or failing.
By pairing OpenTelemetry’s standardized data collection with SigNoz’s powerful analysis tools, you get a complete observability stack tailored for modern, distributed, and AI-driven applications.
To demonstrate how OpenTelemetry and SigNoz work together in practice, we’ll walk through a demo trip planner agent built on LangChain. The agent uses flight search, hotel booking, weather APIs, and nearby activity lookup to craft travel itineraries, and with observability enabled, you can see every step of the process in action.
Building the Example App: A LangChain Trip Planner Agent
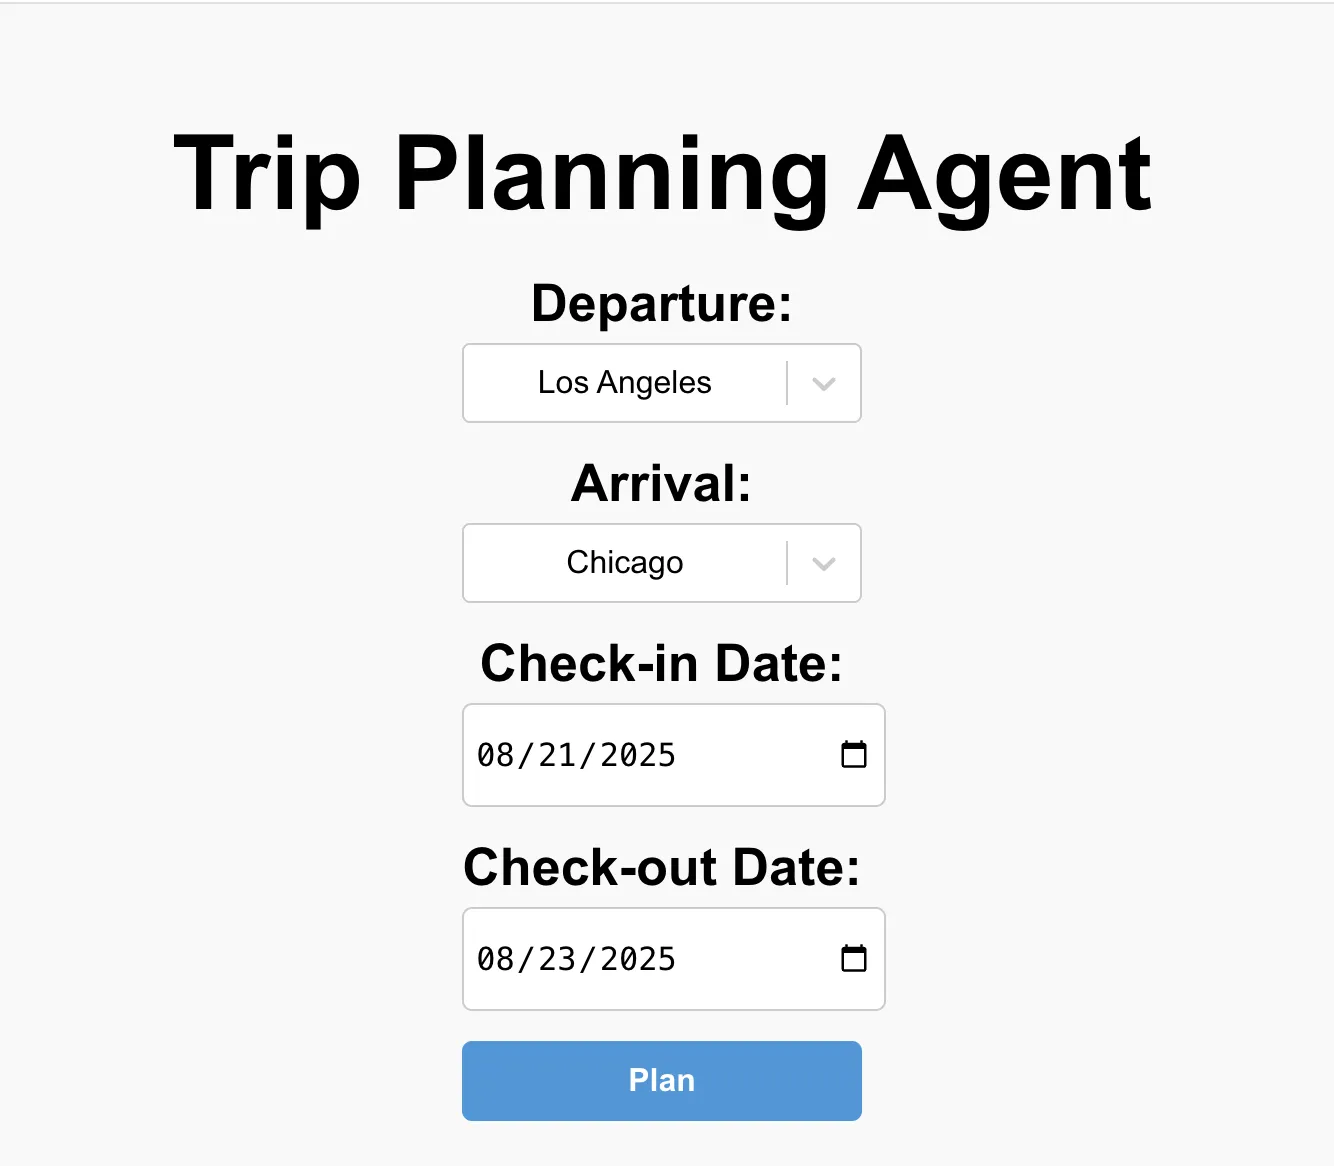
To make this guide more concrete, we’ve built a trip planner agent powered by LangChain, OpenTelemetry, and SigNoz. The idea is simple: the user specifies a start location, destination, and check-in/check-out dates, and the agent generates a personalized travel itinerary.
The itinerary includes:
- Flight details for departure and return.
- Hotel booking options covering the entire stay.
- Weather forecasts for the chosen dates.
- Nearby activities to explore at the destination.
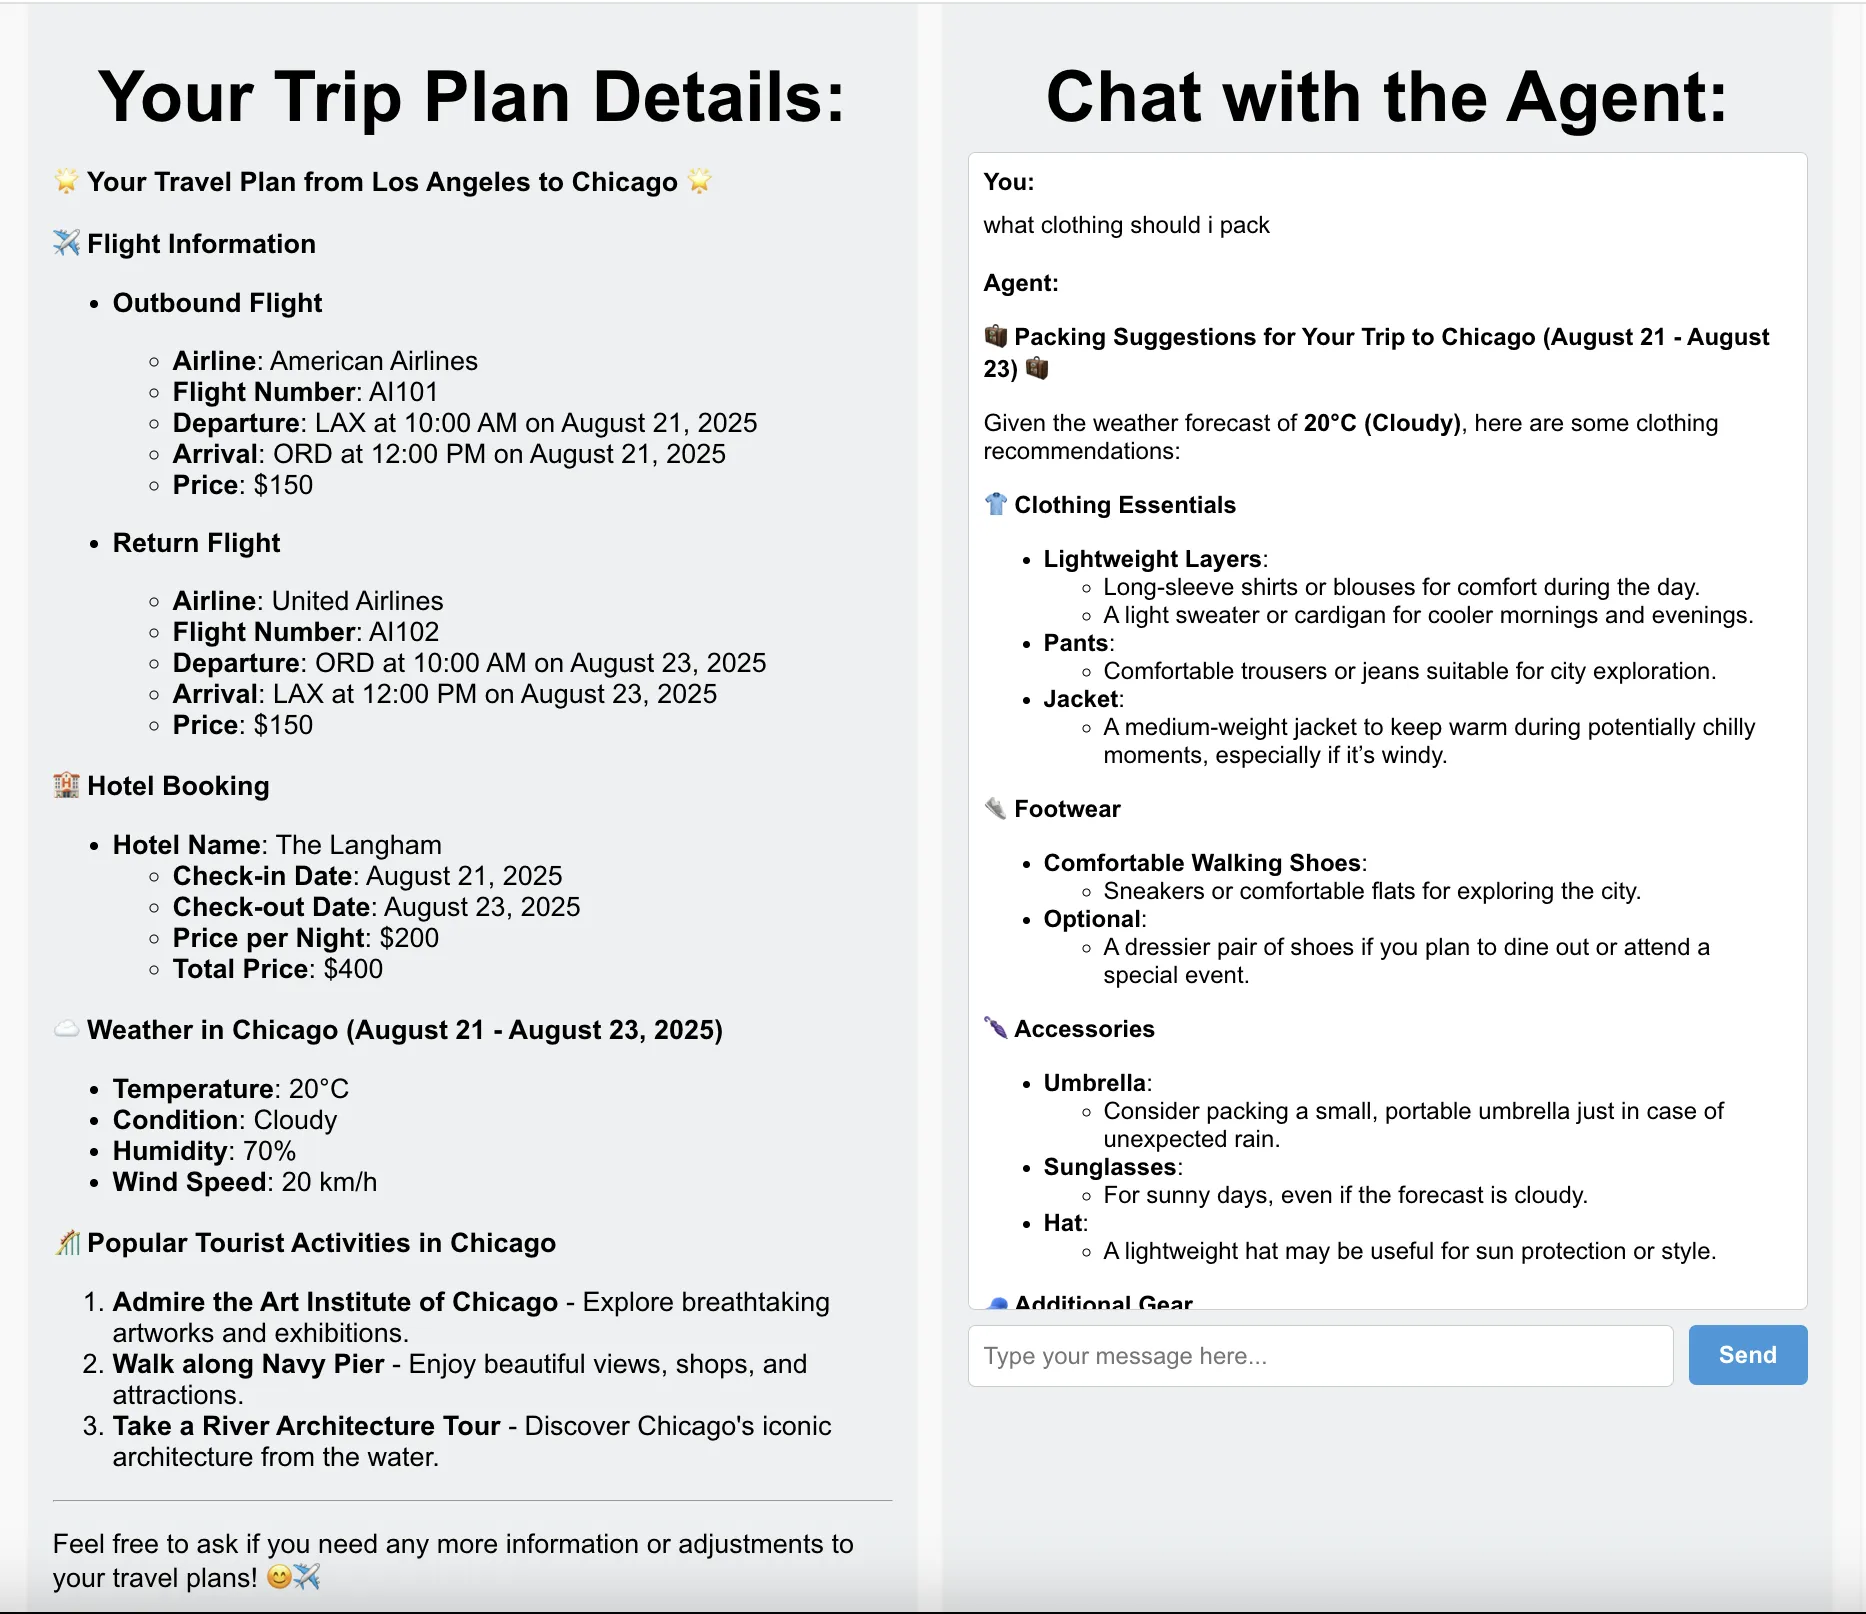
Under the hood, the app uses LangChain’s agent framework to orchestrate multiple tool calls: one for flight tickets, one for hotels, one for weather, and one for activities. The LLM reasons over the responses from these tools and stitches them together into a coherent itinerary.
With OpenTelemetry instrumentation baked in, every tool invocation and LLM call is traced and sent to SigNoz, providing a complete picture of the app’s performance and behavior: whether a flight API is slow, a hotel lookup fails, or the agent loops unnecessarily.
To make it more interactive, the trip planner also includes a chatbot feature. Users can ask follow-up questions like “Can you find vegetarian-friendly restaurants near my hotel?” or “What’s the best day trip outside the city?” These conversations are also traced, helping developers see how the agent performs during exploratory dialogue.
Try the Trip Planner Agent Yourself
Want to explore the LangChain Trip Planner in action? Clone the repo, install dependencies, and follow the setup steps in the README to start sending traces from your local app to SigNoz.
git clone https://github.com/SigNoz/langchain-monitoring-demo.git
After cloning the repo, you can run the agent locally and start exploring and creatign travel plans. The README provides step‑by‑step guidance for setting up the demo. If you’d rather instrument your own LangChain app, continue to the next section for detailed instructions on integrating OpenTelemetry and SigNoz.
Instrument your LangChain application
Prerequisites
- A Python application using Python 3.8+
- LangChain integrated into your app
- Basic understanding of AI Agents and tool calling workflow
- A SigNoz Cloud account with an active ingestion key
pipinstalled for managing Python packages- Internet access to send telemetry data to SigNoz Cloud
- (Optional but recommended) A Python virtual environment to isolate dependencies
To capture detailed telemetry from LangChain without modifying your core application logic, we will use OpenInference, a community-driven standard designed to make observability in AI applications easier. It provides pre-built instrumentation for popular frameworks like LangChain, and it’s built on top of the trusted OpenTelemetry ecosystem. This allows you to trace your LangChain application with minimal configuration.
Check out detailed instructions on how to set up OpenInference instrumentation for LangChain.
Step 1: Install OpenInference and OpenTelemetry related packages
pip install openinference-instrumentation-langchain \
opentelemetry-exporter-otlp \
opentelemetry-sdk
Step 2: Import the necessary modules in your Python application
from opentelemetry.sdk.trace import TracerProvider
from opentelemetry.sdk.trace.export import BatchSpanProcessor
from opentelemetry.sdk.resources import Resource
from opentelemetry.exporter.otlp.proto.http.trace_exporter import OTLPSpanExporter
from openinference.instrumentation.langchain import LangChainInstrumentor
Step 3: Set up the OpenTelemetry Tracer Provider to send traces directly to SigNoz Cloud
resource = Resource.create({"service.name": "<service_name>"})
provider = TracerProvider(resource=resource)
span_exporter = OTLPSpanExporter(
    endpoint="https://ingest.<region>.signoz.cloud:443/v1/traces",
    headers={"signoz-ingestion-key": "<your-ingestion-key>"},
)
provider.add_span_processor(BatchSpanProcessor(span_exporter))
<service_name>is the name of your service- Set the
<region>to match your SigNoz Cloud region - Replace
<your-ingestion-key>with your SigNoz ingestion key
Step 4: Instrument LangChain using OpenInference
Use the LangChainInstrumentor from OpenInference to automatically trace LangChain operations with your OpenTelemetry setup:
LangChainInstrumentor().instrument()
📌 Important: Place this code at the start of your application logic — before any LangChain functions are called or used — to ensure telemetry is correctly captured.
Your LangChain commands should now automatically emit traces, spans, and attributes.
Finally, you should be able to view this data in Signoz Cloud under the traces tab:

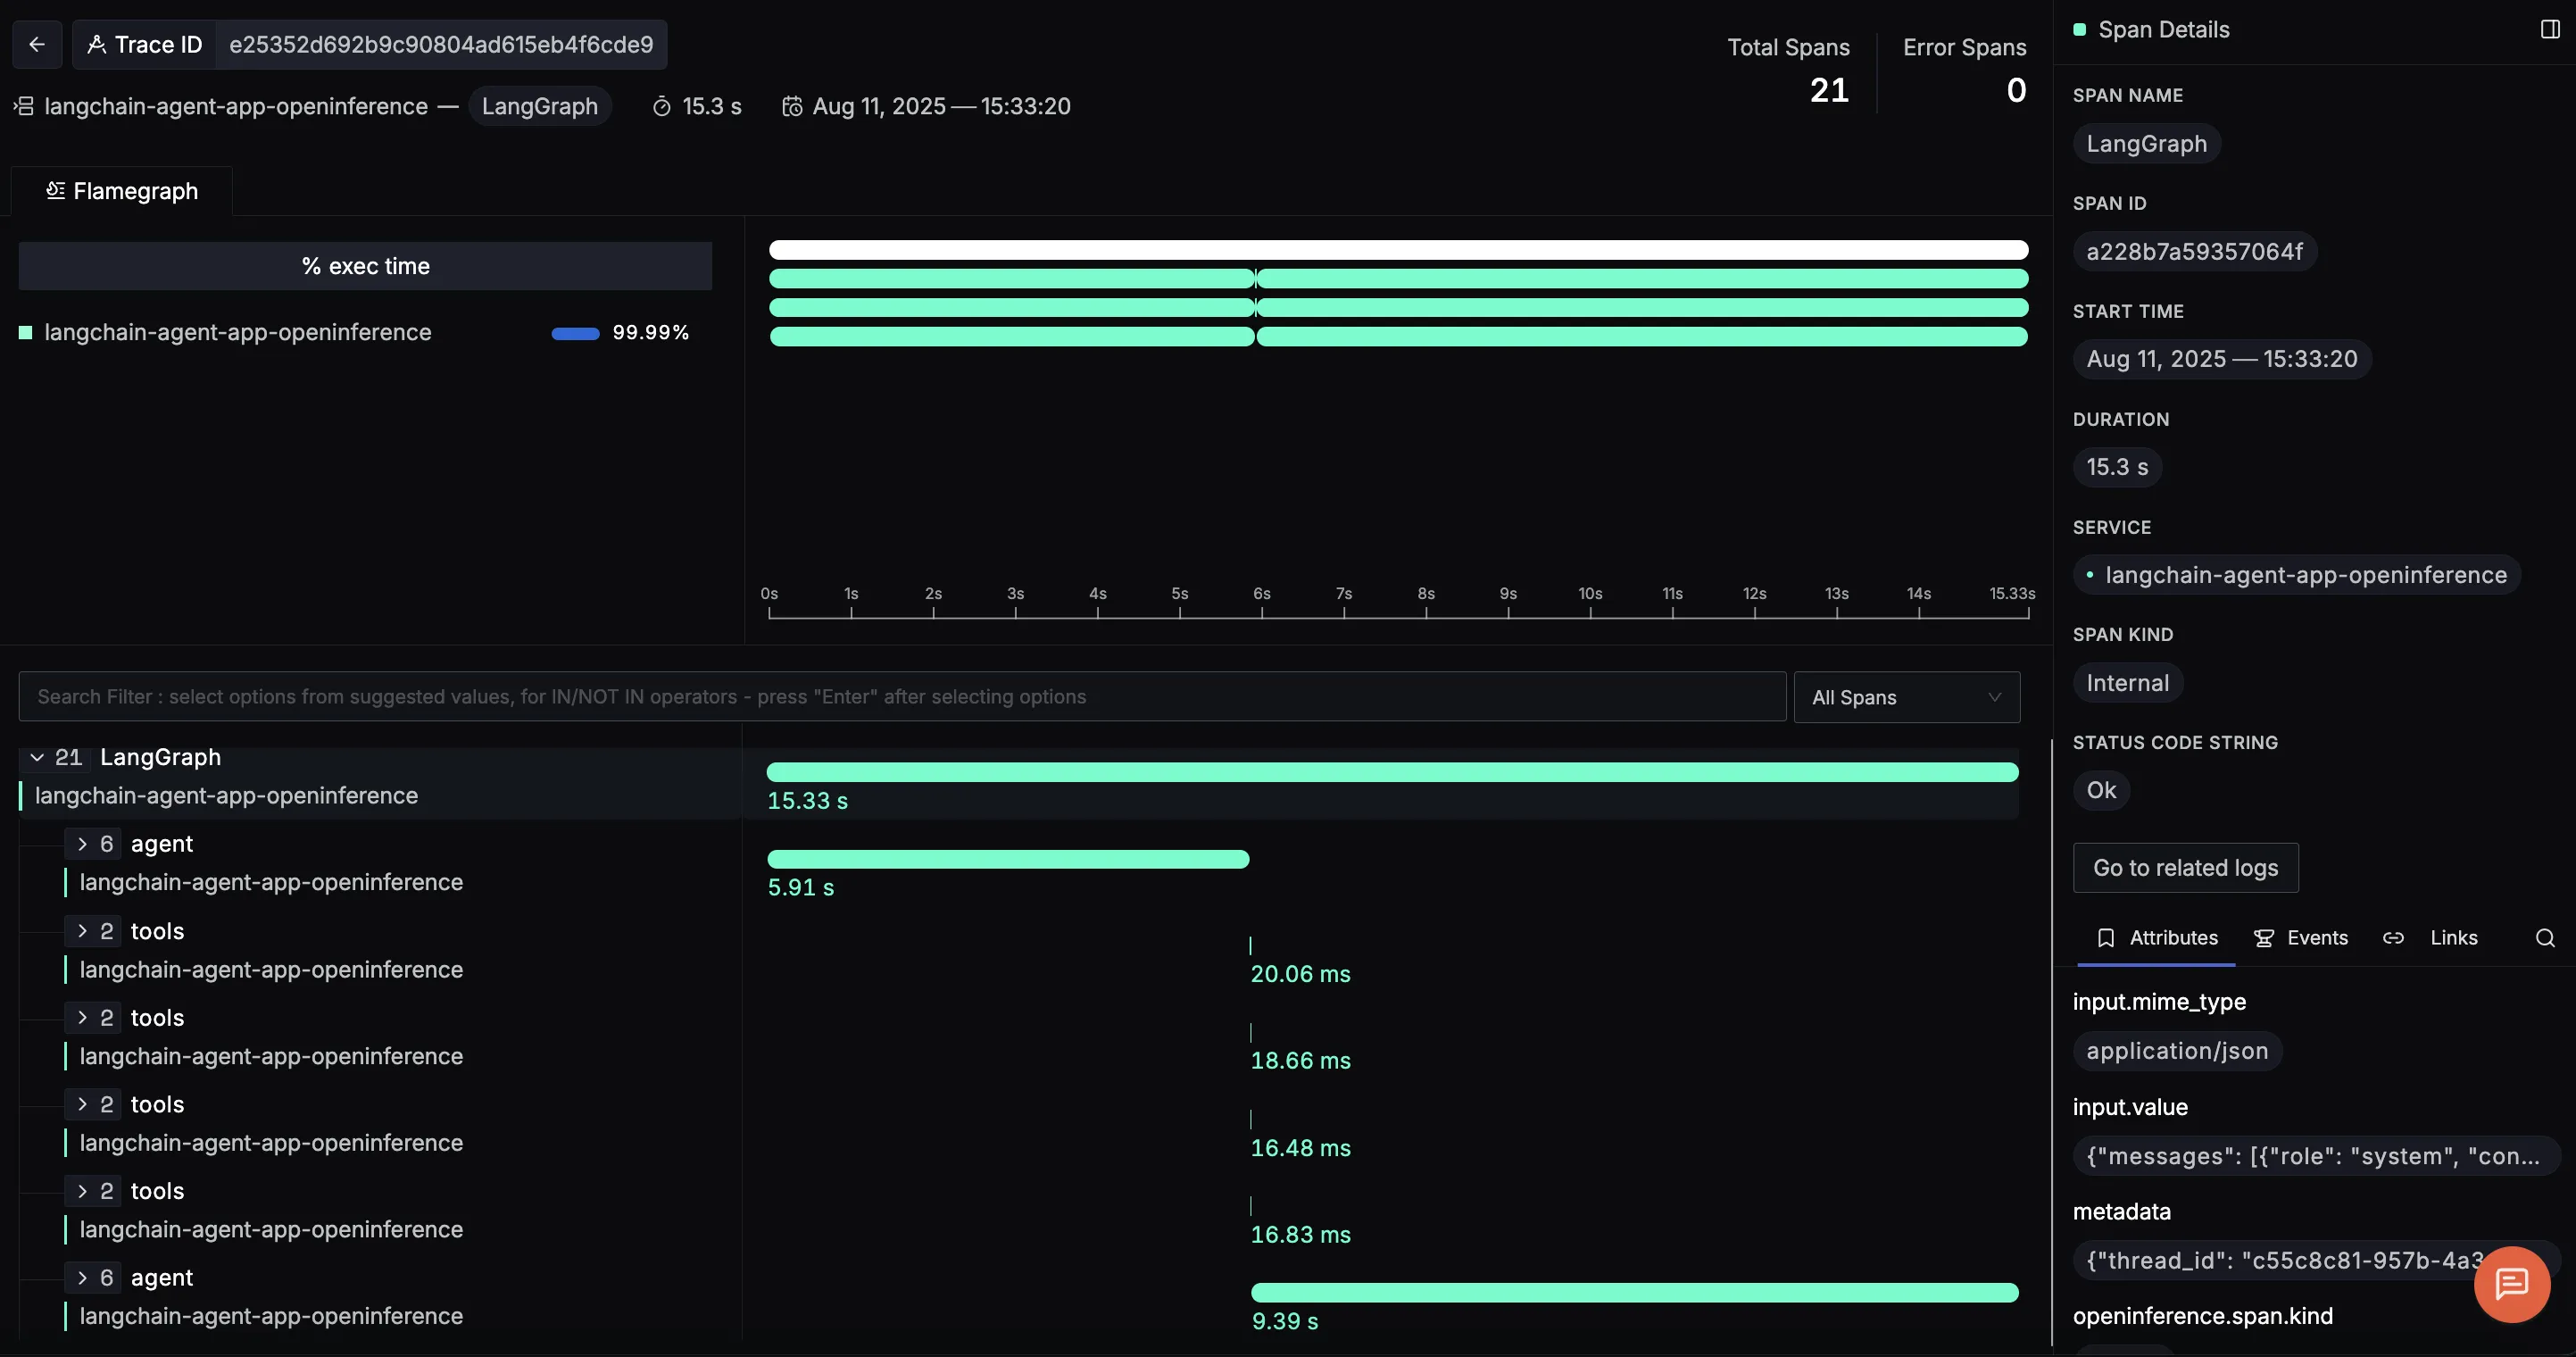
When you click on a trace ID in SigNoz, you'll see a detailed view of the trace, including all associated spans, along with their events and attributes:
Making Sense of Your Telemetry Data
Once telemetry is enabled in our LangChain trip planner agent, we start seeing detailed traces for each major step in the reasoning workflow. With LangGraph integration, these traces are neatly structured, showing how the agent loop orchestrates model calls and tool invocations. Here are three example spans you’ll encounter:
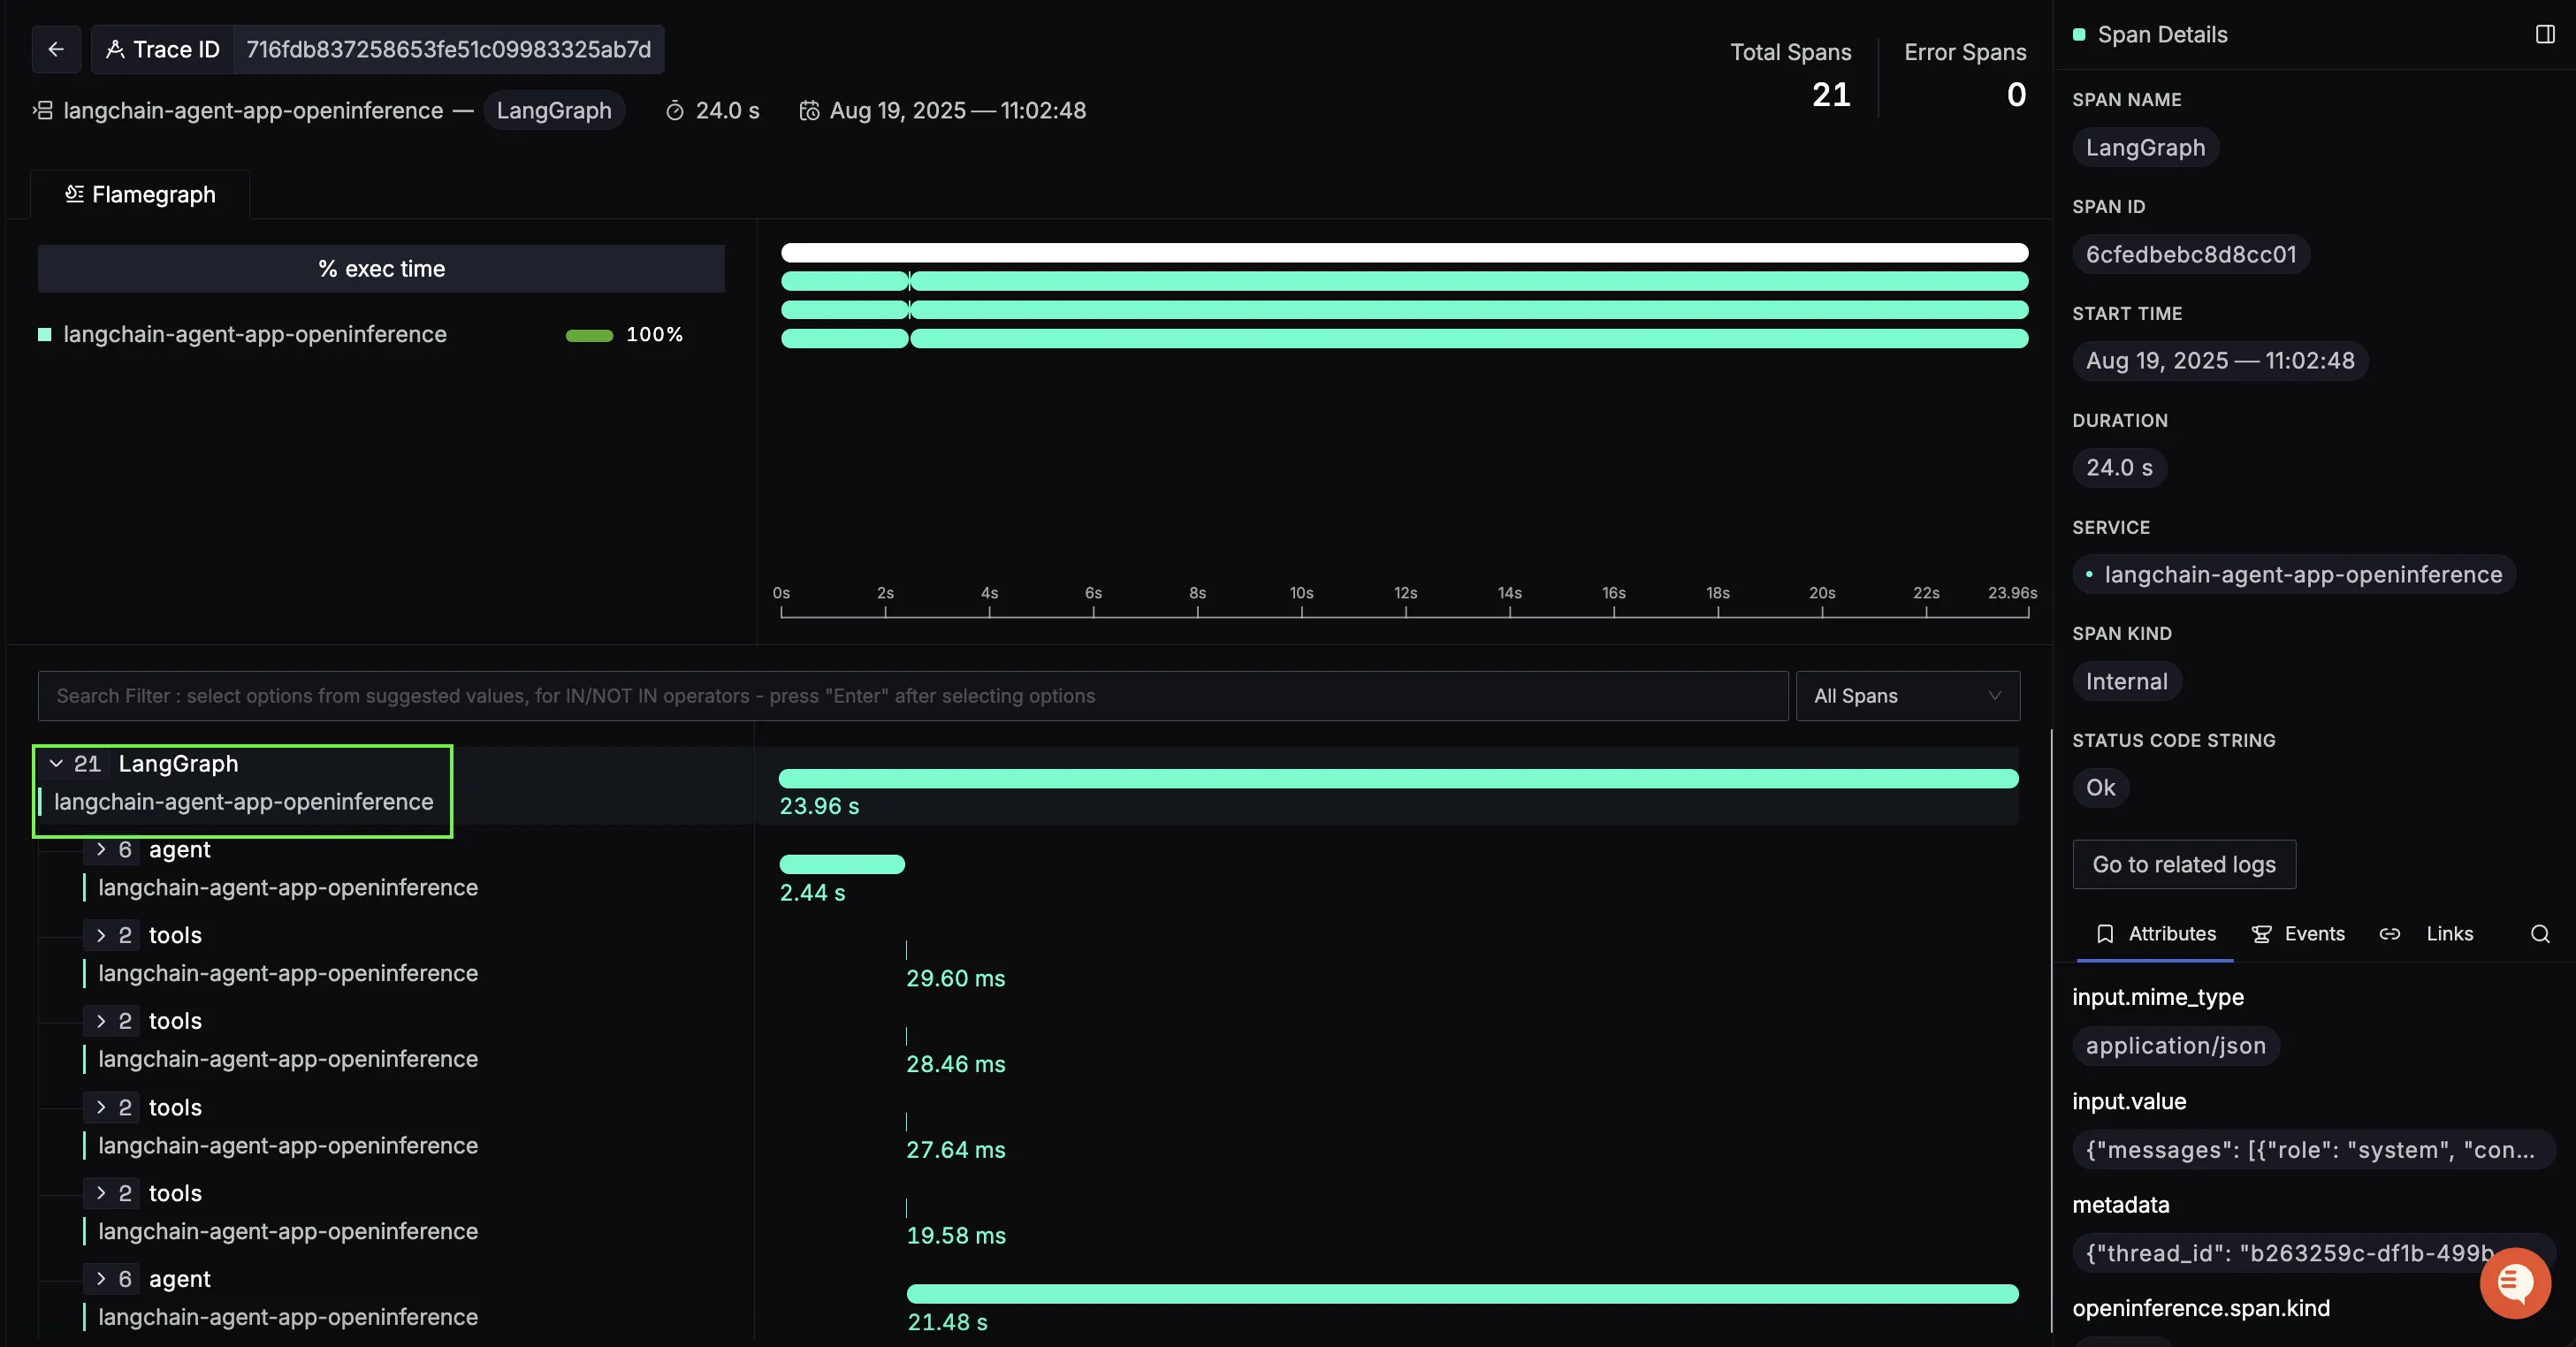
LangGraph (root span)
The overarching span represents the full request lifecycle of the trip planner agent. From the moment a user asks for a travel itinerary, every downstream operation: LLM reasoning, tool calls, and response generation is captured inside this parent span.
This view makes it clear how long the entire request took. On the right panel, you can explore input values like the initial user query, making it easy to trace back how the request was interpreted at the start.
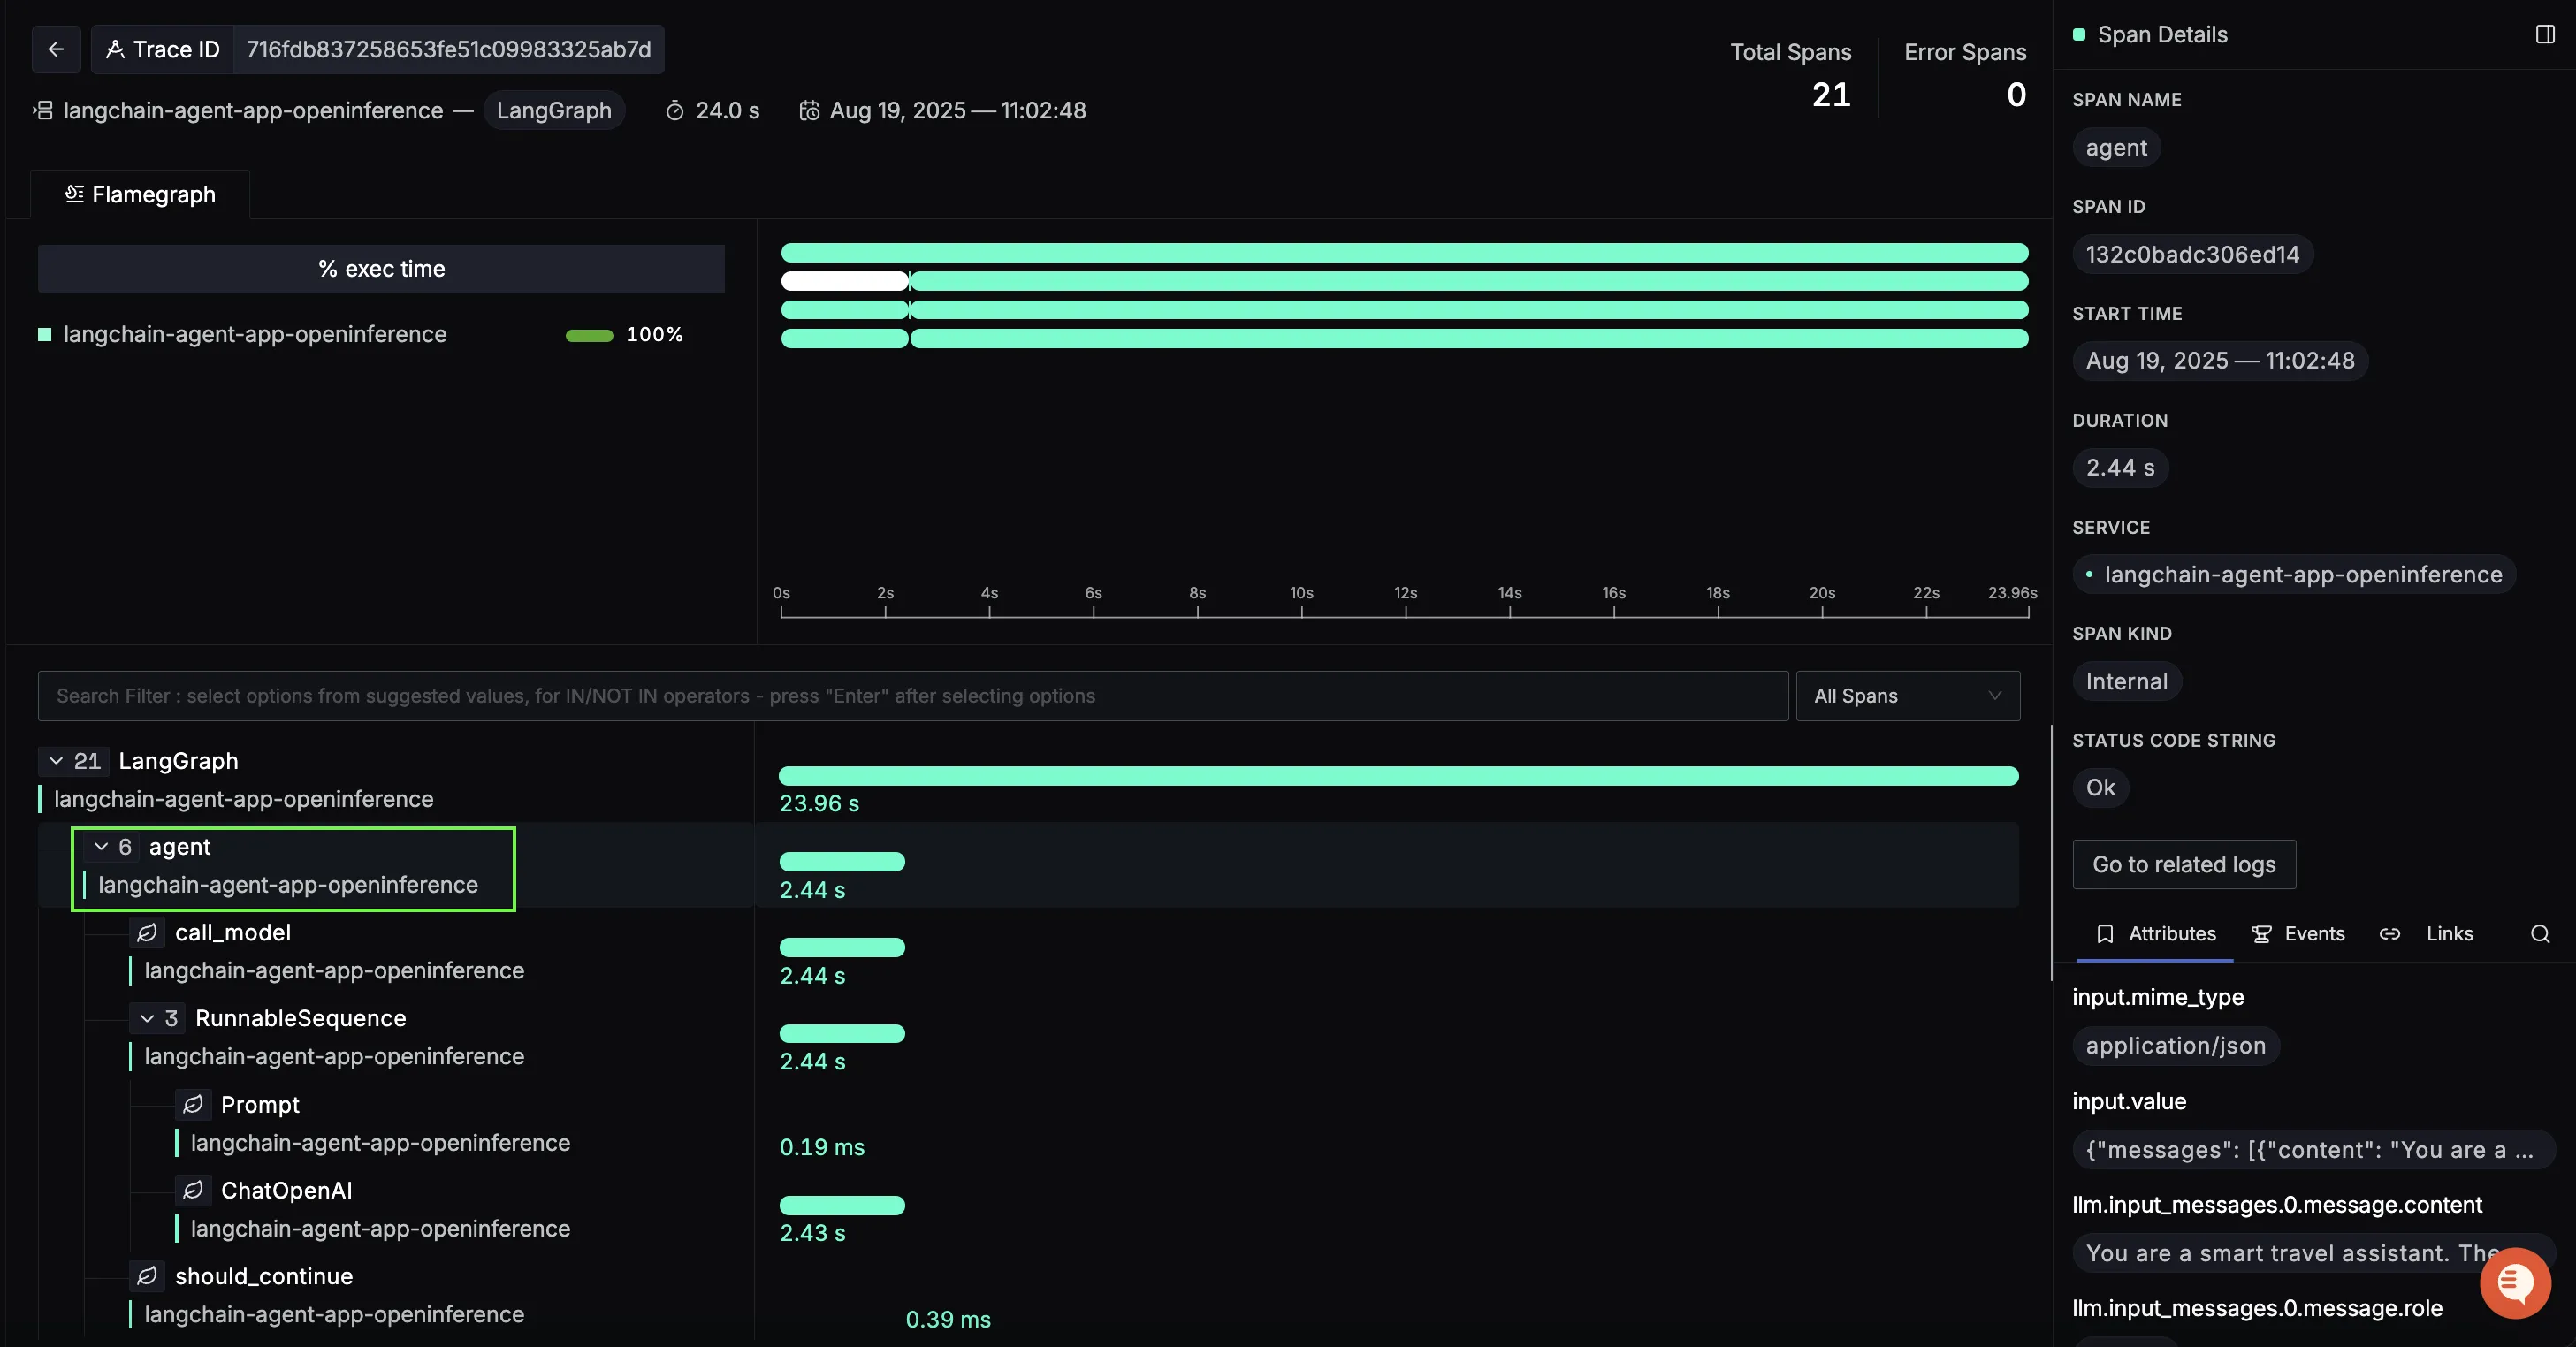
Agent span
Nested inside the LangGraph span is the agent span, which captures the LLM’s reasoning steps. This includes the decision-making process: when to call a tool, how to interpret the results, and whether the loop should continue or terminate.
Here, you can see the call_model → RunnableSequence → ChatOpenAI flow. Each step shows its latency, and the trace reveals exactly which prompts and tool inputs the agent generated. This makes it much easier to debug cases where the model loops too long or misuses a tool.
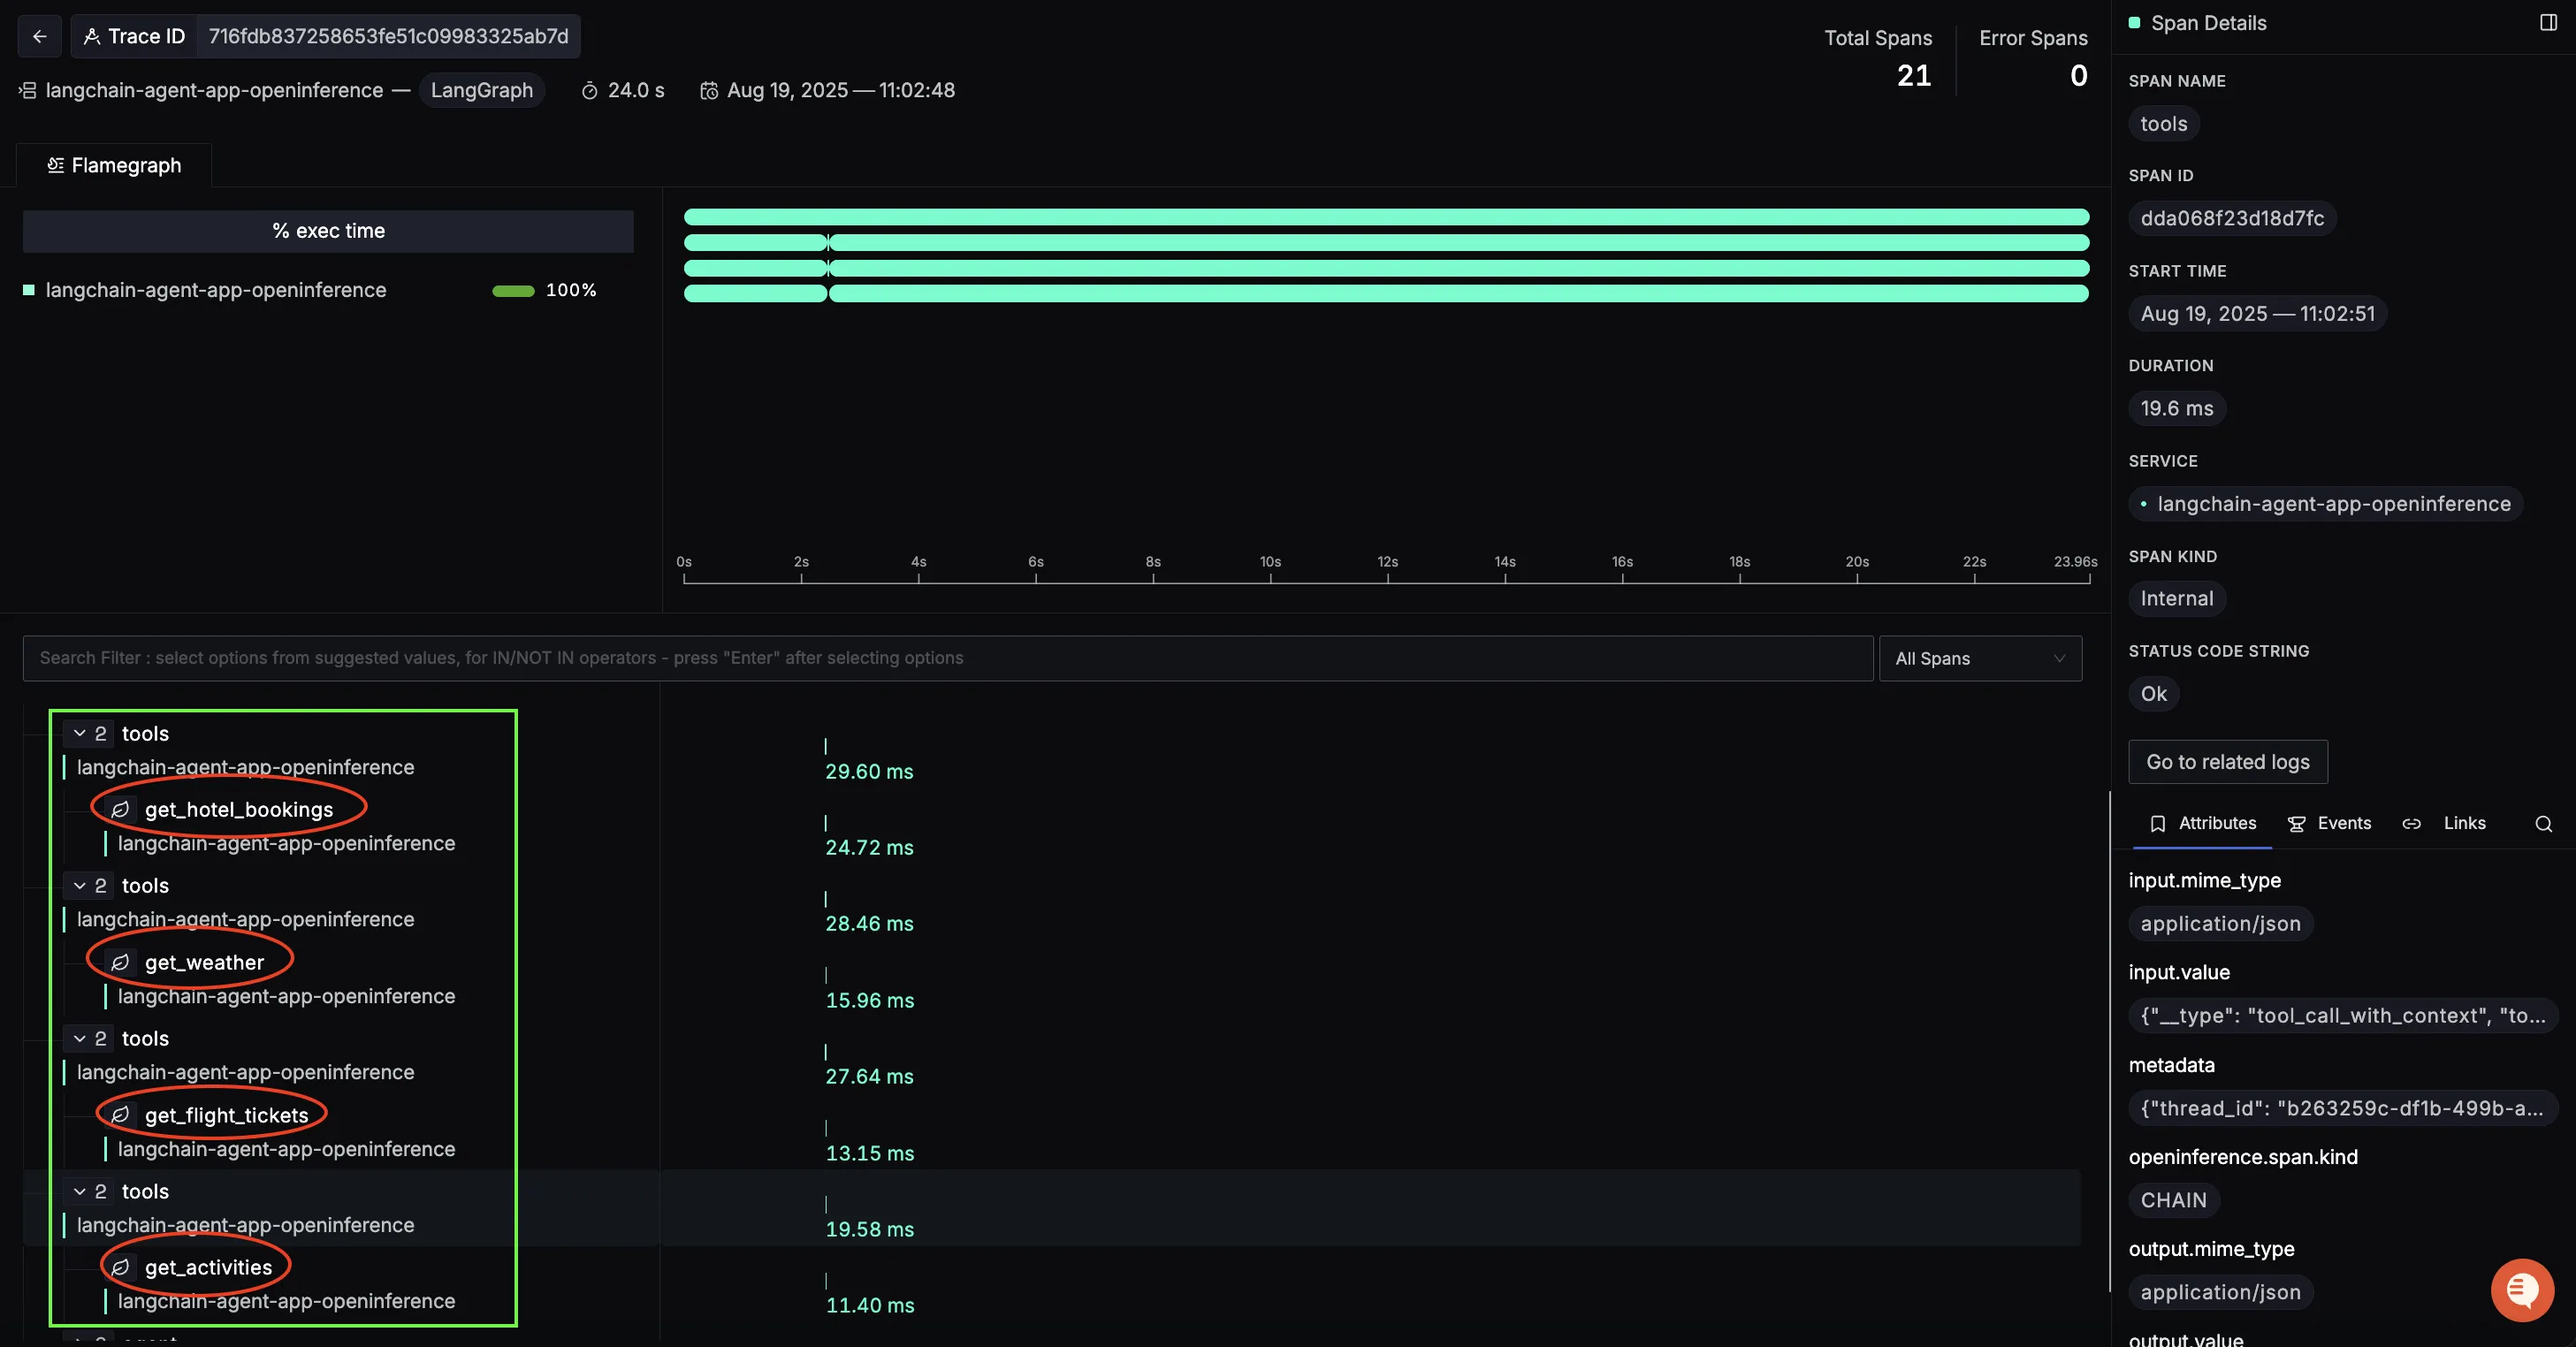
Tool call spans
Next, you’ll see spans for each tool invocation: flights, hotels, weather, and activities. These are especially valuable for diagnosing external API performance.
For example:
get_flight_tickets→ duration ~13msget_hotel_bookings→ duration ~25msget_weather→ duration ~16msget_activities→ duration ~11ms
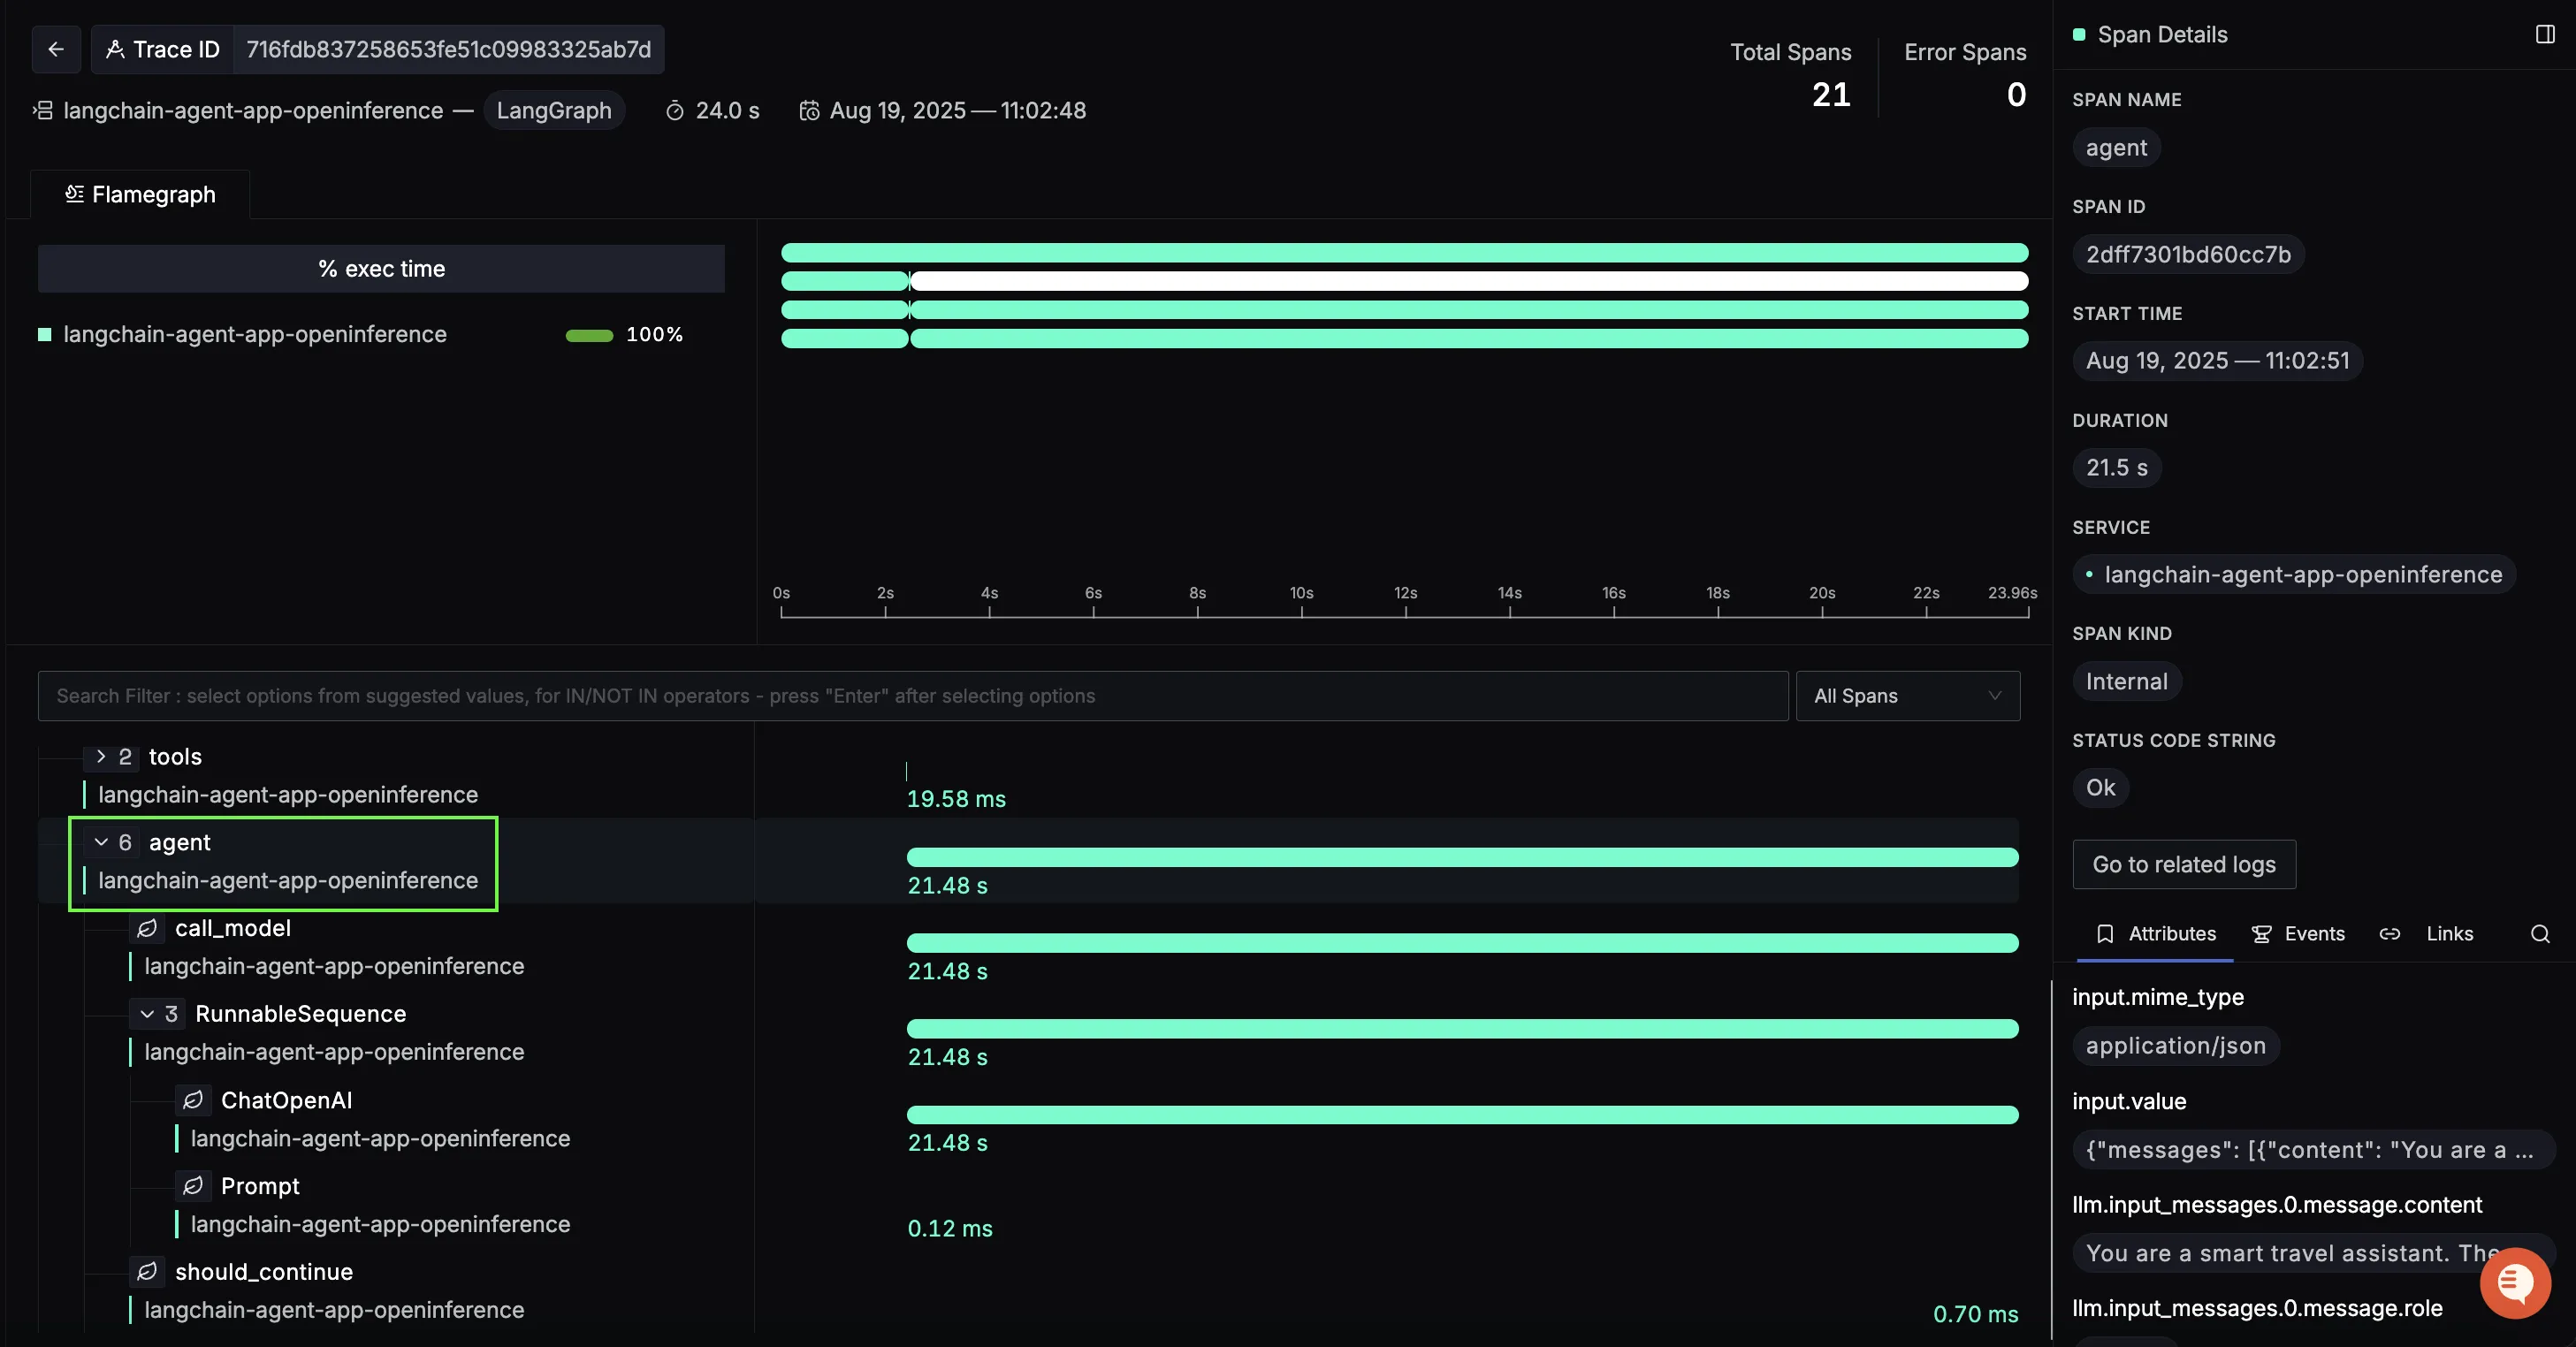
Closing Agent span
After the tool calls, the workflow enters a closing agent span, where the LLM takes all tool outputs (flights, hotels, weather, activities) and composes the final travel itinerary.
This is where the agent stitches together structured API responses into a user-friendly itinerary. By inspecting this span, you can:
- Review the exact prompt the LLM used to summarize tool outputs.
- Measure how much time the final response generation takes.
- Verify the final message content before it’s returned to the user.
With all this data, you can answer critical performance questions about your trip planner agent:
- Where is the time going? Is most of the latency in the agent’s reasoning, external API calls, or final response assembly?
- Which tools are slowest? For instance, if
get_hotel_bookingsconsistently takes longer, you might need caching or a faster API provider. - Is the agent reasoning efficiently? If the initial or closing agent spans dominate total latency, you may need to optimize prompts or reduce unnecessary loops.
Instead of guessing why an itinerary takes 20+ seconds to generate, SigNoz gives you a connected, end-to-end view of each request turning your LangChain workflow from a black box into a fully observable system.
Visualizing Data in SigNoz with Dashboards
Once your LangChain trip planner agent is instrumented with OpenTelemetry, SigNoz gives you teh ability to create rich dashboards to explore the emitted telemetry data. Built-in filters and span attributes make it easy to drill down into agent reasoning latency, tool performance, or model usage. This gives you a real-time pulse on how your application is performing end-to-end.
Here are some of the most insightful panels we built using the traces from our instrumented trip planner workflow:
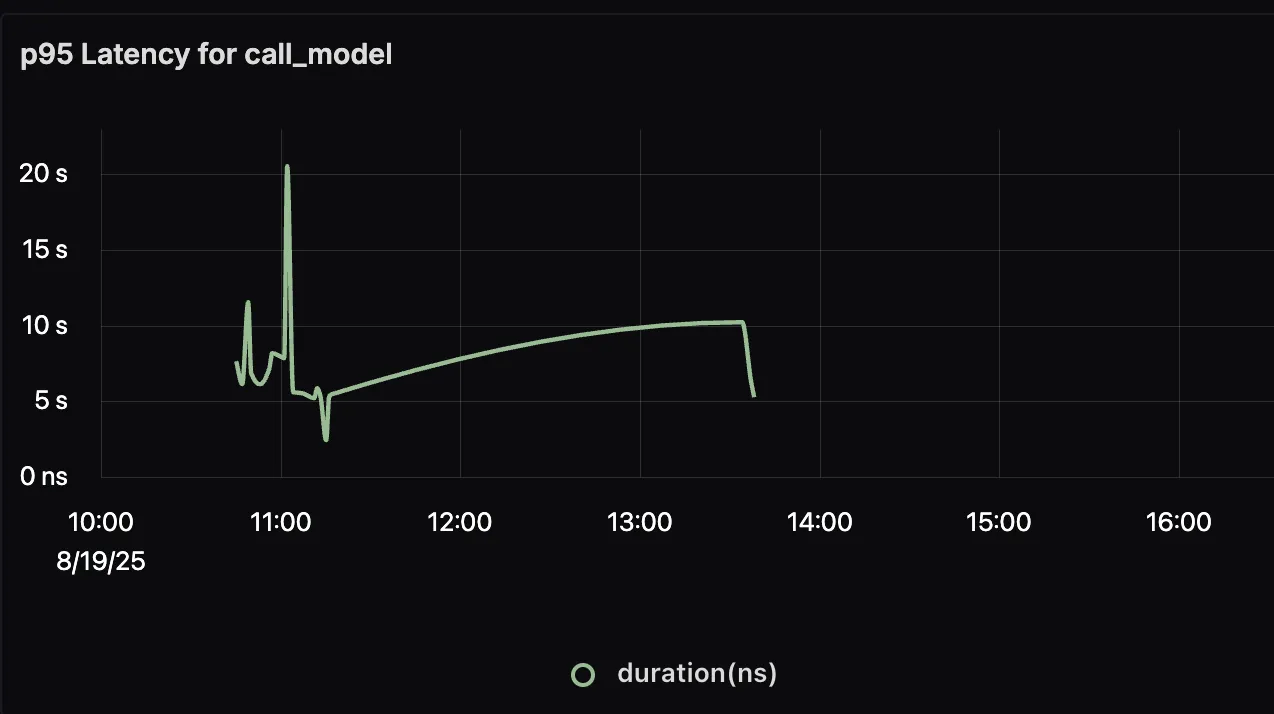
p95 Duration for Agent call_model
This panel shows the 95th percentile latency for the LLM calls made by the agent. Since LLM generation is often the longest-running step, tracking p95 duration helps you identify worst-case response times and tune prompts or model choices to improve user experience.
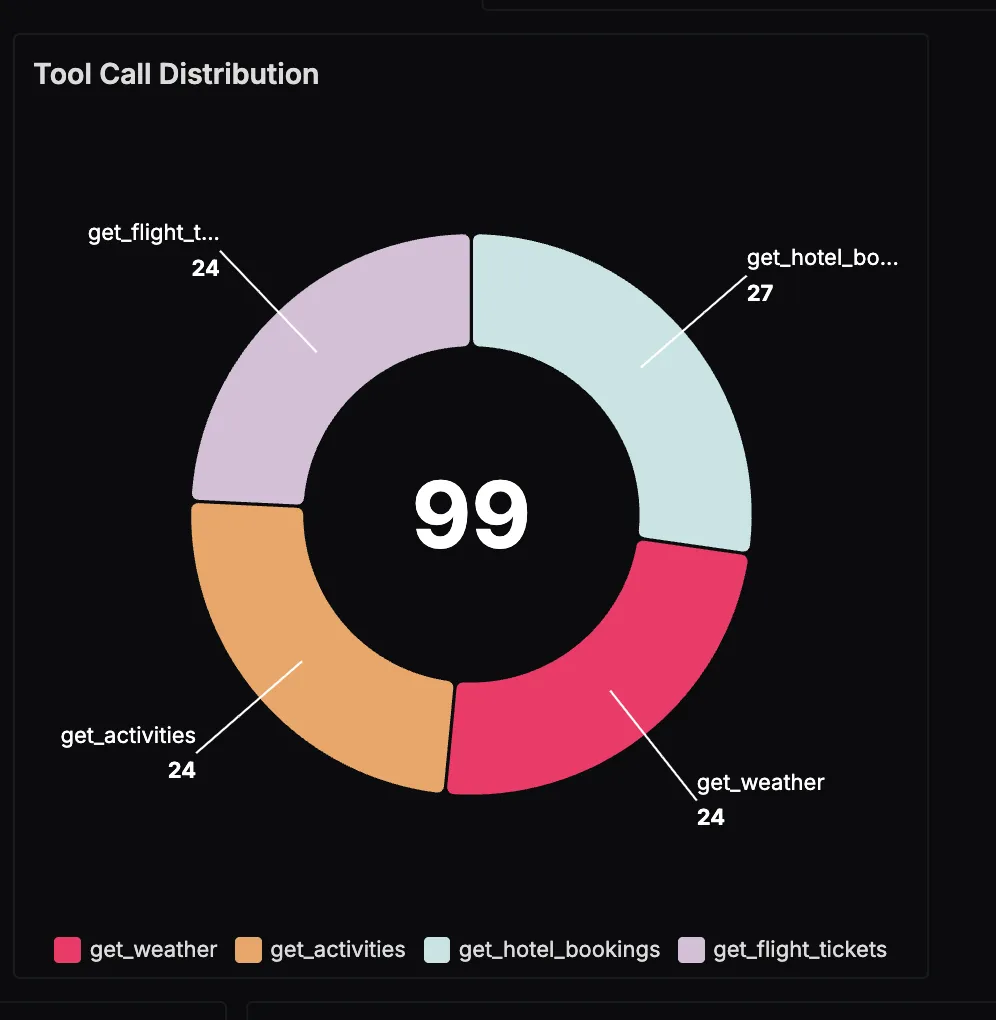
Tool Call Distribution
This panel visualizes how often different tools—flights, hotels, weather, and activities—are invoked across all trip planning sessions. It gives you a clear sense of workload distribution: for example, hotel searches may dominate requests while activity lookups are used less frequently. Understanding this helps with capacity planning and prioritizing optimizations.
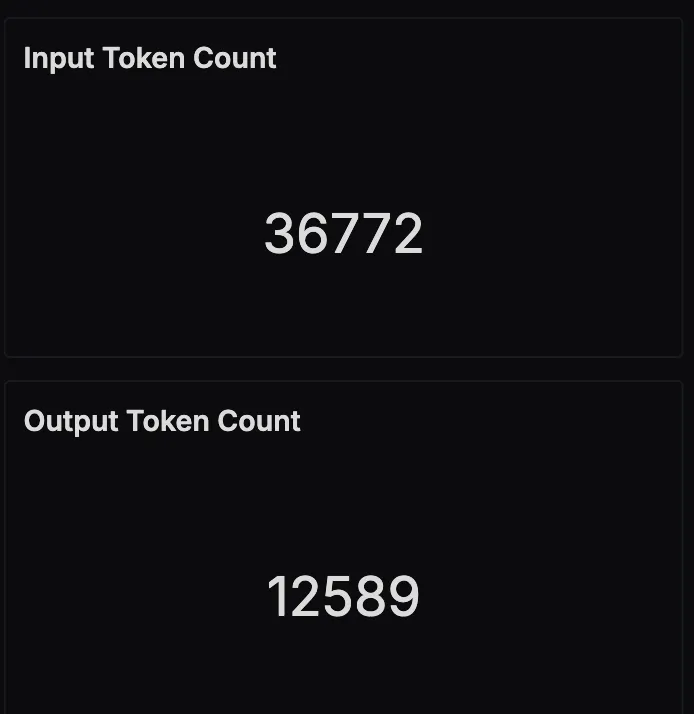
Input and Output Token Usage
This panel tracks the total number of input and output tokens processed by the LLM over time. Input tokens include the user query and tool outputs passed to the model, while output tokens are the generated itineraries or chatbot replies. Monitoring this helps you manage costs, optimize prompt length, and detect patterns in response verbosity.
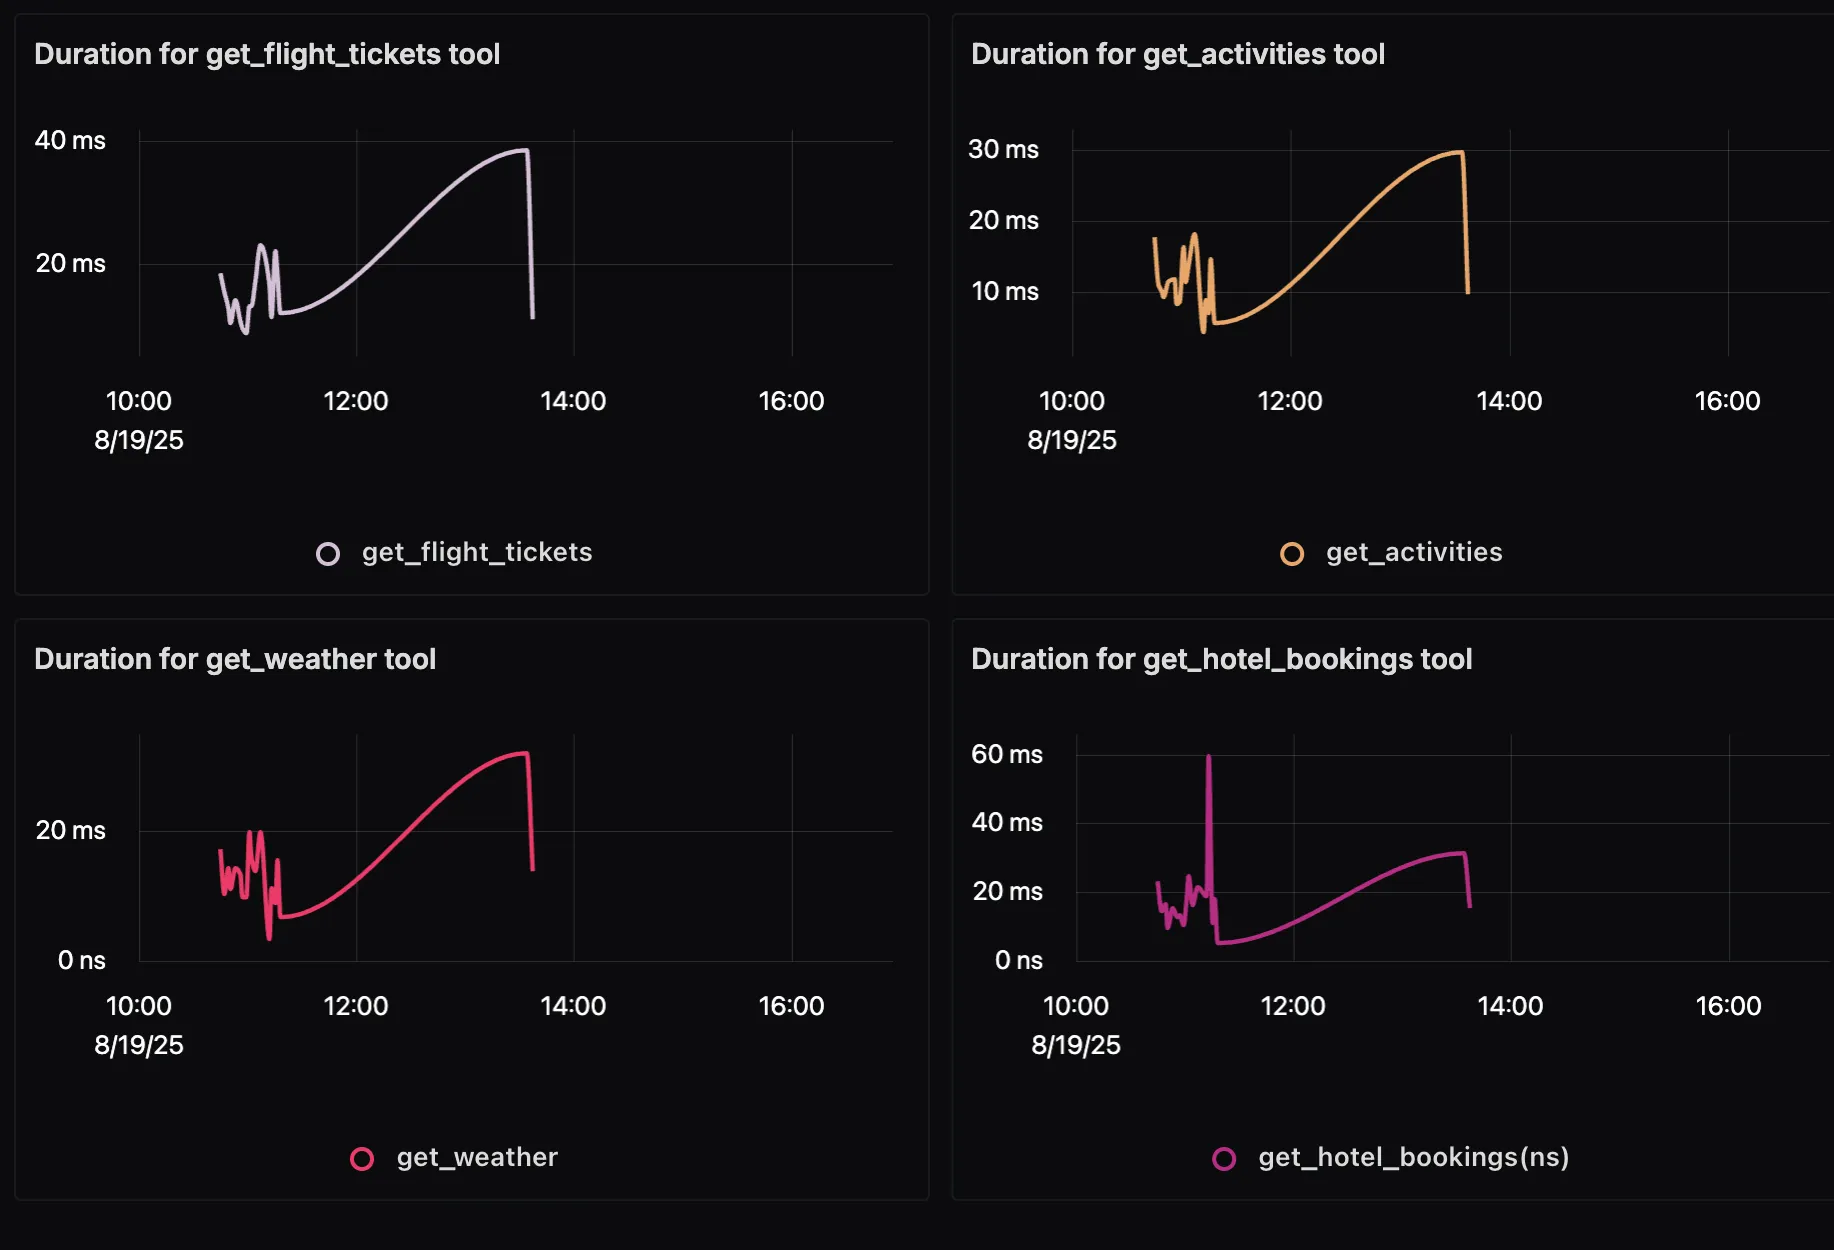
p95 Duration of Each Tool Call
This panel breaks down the latency of each tool: get_flight_tickets, get_hotel_bookings, get_weather, and get_activities. By tracking the 95th percentile duration, you can quickly spot which external API is the slowest under peak load and decide whether caching, retries, or provider changes are needed.
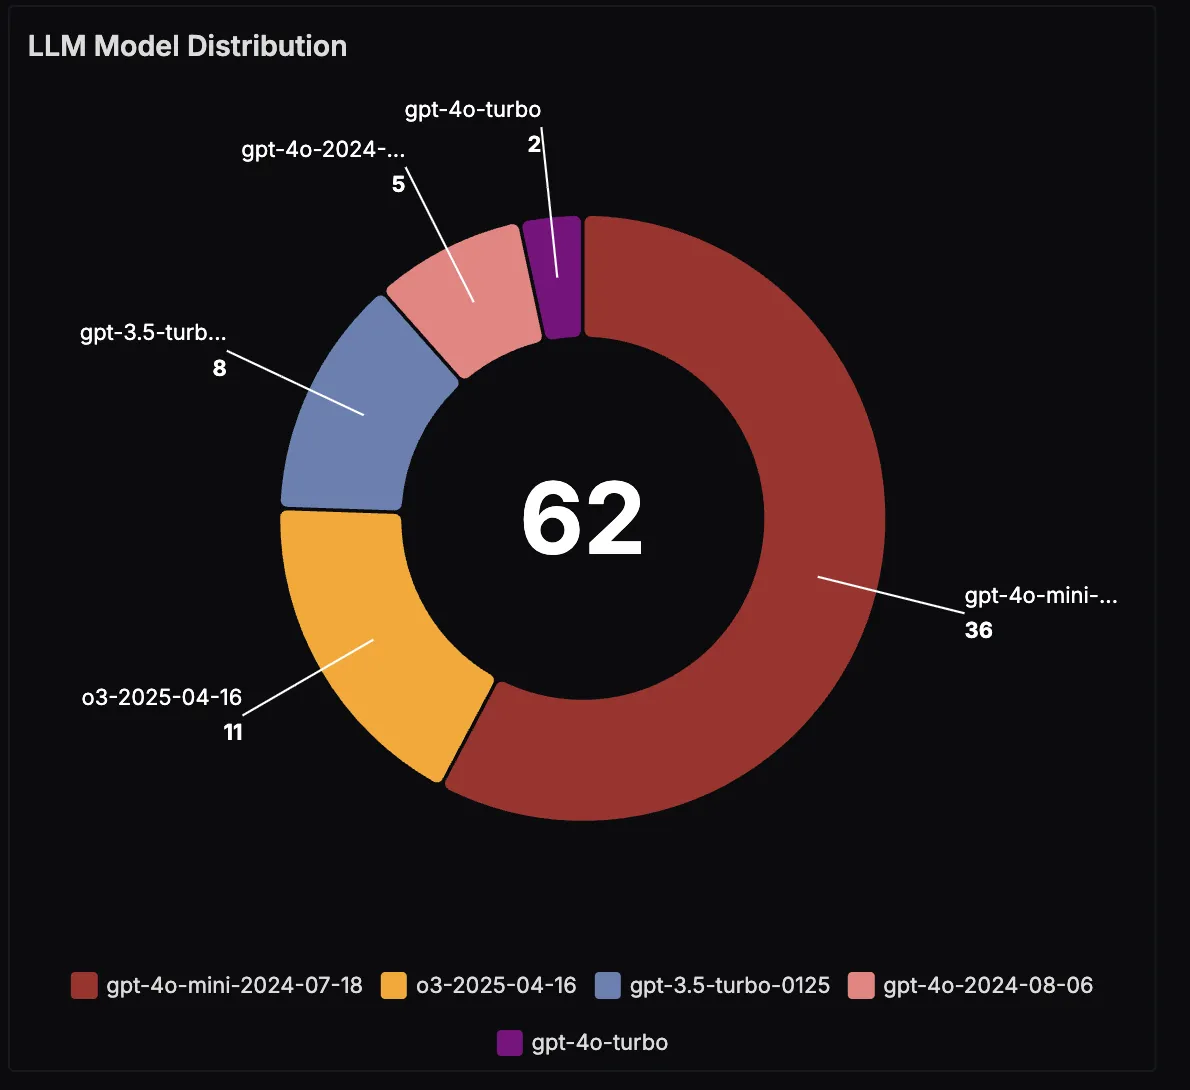
LLM Model Distribution
If your app is configured to use multiple LLMs, this panel shows the distribution of model usage. It’s useful for analyzing trade-offs between speed, quality, and cost. For example, you might run most queries on a smaller, cheaper model but switch to a larger model for complex multi-step itineraries.
With these dashboards in place, you can move beyond anecdotal debugging and gain data-driven insights into your LangChain agent. Whether it’s latency hotspots, tool reliability, or token usage trends, SigNoz provides the observability foundation you need to scale AI-driven trip planning with confidence.
Wrapping it Up
Building LangChain agents like a trip planner is exciting. There’s something magical about watching an AI plan your flights, hotels, activities, and even answer follow-up questions in natural language. But that magic only lasts if the app stays fast, reliable, and trustworthy. To make that happen, you need a clear view of what’s going on under the hood.
By pairing OpenTelemetry’s vendor-neutral instrumentation with SigNoz’s powerful observability platform, you can follow every step of your LangChain workflow from agent reasoning to tool calls, and final response generation. With this visibility, debugging becomes faster, performance tuning becomes data-driven, and your users get consistently great experiences.
In AI-powered apps, guesswork is the enemy. Observability is how you replace it with clarity, and that’s how you build LangChain systems you can trust.
If you want the docs version of this walkthrough, see the LangChain/LangGraph observability guide.
Coming Next: Using SigNoz to monitor a LangChain agent that queries SigNoz MCP
In the next part of this series, we’ll go deeper into observability by looking at a LangChain agent that integrates with an MCP (Model Context Protocol) server. This opens up richer interactions, but also more moving parts where observability becomes even more critical.
Full-Circle Observability: Using SigNoz to monitor a LangChain agent that queries SigNoz MCP
