How to Monitor MongoDB Metrics with OpenTelemetry
For high throughput systems that focus on gathering continuous data or have a heavy read-only traffic, NoSQL databases came as a blessing. NoSQL databases, due to their unstructured nature of data, allow relatively faster inserts as well as reads compared to relational databases. One such database that’s quite popular today is MongoDB. In this article, our focus would be to understand how to extract metrics out of MongoDB and ship them to Signoz using the Open Telemetry collector.
In this tutorial, we cover:
- A Brief Overview of MongoDB
- A Brief Overview of OpenTelemetry
- How does OpenTelemetry Collector collect data?
- Prerequisites
- Setting up SigNoz
- Setting up OpenTelemetry collector
- Monitoring with Signoz Dashboard
- Reference: MongoDB metrics and labels collected by OpenTelemetry Collector
- Conclusion
- Further Reading
If you want to jump straight into implementation, start with this prerequisites section.
A Brief Overview of MongoDB
First released in early 2009, MongoDB is one of the most popular NoSQL databases in use today. MongoDB practically made the concept of NoSQL more popular. As of today, MongoDB is available as a community edition database and a licensed database for use similar to MySQL and PostgreSQL in the relational database world.
MongoDB is known for its high throughput for the insertion of records and, hence, is generally utilized for systems that have high insertions or reads expected primarily for unstructured data. This nature of usage makes it necessary to monitor MongoDB to ensure that it performs at its best and is scaled as needed.
A Brief Overview of OpenTelemetry
OpenTelemetry is a set of APIs, SDKs, libraries, and integrations aiming to standardize the generation, collection, and management of telemetry data(logs, metrics, and traces). It is backed by the Cloud Native Computing Foundation and is the leading open-source project in the observability domain.
The data you collect with OpenTelemetry is vendor-agnostic and can be exported in many formats. Telemetry data has become critical in observing the state of distributed systems. With microservices and polyglot architectures, there was a need to have a global standard. OpenTelemetry aims to fill that space and is doing a great job at it thus far.
In this tutorial, you will use OpenTelemetry Collector to collect MongoDB metrics for performance monitoring.
What is OpenTelemetry Collector?
OpenTelemetry Collector is a stand-alone service provided by OpenTelemetry. It can be used as a telemetry-processing system with a lot of flexible configurations to collect and manage telemetry data.
It can understand different data formats and send it to different backends, making it a versatile tool for building observability solutions.
Read our complete guide on OpenTelemetry Collector
How does OpenTelemetry Collector collect data?
A receiver is how data gets into the OpenTelemetry Collector. Receivers are configured via YAML under the top-level receivers tag. There must be at least one enabled receiver for a configuration to be considered valid.
Here’s an example of an otlp receiver:
receivers:
  otlp:
    protocols:
      grpc:
      http:
An OTLP receiver can receive data via gRPC or HTTP using the OTLP format. There are advanced configurations that you can enable via the YAML file.
Here’s a sample configuration for an otlp receiver.
receivers:
  otlp:
    protocols:
      http:
        endpoint: "localhost:4318"
        cors:
          allowed_origins:
            - http://test.com
            # Origins can have wildcards with *, use * by itself to match any origin.
            - https://*.example.com
          allowed_headers:
            - Example-Header
          max_age: 7200
You can find more details on advanced configurations OTLP.
After configuring a receiver, you must enable it. Receivers are enabled via pipelines within the service section. A pipeline consists of a set of receivers, processors, and exporters.
The following is an example pipeline configuration:
service:
  pipelines:
    metrics:
      receivers: [otlp, prometheus]
      exporters: [otlp, prometheus]
    traces:
      receivers: [otlp, jaeger]
      processors: [batch]
      exporters: [otlp, zipkin]
Now that you understand how OpenTelemetry collector collects data, let’s see what MongoDB metrics can be collected.
Prerequisites
This tutorial assumes that you have the OpenTelemetry Collectorinstalled on the same host as your database if you plan to monitor a local database.
Preparing MongoDB database setup
For the purpose of this tutorial, we can use any of the following:
- A local MongoDB installation
- A free/paid hosted service like MongoDB Atlas
- A docker-compose-based database setup
This section guides you through quick database setup using Docker and Docker-Compose.
This would help you get rid of any technical challenges related to setting up the agent or database locally. The below links can help you with the Docker installation:
Once you have the Docker installation ready to go, create the below docker-compose.yaml file. Note that the mongodbreceiver as of today, supports only v4.0+ and v5.x. Thus, we will be using the initial stable release of v5.
version: '3.8'
services:
  mongodb:
    image: mongo:5.0.22
    environment:
      MONGO_INITDB_DATABASE: admin
      MONGO_INITDB_ROOT_USERNAME: root
      MONGO_INITDB_ROOT_PASSWORD: password123
    ports:
      - '27017:27017'
    volumes:
      - dbdata6:/data/db
volumes:
  dbdata6:
Once done, execute the below command from the same folder to get the MongoDB database server up and running.
docker-compose up -d
This is a very simple Docker compose file that can spin up MongoDB Database in no time with authentication enabled. It stores the data from MongoDB DB locally in your disk and mounts it onto the container. It makes the database accessible on port 27017 locally.
Setting up SigNoz
You need a backend to which you can send the collected data for monitoring and visualization. SigNoz is an OpenTelemetry-native APM that is well-suited for visualizing OpenTelemetry data.
SigNoz cloud is the easiest way to run SigNoz. You can sign up here for a free account and get 30 days of unlimited access to all features.
You can also install and self-host SigNoz yourself. Check out the docs for installing self-host SigNoz.
Setting up OpenTelemetry collector
The OpenTelemetry Collector offers various deployment options to suit different environments and preferences. It can be deployed using Docker, Kubernetes, Nomad, or directly on Linux systems. You can find all the installation options here.
We are going to discuss the manual installation here and resolve any hiccups that come in the way.
Step 1 - Downloading OpenTelemetry Collector
Download the appropriate binary package for your Linux or macOS distribution from the OpenTelemetry Collector releases page. We are using the latest version available at the time of writing this tutorial.
For MACOS (arm64):
curl --proto '=https' --tlsv1.2 -fOL https://github.com/open-telemetry/opentelemetry-collector-releases/releases/download/v0.90.0/otelcol-contrib_0.90.0_darwin_arm64.tar.gz
Step 2 - Extracting the package
Create a new directory named otelcol-contrib and then extract the contents of the archive into this newly created directory with the following command:
mkdir otelcol-contrib && tar xvzf otelcol-contrib_0.90.0_darwin_arm64.tar -C otelcol-contrib
Step 3 - Setting up the configuration file
Create a config.yaml file in the otelcol-contrib folder. This configuration file will enable the collector to connect with MongoDB and have other settings like at what frequency you want to monitor the instance.
The configuration file should be created in the same directory where you unpack the otel-collector-contrib binary. In case you have globally installed the binary, it is ok to create on any path.
receivers:
  otlp:
    protocols:
      grpc:
        endpoint: localhost:4317
      http:
        endpoint: localhost:4318
  mongodb:
    hosts:
      - endpoint: localhost:27017
    username: <root-username>
    password: <root-password>
    collection_interval: 30s
    initial_delay: 30s
    tls:
      insecure: true
      insecure_skip_verify: true
processors:
  batch:
    send_batch_size: 1000
    timeout: 10s
exporters:
  otlp:
    endpoint: "ingest.{region}.signoz.cloud:443" # replace {region} with your region
    tls:
      insecure: false
    headers:
      "signoz-ingestion-key": "{signoz-token}" # Obtain from https://{your-signoz-url}/settings/ingestion-settings
  logging:
    verbosity: detailed
service:
  telemetry:
    metrics:
      address: localhost:8888
  pipelines:
    metrics:
      receivers: [otlp, mongodb]
      processors: [batch]
      exporters: [otlp]
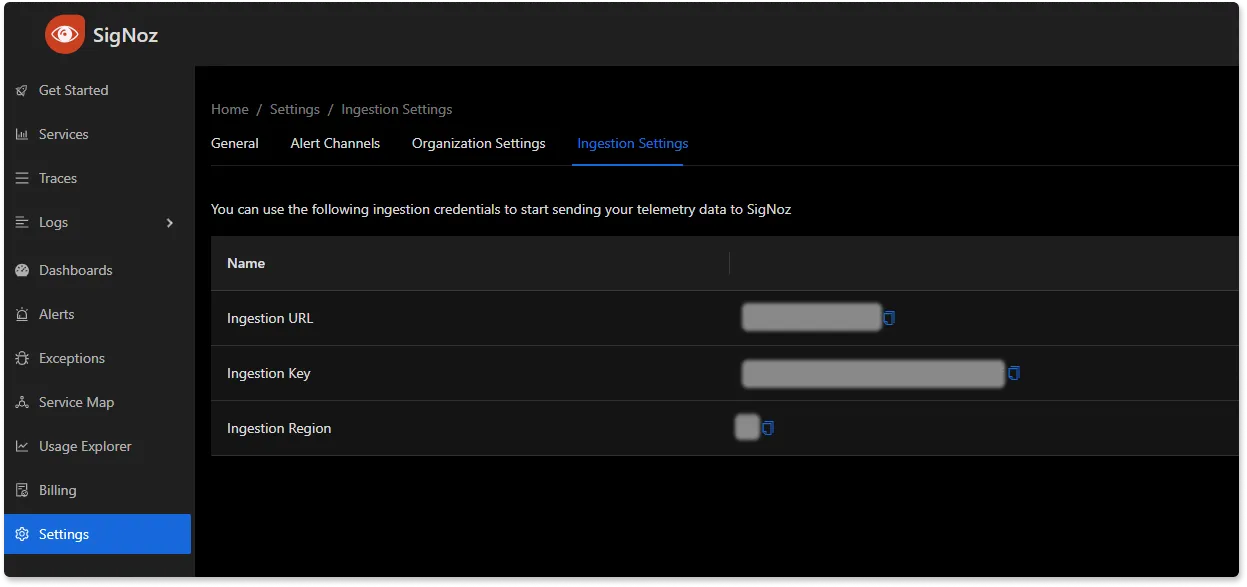
You would need to replace region and signoz-token in the above file with the region of your choice (for Signoz Cloud) and token obtained from Signoz Cloud → Settings → Ingestion Settings.
Additionally, replace the MySQL username and password as well. In case you are using the docker-compose based setup, the username will be root, and the password will be password123.
The above configuration is quite simple - Whenever you wish to monitor a different remote self-hosted database (other than MongoDB Atlas), all you would need to change is endpoint url for the mongodbreceiver. You can also monitor multiple MongoDB servers by adding multiple receivers as shown below:
receivers:
  otlp:
    protocols:
      grpc:
        endpoint: localhost:4317
      http:
        endpoint: localhost:4318
  mongodb:
    hosts:
      - endpoint: localhost:27017
    username: <root-username>
    password: <root-password>
    collection_interval: 30s
    initial_delay: 30s
    tls:
      insecure: true
      insecure_skip_verify: true
  mongodb/2:
    hosts:
      - endpoint: <remote-url>:27017
    username: <root-username>
    password: <root-password>
    collection_interval: 30s
    initial_delay: 30s
    tls:
      insecure: true
      insecure_skip_verify: true
processors:
  batch:
    send_batch_size: 1000
    timeout: 10s
exporters:
  otlp:
    endpoint: "ingest.{region}.signoz.cloud:443" # replace {region} with your region
    tls:
      insecure: false
    headers:
      "signoz-ingestion-key": "{signoz-token}" # Obtain from https://{your-signoz-url}/settings/ingestion-settings
  logging:
    verbosity: detailed
service:
  telemetry:
    metrics:
      address: localhost:8888
  pipelines:
    metrics:
      receivers: [otlp, mongodb, mongodb/2]
      processors: [batch]
      exporters: [otlp]
Step 4 - Running the collector service
Every Collector release includes an otelcol executable that you can run. Since we’re done with configurations, we can now run the collector service with the following command.
From the otelcol-contrib, run the following command:
./otelcol-contrib --config ./config.yaml
If you want to run it in the background -
./otelcol-contrib --config ./config.yaml &> otelcol-output.log & echo "$\!" > otel-pid
Step 5 - Debugging the output
If you want to see the output of the logs, we’ve just set up for the background process. You may look it up with:
tail -f -n 50 otelcol-output.log
tail 50 will give the last 50 lines from the file otelcol-output.log
You can stop the collector service with the following command:
kill "$(< otel-pid)"
You should start seeing the metrics on your Signoz Cloud UI in about 30 seconds.
Monitoring with Signoz Dashboard
Once the above setup is done, you will be able to access the metrics in the SigNoz dashboard. You can go to the Dashboards tab and try adding a new panel. You can learn how to create dashboards in SigNoz here.
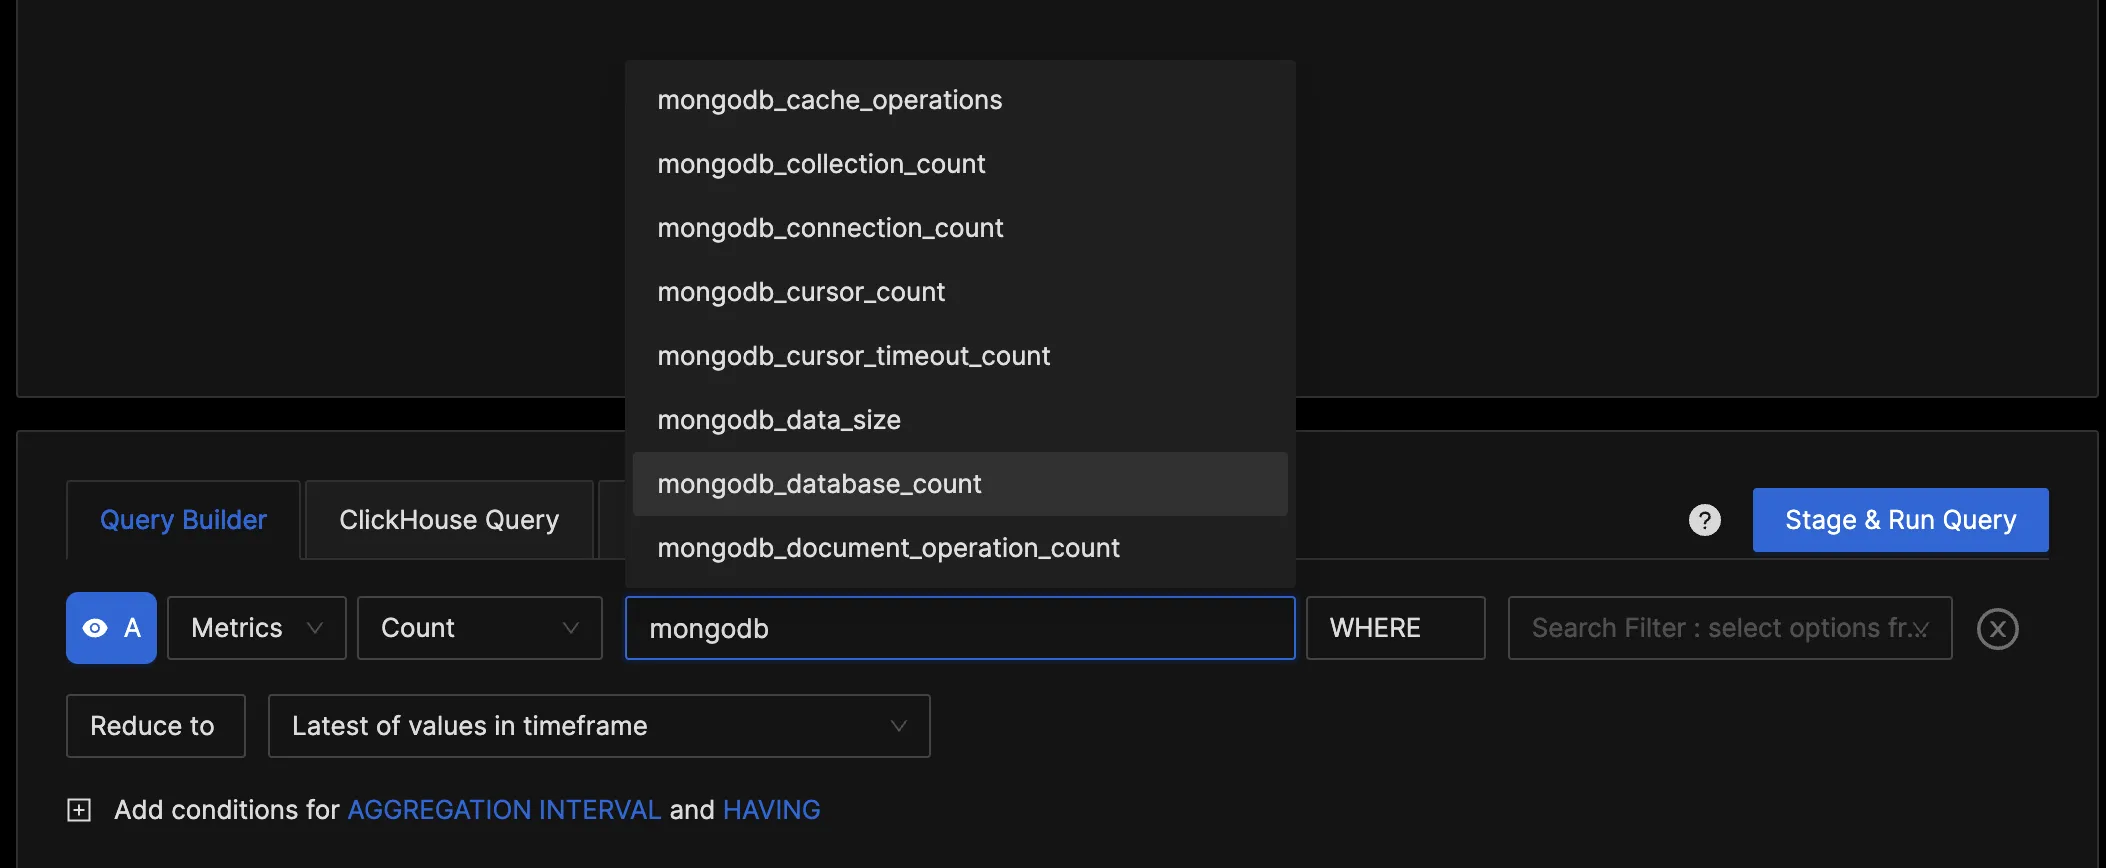
You can easily create charts with query builder in SigNoz. Here are the steps to add a new panel to the dashboard.
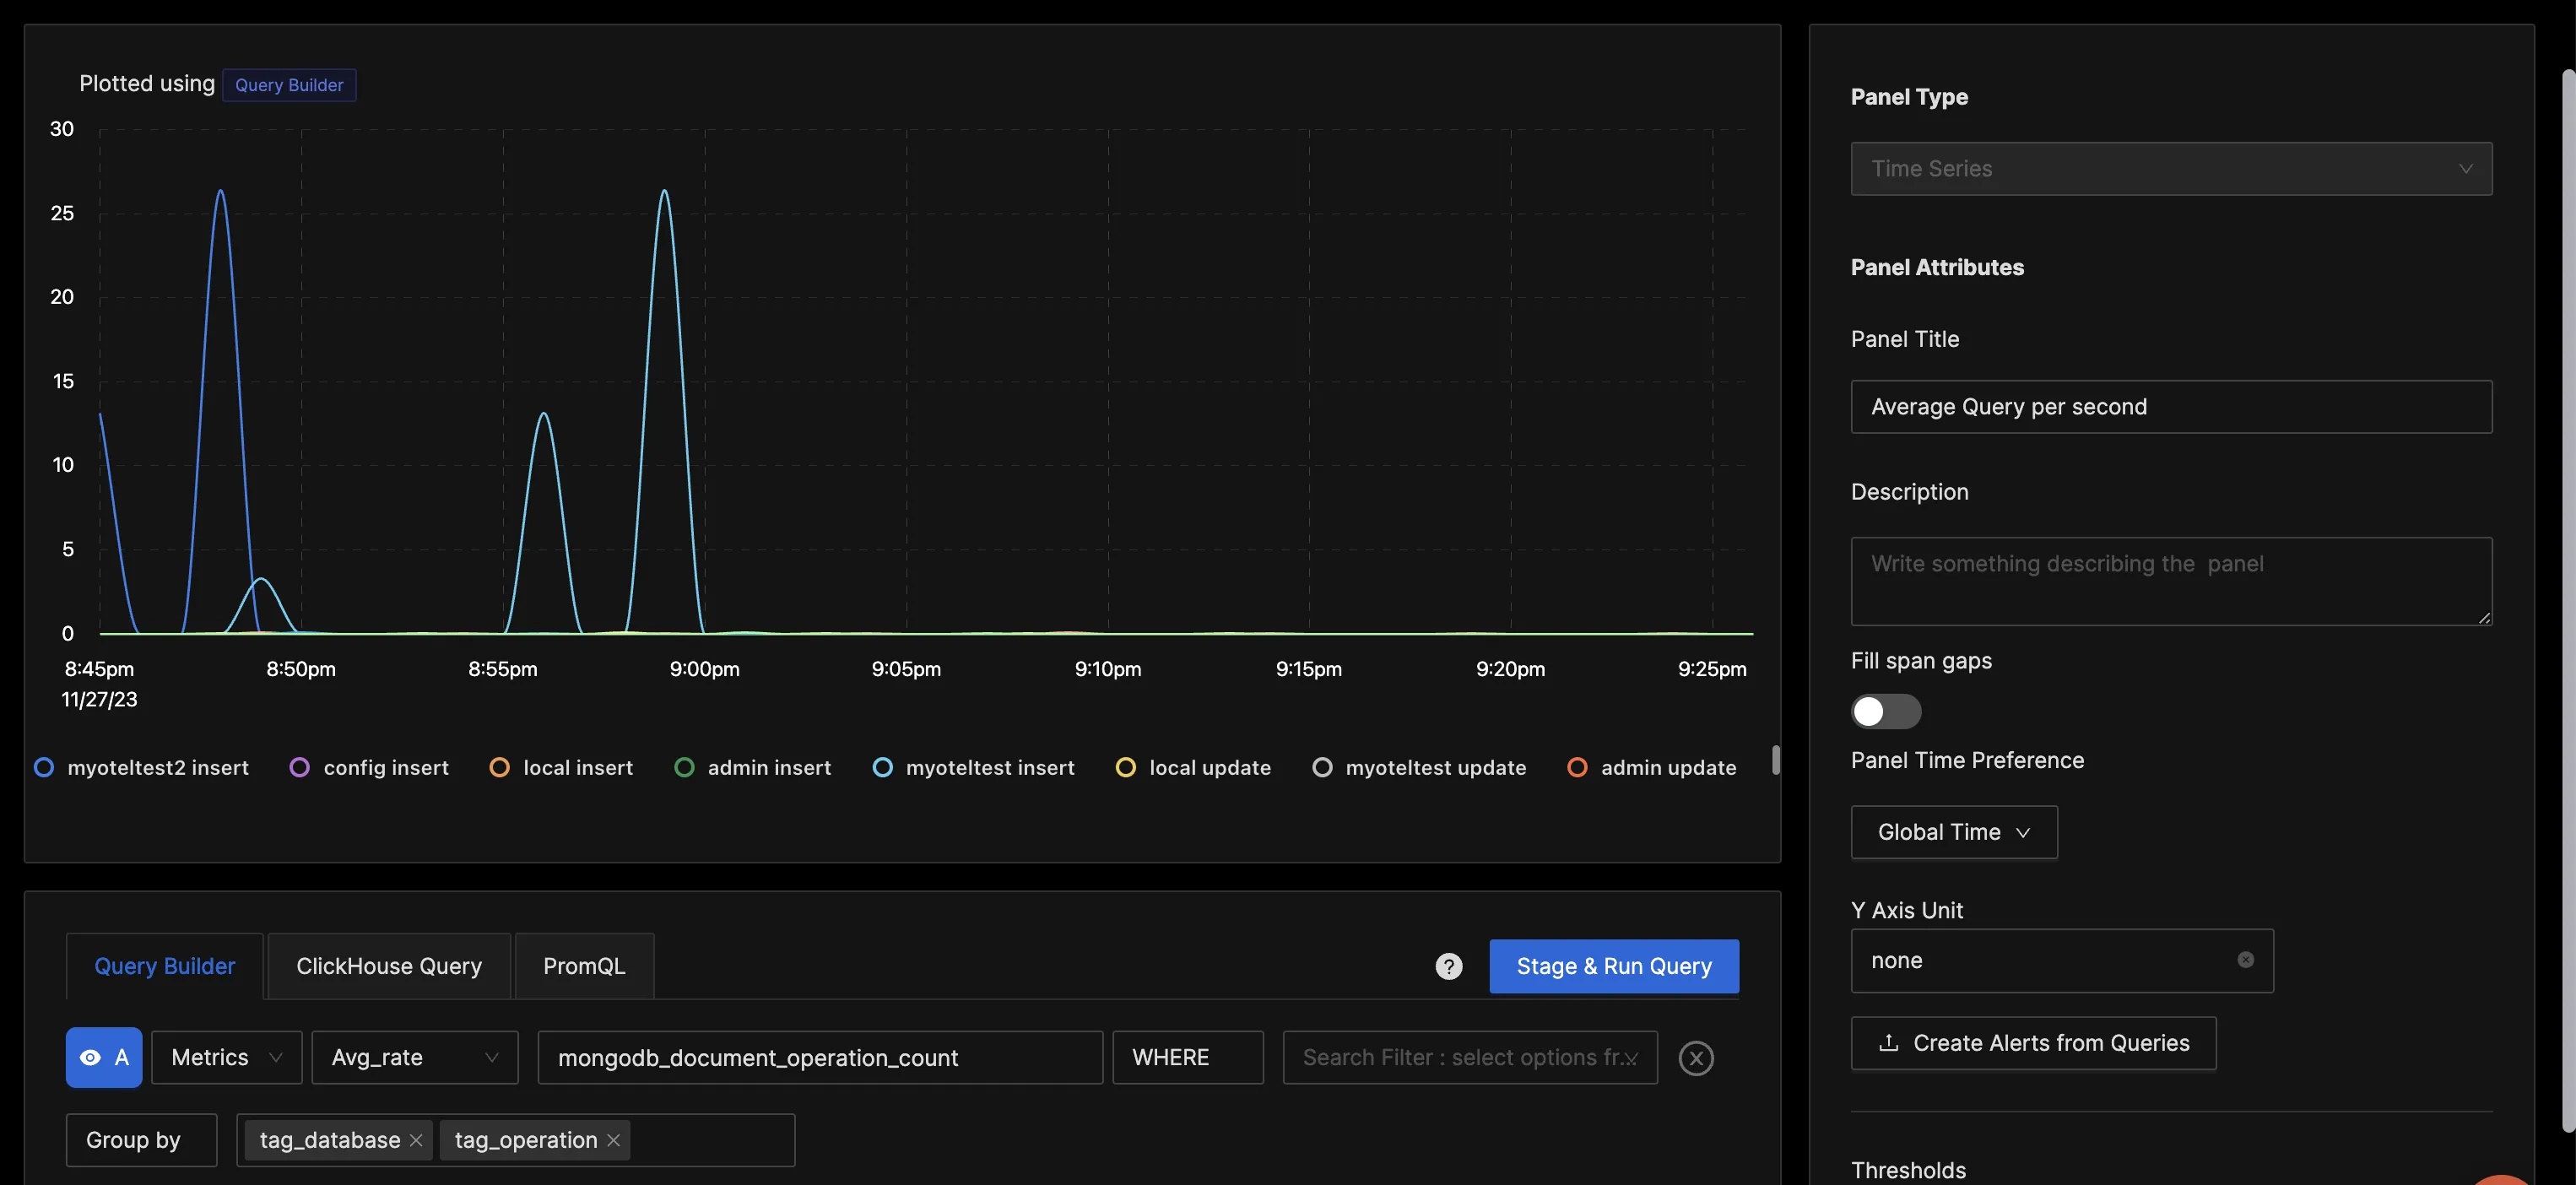
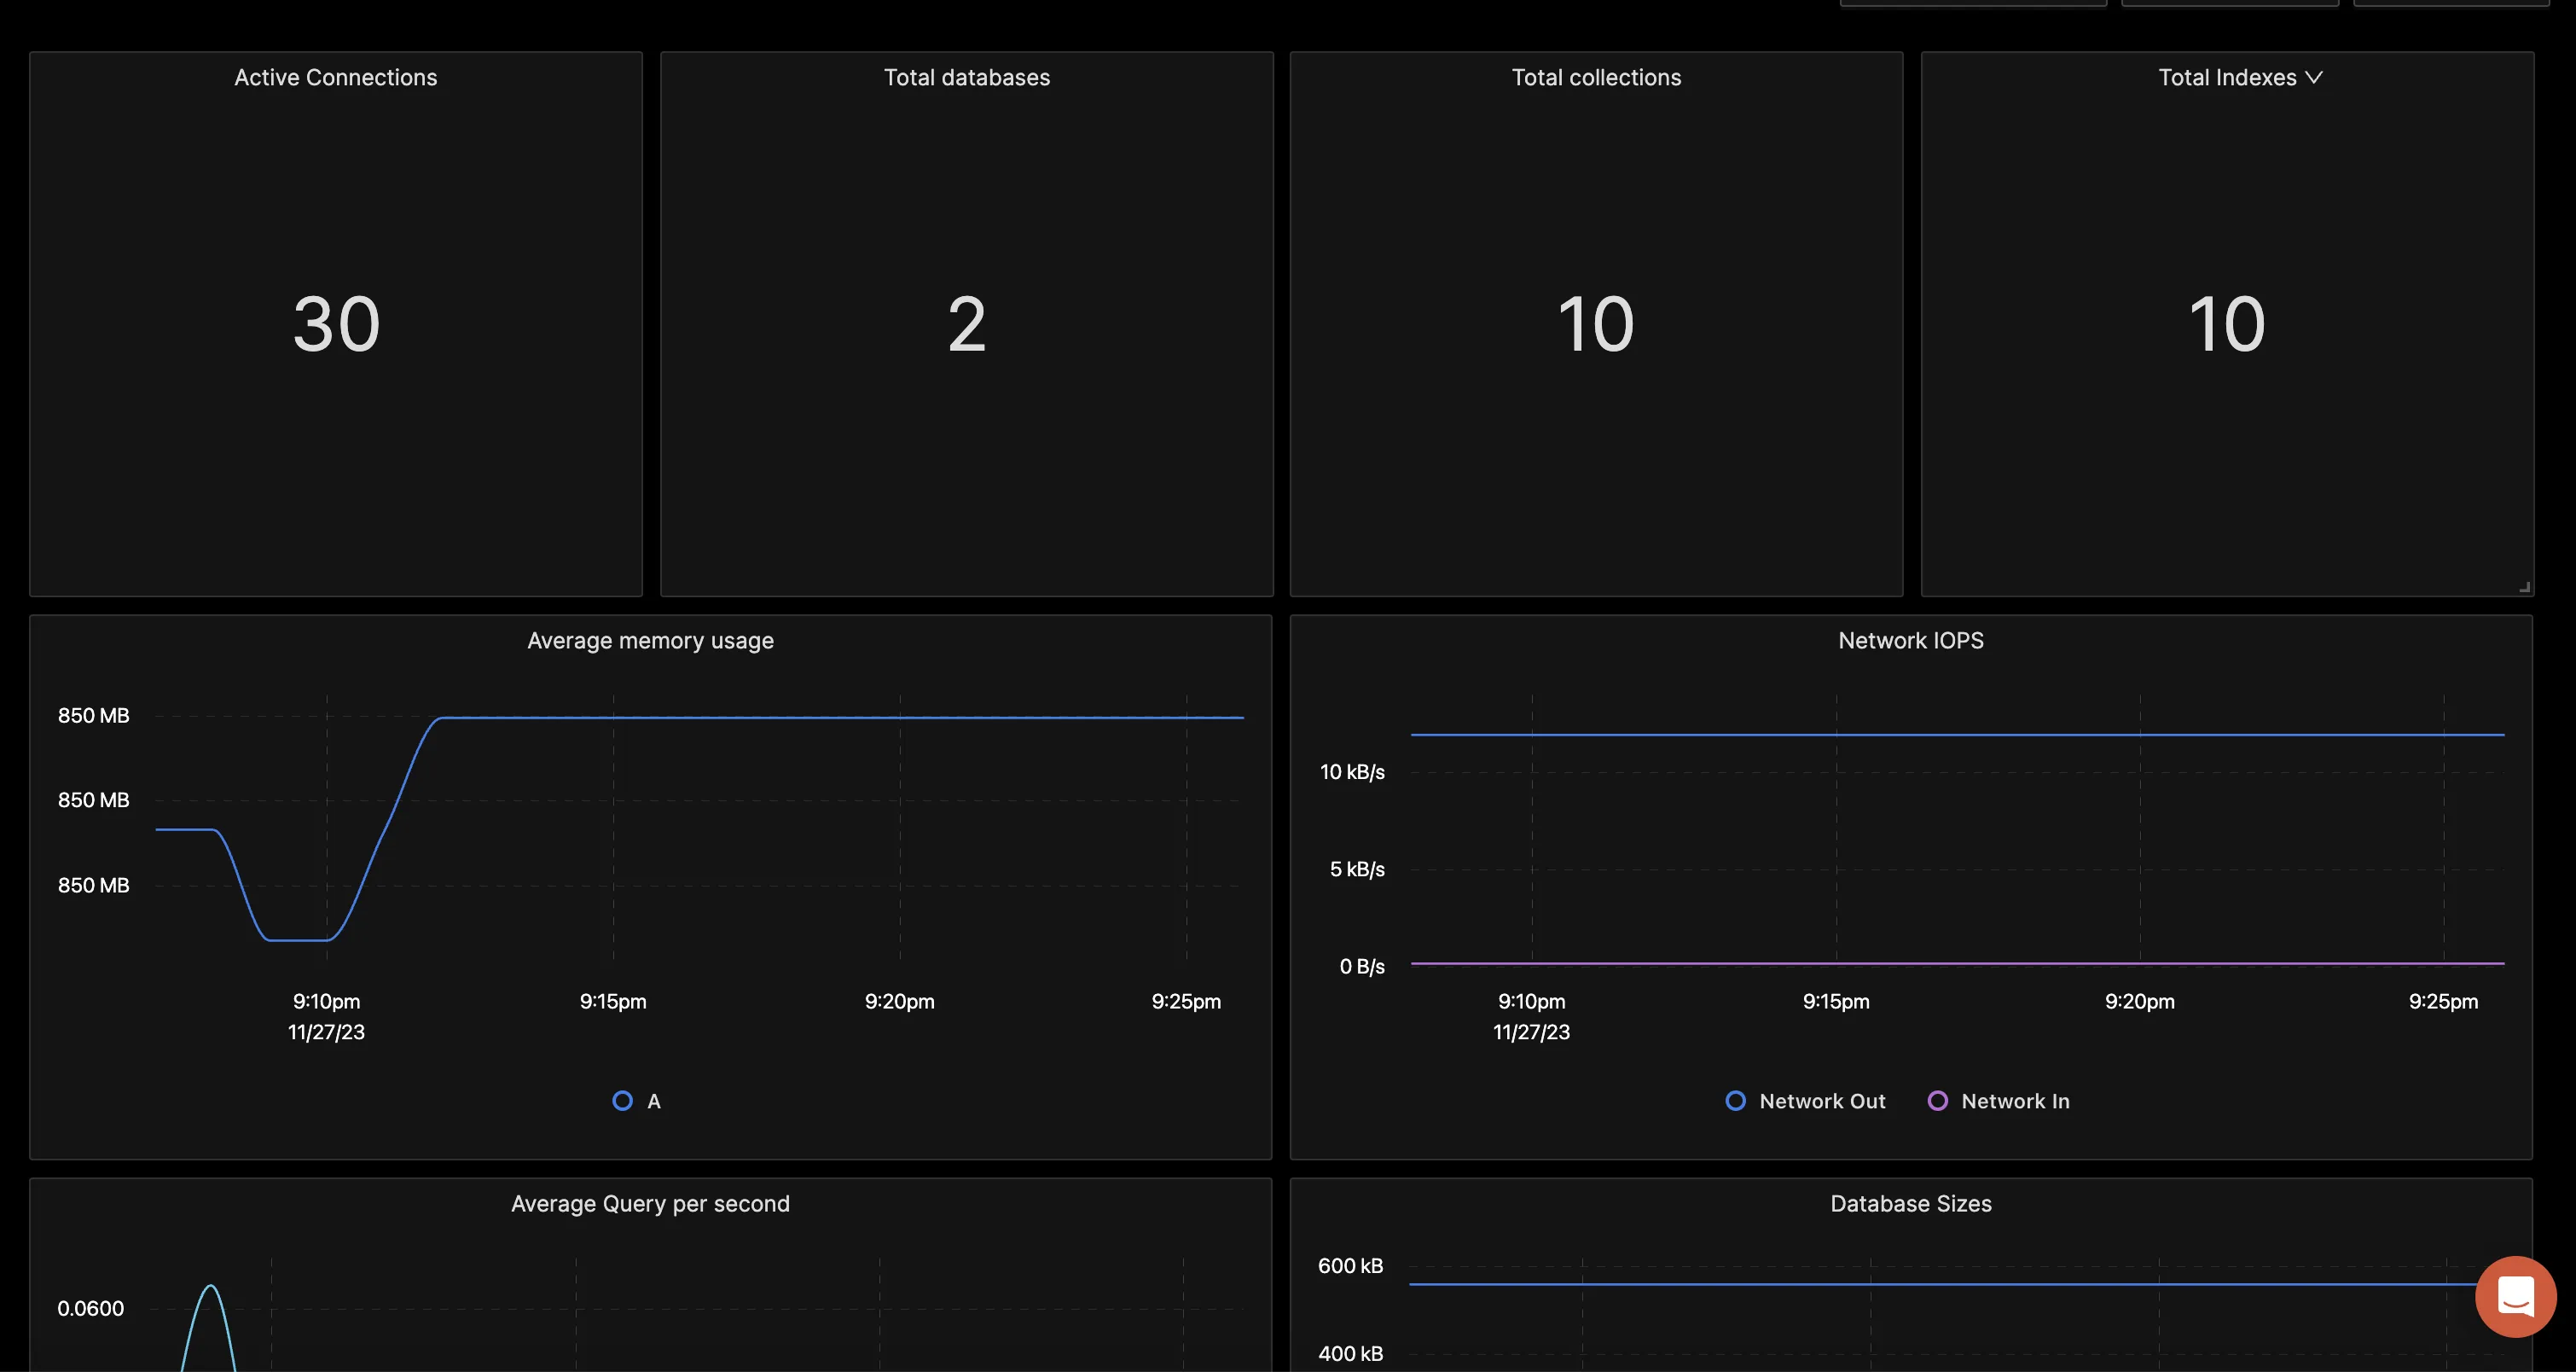
You can build a complete dashboard around various metrics emitted. Here’s a look at a sample dashboard we built out using the metrics collected. If you want to get started quickly with MongoDB monitoring, you can load this MongoDB JSON in the SigNoz dashboard and get started.
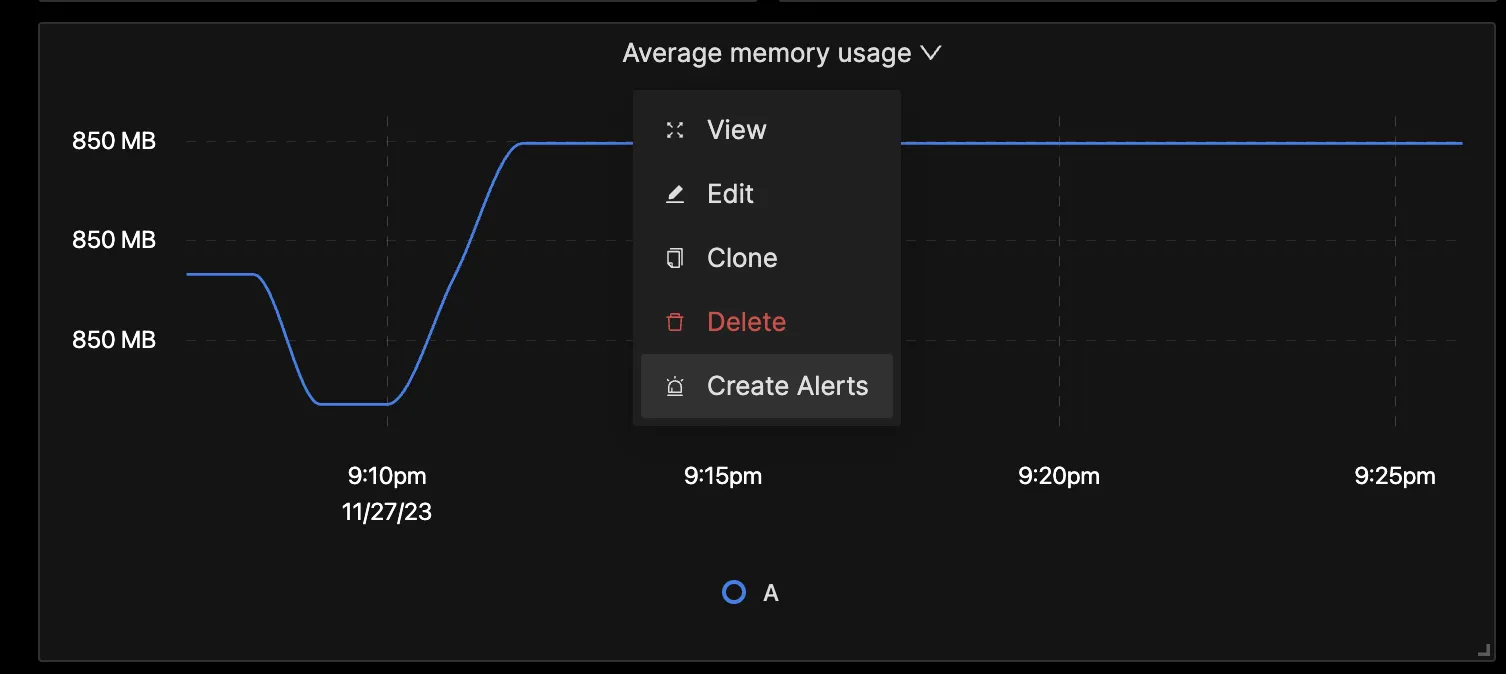
You can also create alerts on any metric. Learn how to create alerts here.
Reference: MongoDB metrics and labels collected by OpenTelemetry Collector
The mongodbreceiver available with Open Telemetry Collector Contrib collects the below set of metrics and labels.
| Metric | Description | Attributes | Type |
|---|---|---|---|
| mongodb.cache.operations | The number of Cache operations of the instance | type | Sum |
| mongodb.collection.count | Total collections | database | Sum |
| mongodb.data.size | Total size of the collection | database | Sum |
| mongodb.connection.count | Total connections by type | connection_type, database | Sum |
| mongodb.extent.count | The total number of extents | database | Sum |
| mongodb.global_lock.time | Total time for which global_lock is held | none | Sum |
| mongodb.index.count | Total number of indexes | database | Sum |
| mongodb.index.size | Total size of indexes | database | Sum |
| mongodb.memory.usage | Net memory used | database | Sum |
| mongodb.object.count | Total number of objects | database | Sum |
| mongodb.operation.latency.time | Latency in operations by operation_type | operation_latency | Gauge |
| mongodb.operation.count | Total number of operations of each type | operation | Sum |
| mongodb.operation.repl.count | Number of replicated operations executed | operation | Sum |
| mongodb.storage.size | Total storage allocated to the collection | database | Sum |
| mongodb.database.count | Total databases that exist | none | Sum |
| mongodb.index.access.count | Total indexes that have been accessed | database,collection | Sum |
| mongodb.document.operation.count | Number of document operations executed | database, operation | Sum |
| mongodb.network.io.receive | Number of bytes received - Indicates inflow rate of data | none | Sum |
| mongodb.network.io.transmit | Number of bytes transmitted out | none | Sum |
| mongodb.network.request.count | Total number of requests received by the server | none | Sum |
| mongodb.operation.time | Time spent performing specific operations | operation | Sum |
| mongodb.session.count | Number of active session | none | Sum |
| mongodb.cursor.count | Count of total open cursors | none | Sum |
| mongodb.cursor.timeout.count | Count of cursors that timed out | none | Sum |
| mongodb.lock.acquire.count | Number of times lock was acquired in specific mode | database, lock_type, lock_mode | Sum |
| mongodb.lock.acquire.wait_count | Number of times lock acquisitions encountered wait because the locks were held in conflicting mode | database, lock_type, lock_mode | Sum |
| mongodb.lock.acquire.time | Cumulative wait time for lock acquisition | database, lock_type, lock_mode | Sum |
| mongodb.lock.deadlock.count | Number of times lock acquisition acquired deadlocks | database, lock_type, lock_mode | Sum |
| mongodb.health | Health status of MongoDB | none | Gauge |
| mongodb.uptime | Time the server has been up and running | none | Sum |
Conclusion
In this tutorial, you installed an OpenTelemetry Collector to collect MongoDB metrics and sent the collected data to SigNoz for monitoring and alerts.
Visit our complete guide on OpenTelemetry Collector to learn more about it. OpenTelemetry is quietly becoming the world standard for open-source observability, and by using it, you can have advantages like a single standard for all telemetry signals, no vendor lock-in, etc.
SigNoz is an open-source OpenTelemetry-native APM that can be used as a single backend for all your observability needs.
Further Reading
Complete Guide on OpenTelemetry Collector
