How to Monitor MySQL Metrics with OpenTelemetry
Database monitoring is an important aspect to look at for a high-volume or high-traffic system. The database performance drastically impacts the response times for the application. In this tutorial, you will install OpenTelemetry Collector to collect MySQL metrics and then send the collected data to SigNoz for monitoring and visualization.

In this tutorial, we cover:
- A brief overview of MySQL Database
- A Brief Overview of OpenTelemetry
- How does OpenTelemetry Collector collect data?
- Pre-requisites
- Setting up SigNoz
- Setting up OpenTelemetry collector
- Monitoring with Signoz Dashboard
- Reference: MySQL metrics and labels collected by OpenTelemetry
- Conclusion
- Further Reading
If you want to jump straight into implementation, start with this pre-requisites section.
A brief overview of MySQL Database
MySQL is an open-source relational database used by several popular companies around the world. Over the years, it has matured quite well and provides excellent performance even at large scale. Despite this, the tooling provided by the MySQL community is not good enough to monitor the database easily. With a metrics collector like Opentelemetry Collector, we could easily fetch the metrics and publish them to a remote destination like SigNoz to visualize them.
In this tutorial, we will build an end-to-end monitoring solution for MySQL using an OpenTelemetry MySQL receiver to collect the metrics and Signoz to visualize the collected metrics.
A Brief Overview of OpenTelemetry
OpenTelemetry is a set of APIs, SDKs, libraries, and integrations aiming to standardize the generation, collection, and management of telemetry data(logs, metrics, and traces). It is backed by the Cloud Native Computing Foundation and is the leading open-source project in the observability domain.
The data you collect with OpenTelemetry is vendor-agnostic and can be exported in many formats. Telemetry data has become critical in observing the state of distributed systems. With microservices and polyglot architectures, there was a need to have a global standard. OpenTelemetry aims to fill that space and is doing a great job at it thus far.
In this tutorial, you will use OpenTelemetry Collector to collect MySQL metrics for performance monitoring.
What is OpenTelemetry Collector?
OpenTelemetry Collector is a stand-alone service provided by OpenTelemetry. It can be used as a telemetry-processing system with a lot of flexible configurations to collect and manage telemetry data.
It can understand different data formats and send it to different backends, making it a versatile tool for building observability solutions.
Read our complete guide on OpenTelemetry Collector
How does OpenTelemetry Collector collect data?
Data collection in OpenTelemetry Collector is facilitated through receivers. Receivers are configured via YAML under the top-level receivers tag. To ensure a valid configuration, at least one receiver must be enabled.
Below is an example of an otlp receiver:
receivers:
  otlp:
    protocols:
      grpc:
      http:
The OTLP receiver accepts data through gRPC or HTTP in the OTLP format. There are advanced configurations that you can enable via the YAML file.
Here’s a sample configuration for an OTLP receiver:
receivers:
  otlp:
    protocols:
      http:
        endpoint: "localhost:4318"
        cors:
          allowed_origins:
            - http://test.com
            # Origins can have wildcards with *, use * by itself to match any origin.
            - https://*.example.com
          allowed_headers:
            - Example-Header
          max_age: 7200
You can find more details on advanced configurations here.
Once a receiver is configured, it needs to be enabled to start the data flow. This involves setting up pipelines within a service. A pipeline acts as a streamlined pathway for data, outlining how it should be processed and where it should go. A pipeline comprises of the following:
- Receivers: These are entry points for data into the OpenTelemetry Collector, responsible for collecting data from various sources and feeding it into the pipeline.
- Processors: After data is received, processors manipulate, filter, or enhance the data as needed before it proceeds further in the pipeline. They provide a way to customize the data according to specific requirements.
- Exporters: After processing, the data is ready for export. Exporters define the destination for the data, whether it's an external monitoring system, storage, or another service. They format the data appropriately for the chosen output.
Below is an example pipeline configuration:
service:
  pipelines:
    metrics:
      receivers: [otlp, prometheus]
			processors: [batch]
      exporters: [otlp, prometheus]
Here’s a breakdown of the above metrics pipeline:
- Receivers: This pipeline is configured to receive metrics data from two sources: OTLP and Prometheus. The
otlpreceiver collects metrics using both gRPC and HTTP protocols, while theprometheusreceiver gathers metrics from Prometheus. - Processors: Metrics data is processed using the
batchprocessor. This processor likely batches metrics before exporting them, optimizing the data flow. - Exporters: Metrics processed through this pipeline can be exported to both OTLP and Prometheus destinations. The
otlpexporter sends data to an endpoint specified in the configuration, and theprometheusexporter handles the export of metrics to a Prometheus-compatible destination.
Pre-requisites
This tutorial assumes that the OpenTelemetry Collector is installed on the same host as the MySQL setup.
Preparing MySQL database setup
For the purpose of this tutorial, we can use a local MySQL setup if you have it installed already. In case you do not have a MySQL database installed already, you can follow the below guide to run the MySQL database locally using Docker and Docker-Compose.
This would help you get rid of any technical challenges related to setting up the agent or database locally. Below links can help you with the Docker installation:
Once you have Docker installation ready to go, create the below docker-compose.yaml file.
version: "3.3"
services:
  mysqldb:
    image: mysql
    restart: always
    environment:
      MYSQL_DATABASE: "myoteldb"
      MYSQL_ROOT_PASSWORD: "password123"
    ports:
      - "3306:3306"
    expose:
      # Opens port 3306 on the container
      - "3306"
      # Where our data will be persisted
    volumes:
      - my-db:/var/lib/mysql
volumes:
  my-db:
Once done, execute the below command from the same folder to get the MySQL database server up and running.
docker-compose up -d
This is a very simple Docker compose file that can spin up MySQL Database in no time. It stores the data from MySQL DB locally in your disk and mounts it onto the container. It makes the database accessible on port 3306 locally.
Setting up SigNoz
You need a backend to which you can send the collected data for monitoring and visualization. SigNoz is an OpenTelemetry-native APM that is well-suited for visualizing OpenTelemetry data.
SigNoz cloud is the easiest way to run SigNoz. You can sign up here for a free account and get 30 days of unlimited access to all features.
You can also install and self-host SigNoz yourself. Check out the docs for installing self-host SigNoz.
Setting up OpenTelemetry collector
The OpenTelemetry Collector offers various deployment options to suit different environments and preferences. It can be deployed using Docker, Kubernetes, Nomad, or directly on Linux systems. You can find all the installation options here.
We are going to discuss the manual installation here and resolve any hiccups that come in the way.
Step 1 - Downloading OpenTelemetry Collector
Download the appropriate binary package for your Linux or macOS distribution from the OpenTelemetry Collector releases page. We are using the latest version available at the time of writing this tutorial.
For MACOS (arm64):
curl --proto '=https' --tlsv1.2 -fOL https://github.com/open-telemetry/opentelemetry-collector-releases/releases/download/v0.116.0/otelcol-contrib_0.116.0_darwin_arm64.tar.gz
Step 2 - Extracting the package
Create a new directory named otelcol-contrib and then extract the contents of the otelcol-contrib_0.116.0_darwin_arm64.tar.gz archive into this newly created directory with the following command:
mkdir otelcol-contrib && tar xvzf otelcol-contrib_0.116.0_darwin_arm64.tar.gz -C otelcol-contrib
Step 3 - Setting up the configuration file
Create a config.yaml file in the otelcol-contrib folder. This configuration file will enable the collector to connect with MySQL and have other settings, such as the frequency at which you want to monitor the instance.
The configuration file should be created in the same directory where you unpack the otel-collector-contrib binary. In case you have globally installed the binary, it is ok to create on any path.
receivers:
  otlp:
    protocols:
      grpc:
        endpoint: localhost:4317
      http:
        endpoint: localhost:4318
  mysql:
    endpoint: localhost:3306
    username: <your-root-username>
    password: <your-root-password>
    collection_interval: 10s
    initial_delay: 10s
processors:
  resource/env:
    attributes:
    - key: deployment.environment
      value: staging
      action: upsert
  batch:
    send_batch_size: 1000
    timeout: 10s
exporters:
  otlp:
    endpoint: "ingest.{region}.signoz.cloud:443" # replace {region} with your region
    tls:
      insecure: false
    headers:
      "signoz-ingestion-key": "{signoz-token}" # Obtain from https://{your-signoz-url}/settings/ingestion-settings
  debug:
    verbosity: detailed
service:
  telemetry:
    metrics:
      address: localhost:8888
  pipelines:
    metrics:
      receivers: [otlp, mysql]
      processors: [resource/env, batch]
      exporters: [otlp]
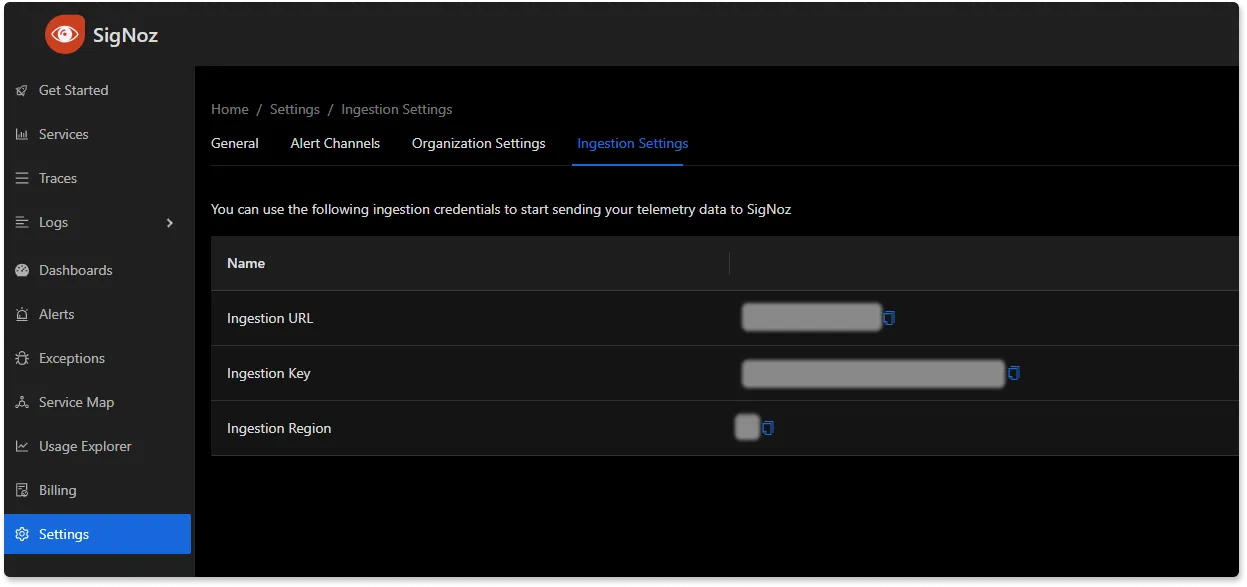
You would need to replace region and signoz-token in the above file with the region of your choice (for Signoz Cloud) and token obtained from Signoz Cloud → Settings → Integration Settings. The ingestion key details are also available in the SigNoz Cloud dashboard.
Additionally, replace the MySQL username and password as well. In case you are using the docker-compose-based setup, the username will be root, and the password will be password123.
The above configuration is quite simple - Whenever you wish to monitor a different remote database, all you would need to change is the endpoint URL for the mysql receiver. You can also monitor multiple MySQL databases by adding multiple receivers, as shown below:
receivers:
  otlp:
    protocols:
      grpc:
        endpoint: localhost:4317
      http:
        endpoint: localhost:4318
  mysql:
    endpoint: mysqldb:3306
    username: root
    password: password123
    collection_interval: 10s
    initial_delay: 10s
  mysql/2:
    endpoint: some-remote-database-url:3306
    username: remote-username
    password: secret-password
    collection_interval: 10s
    initial_delay: 10s
processors:
  resource/env:
    attributes:
    - key: deployment.environment
      value: staging
      action: upsert
  batch:
    send_batch_size: 1000
    timeout: 10s
exporters:
  otlp:
    endpoint: "ingest.{region}.signoz.cloud:443" # replace {region} with your region
    tls:
      insecure: false
    headers:
      "signoz-ingestion-key": "{signoz-token}" # Obtain from https://{your-signoz-url}/settings/ingestion-settings
  debug:
    verbosity: detailed
service:
  telemetry:
    metrics:
      address: localhost:8888
  pipelines:
    metrics:
      receivers: [otlp, mysql, mysql/2]
      processors: [resource/env, batch]
      exporters: [otlp]
Step 4 - Running the collector service
Every Collector release includes an otelcol executable that you can run. Since we’re done with configurations, we can now run the collector service with the following command.
From the otelcol-contrib, run the following command:
./otelcol-contrib --config ./config.yaml
If you want to run it in the background -
./otelcol-contrib --config ./config.yaml &> otelcol-output.log & echo "$\!" > otel-pid
Step 5 - Debugging the output
If you want to see the output of the logs, we’ve just set up for the background process. You may look it up with:
tail -f -n 50 otelcol-output.log
tail 50 will give the last 50 lines from the file otelcol-output.log
You can stop the collector service with the following command:
kill "$(< otel-pid)"
You should start seeing the metrics on your Signoz Cloud UI in about 30 seconds.
Monitoring with Signoz Dashboard
Once the above setup is done, you will be able to access the metrics in the SigNoz dashboard. You can go to the Dashboards tab and try adding a new panel. You can learn how to create dashboards in SigNoz here.
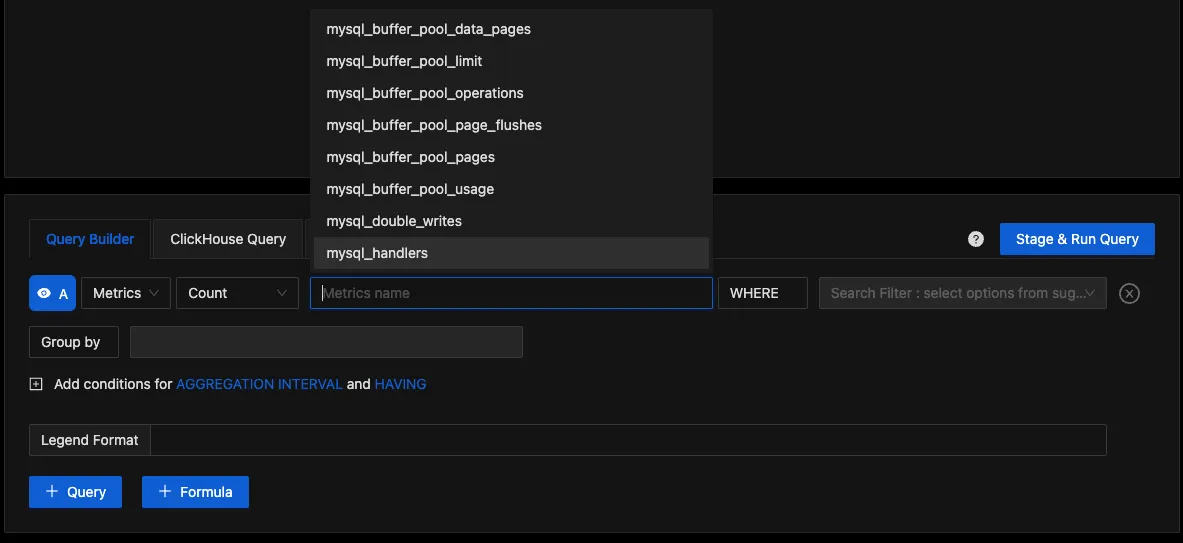
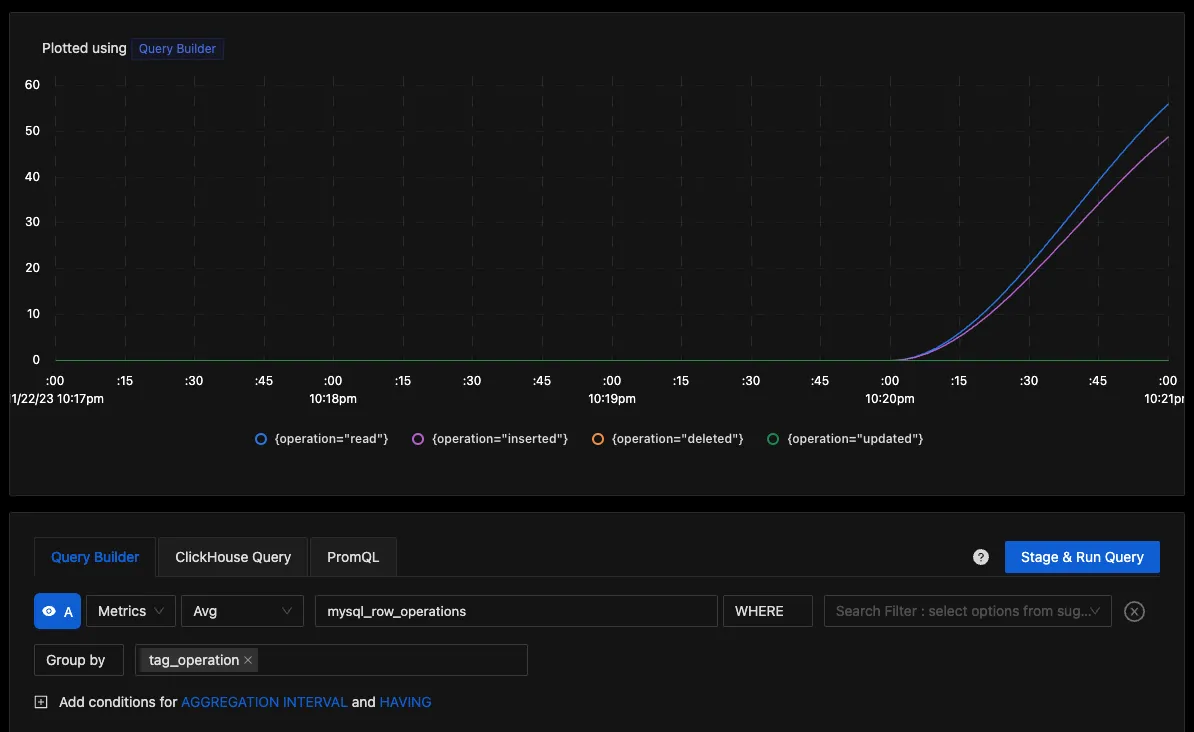
You can easily create charts with query builder in SigNoz. Here are the steps to add a new panel to the dashboard.
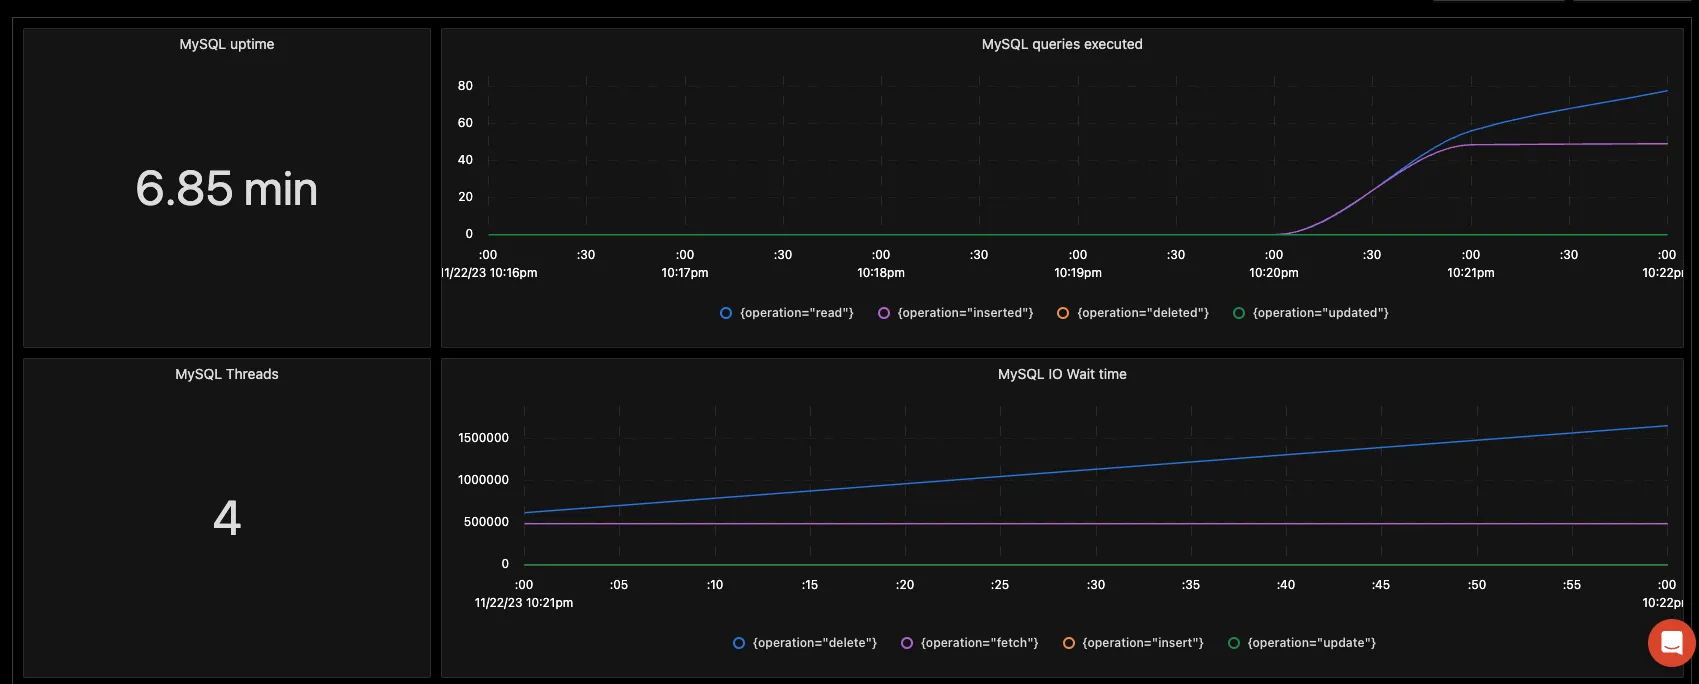
You can build a complete dashboard around various metrics emitted. Here’s a look at a sample dashboard we built out using the metrics collected.
You can also create alerts on any metric. Learn how to create alerts here.
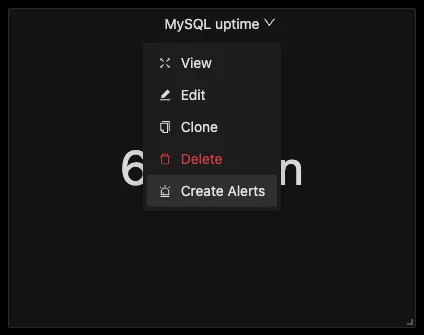
For instance, as shown above, you could create an uptime alert that quickly updates you if there is any downtime in the database. If you want to get started quickly with MySQL monitoring, you can load this MySQL JSON in the SigNoz dashboard and get started.
Reference: MySQL metrics and labels collected by OpenTelemetry
The OpenTelemetry collector receiver connects with your desired MySQL database and gathers the below set of metrics:
| Metric | Description | Attributes | Type |
|---|---|---|---|
| mysql.buffer_pool.data_pages | Number of data pages for an InnoDB buffer pool | status | Sum |
| mysql.buffer_pool.limit | Configured size of the InnoDB buffer pool | none | Sum |
| mysql.buffer_pool.operations | Number of operations on the InnoDB buffer pool | operation | Sum |
| mysql.buffer_pool.page_flushes | Sum of Requests to flush pages for the InnoDB buffer pool | none | Sum |
| mysql.buffer_pool.pages | Sum of pages in the InnoDB buffer pool | kind | Sum |
| mysql.buffer_pool.usage | Number of bytes in the InnoDB buffer pool | status | Sum |
| mysql.double_writes | Number of writes to the InnoDB doublewrite buffer pool | kind | Sum |
| mysql.handlers | Number of requests to various MySQL handlers | kind | Sum |
| mysql.index.io.wait.count | Sum of I/O wait events for a particular index | operation, table, schema, index | Sum |
| mysql.index.io.wait.time | Total time of I/O wait events for a particular index | operation, table, schema, index | Sum |
| mysql.locks | Total MySQL locks | kind | Sum |
| mysql.log_operations | Number of InnoDB log operations | operation | Sum |
| mysql.mysqlx_connections | Total MySQLx connections | status | Sum |
| mysql.opened_resources | Total opened resources | kind | Sum |
| mysql.operations | Total operations including fsync, reads and writes | operation | Sum |
| mysql.page_operations | Total operation on InnoDB pages | operation | Sum |
| mysql.prepared_statements | Number of times each type of Prepared statement command got issued | command | Sum |
| mysql.row_locks | Total InnoDB row locks present | kind | Sum |
| mysql.row_operations | Total row operations executed | operation | Sum |
| mysql.sorts | Total MySQL sort execution | kind | Sum |
| mysql.table.io.wait.count | Total I/O wait events for a specific table | operation, table, schema | Sum |
| mysql.table.io.wait.time | Total wait time for I/O events for a table | operation, table,schema | Sum |
| mysql.threads | Current state of MySQL threads | kind | Sum |
| mysql.tmp_resources | Number of temporary resources created | resource | Sum |
| mysql.uptime | Number of seconds since the server has been up | none | Sum |
| mysql.client.network.io | Number of transmitted bytes between server and clients | kind | Sum |
| mysql.commands | Total number of executions for each type of command | command | Sum |
| mysql.connection.count | Total connection attempts (including successful and failed) | none | Sum |
| mysql.connection.errors | Errors occured during the connections | error | Sum |
| mysql.joins | Number of joins that performed table scans | kind | Sum |
| mysql.mysqlx_worker_threads | Number of available worker threads | kind | Sum |
| mysql.query.client.count | Number of statements executed by the server and sent by a client | none | Sum |
| mysql.query.count | Number of statements executed including the statements ran by system | none | Sum |
| mysql.query.slow.count | Number of Slow queries | none | Sum |
| mysql.replica.sql_delay | Lag in seconds for the replica compared to source | none | Sum |
| mysql.replica.time_behind_source | Delay in replication | none | Sum |
| mysql.statement_event.count | Summary of current and recent events | schema, digest, digest_text, kind | Sum |
| mysql.statement_event.wait.time | Total Wait time for the summarized timed events | schema, digest, digest_text | Sum |
| mysql.table.lock_wait.read.count | Total table lock wait read events | schema, table,kind | Sum |
| mysql.table.lock_wait.read.time | Total table lock wait time for read events | schema, table, kind | Sum |
| mysql.table.lock_wait.write.count | Total table lock wait read events | schema, table, kind | Sum |
| mysql.table.lock_wait.write.time | Total table lock wait time for write events | schema, table, kind | Sum |
| mysql.table_open_cache | Number of hits, misses or overflows for open tables cache lookups | status | Sum |
Some of the above metrics are specific to the Enterprise edition of MySQL and would not be available in this exercise.
Conclusion
In this tutorial, you configured an OpenTelemetry collector to fetch metrics from the MySQL database and visualize them using SigNoz Cloud. You also learned about the variety of MySQL metrics that are available for monitoring.
Visit our complete guide on OpenTelemetry Collector to learn more about it. OpenTelemetry is quietly becoming the world standard for open-source observability, and by using it, you can have advantages like a single standard for all telemetry signals, no vendor lock-in, etc.
SigNoz is an open-source OpenTelemetry-native APM that can be used as a single backend for all your observability needs.
Further Reading
Complete Guide on OpenTelemetry Collector
