Full-Circle Observability: Using SigNoz to monitor a LangChain agent that queries SigNoz MCP
In Part 1 of this series, we explored how to instrument a LangChain trip planner agent with OpenTelemetry and send telemetry data to SigNoz. By tracing each step of the planning process: LLM reasoning, tool calls for flights, hotels, weather, and activities, and the final itinerary response, we saw how observability turns a black-box agent workflow into a transparent, debuggable system.
That foundation gave us insights into latency hotspots, tool failures, and agent reasoning loops which are all critical for ensuring a reliable user experience in production AI apps.
In this second part, we’ll take observability a step further by introducing MCP (Model Context Protocol) servers into the mix. Specifically, we’ll look at a LangChain agent integrated with a SigNoz MCP server, which allows the agent to directly query logs, metrics, and traces from a connected SigNoz instance.
This means that instead of just sending observability data to SigNoz, the agent itself can consume and reason over observability data in real time.
We’ll walk through how to set up a SigNoz MCP agent with LangChain, instrument it with OpenTelemetry, and explore the kinds of insights it can surface when observability data becomes part of the agent’s context.
Building the Example App: A LangChain SigNoz MCP Agent
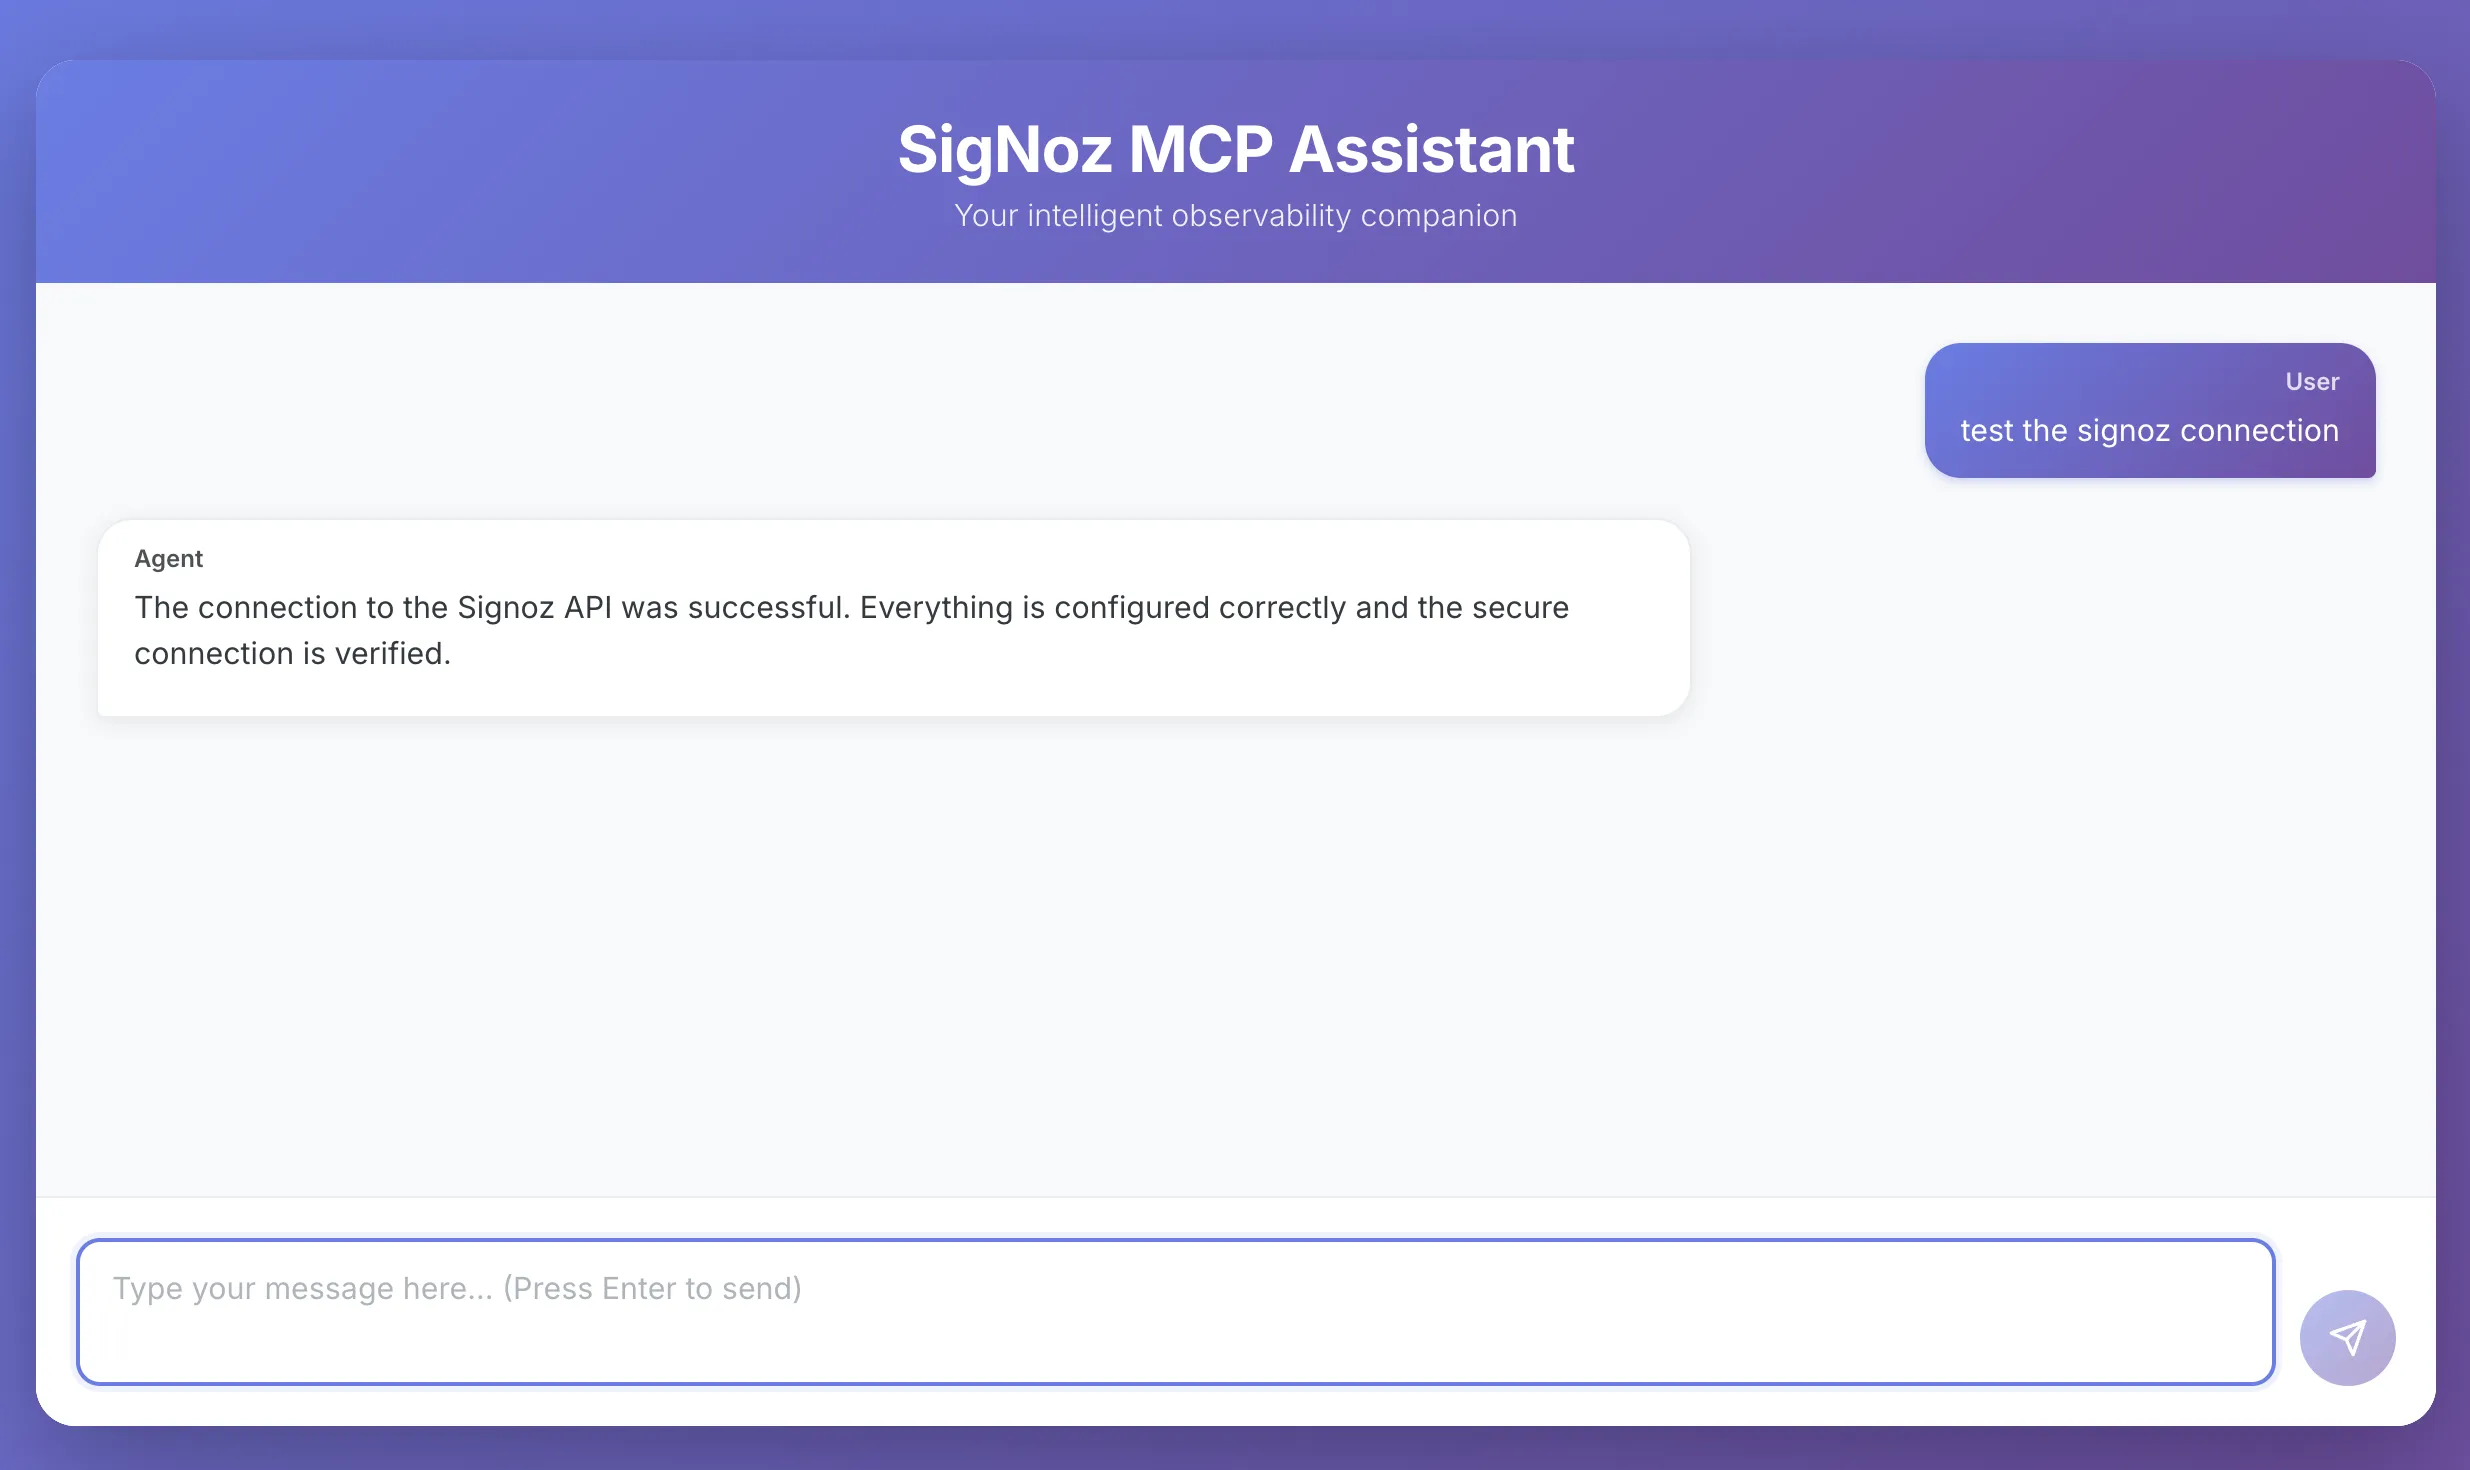
In this part, we’ll demonstrate a LangChain agent that integrates with a SigNoz MCP (Model Context Protocol) server. The goal of this app is to make observability data: logs, metrics, and traces queryable through natural language.
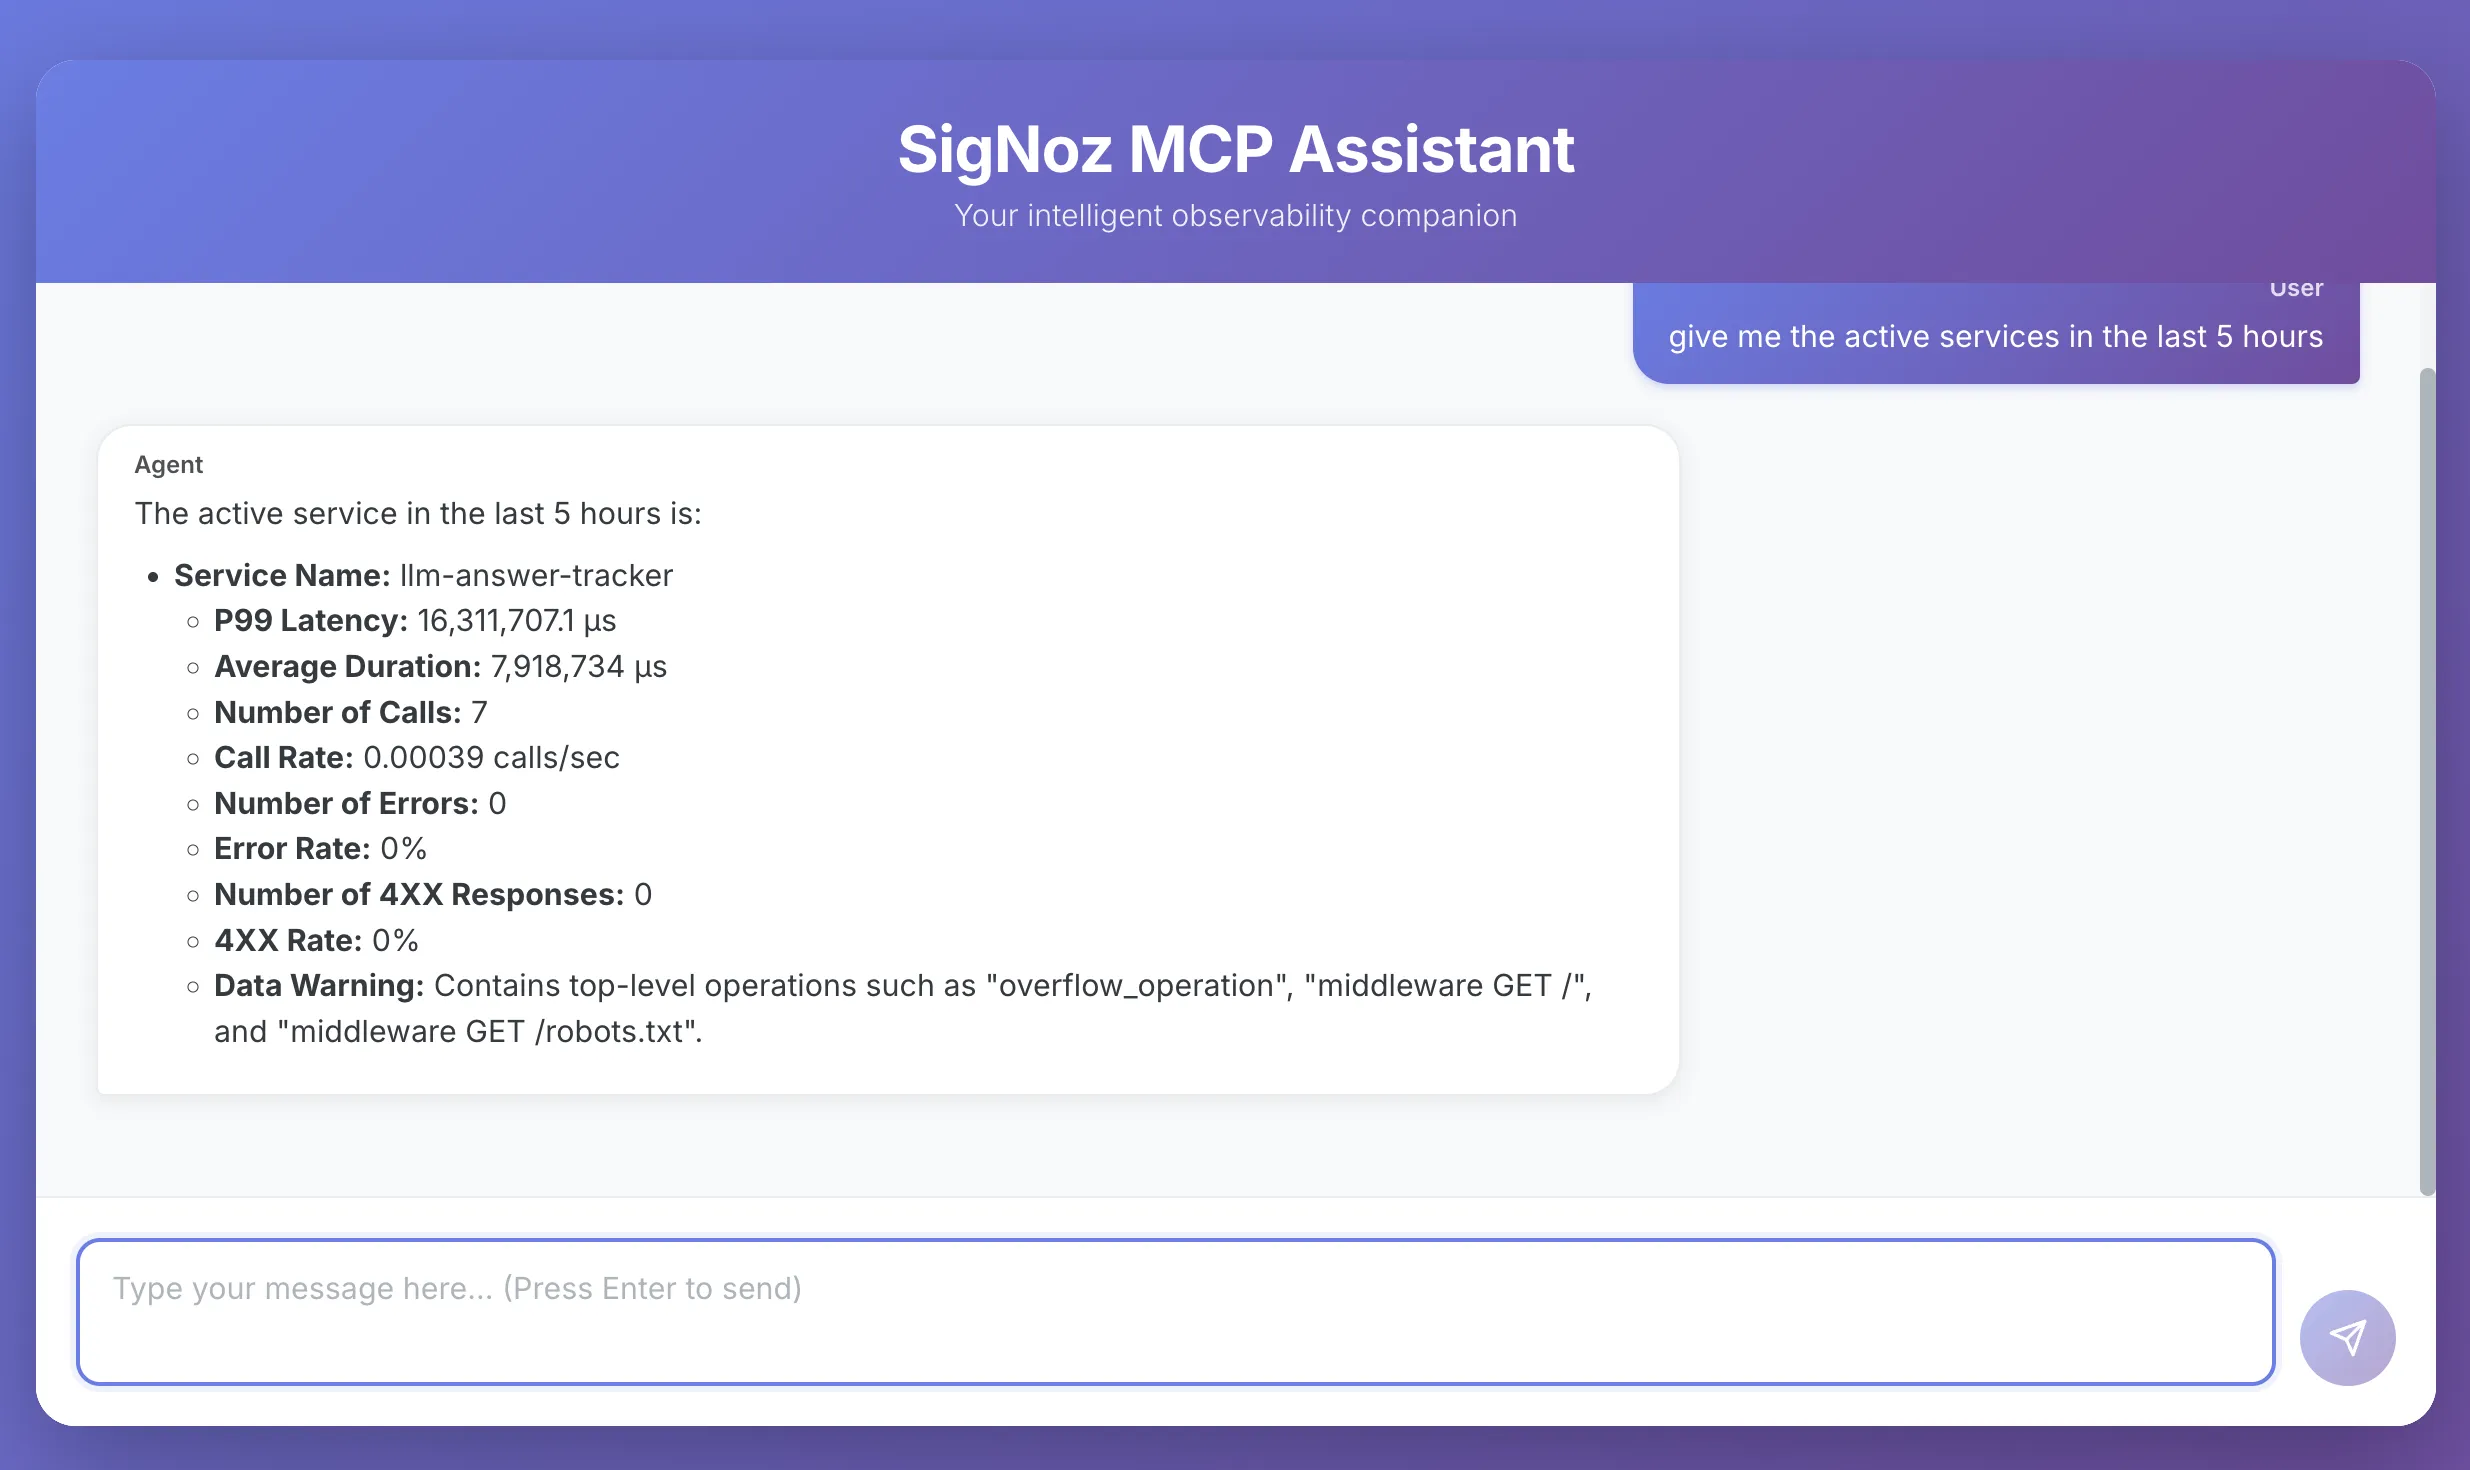
Users can interact with the agent just like a chatbot, asking operational and performance-related questions such as:
- “What are all the active services in the last 5 hours”
- “Which service has the highest error rate this week?”
- “Show me the logs generated in the last 1 hour.”
Behind the scenes, the LangChain agent communicates with the SigNoz MCP server, which exposes endpoints for querying observability data. The agent decides which endpoint to call (logs, metrics, or traces), retrieves the relevant data, and then uses the LLM to generate a clear, human-readable summary for the user.
All of this activity is itself instrumented with OpenTelemetry. Each agent reasoning step, MCP server call, and final response generation is captured as spans and sent to SigNoz.
Try the SigNoz MCP Agent Yourself
Want to explore the LangChain SigNoz MCP Agent in action? Clone the repo, install dependencies, and follow the setup steps in the README to connect the agent with your own SigNoz instance.
git clone https://github.com/SigNoz/signoz-mcp-demo.git
After cloning the repo, you can run the agent locally and start asking natural language questions about your observability data—logs, metrics, and traces—from SigNoz.
The README provides step-by-step guidance for configuring the MCP server connection and running the demo.
Making Sense of Your Telemetry Data
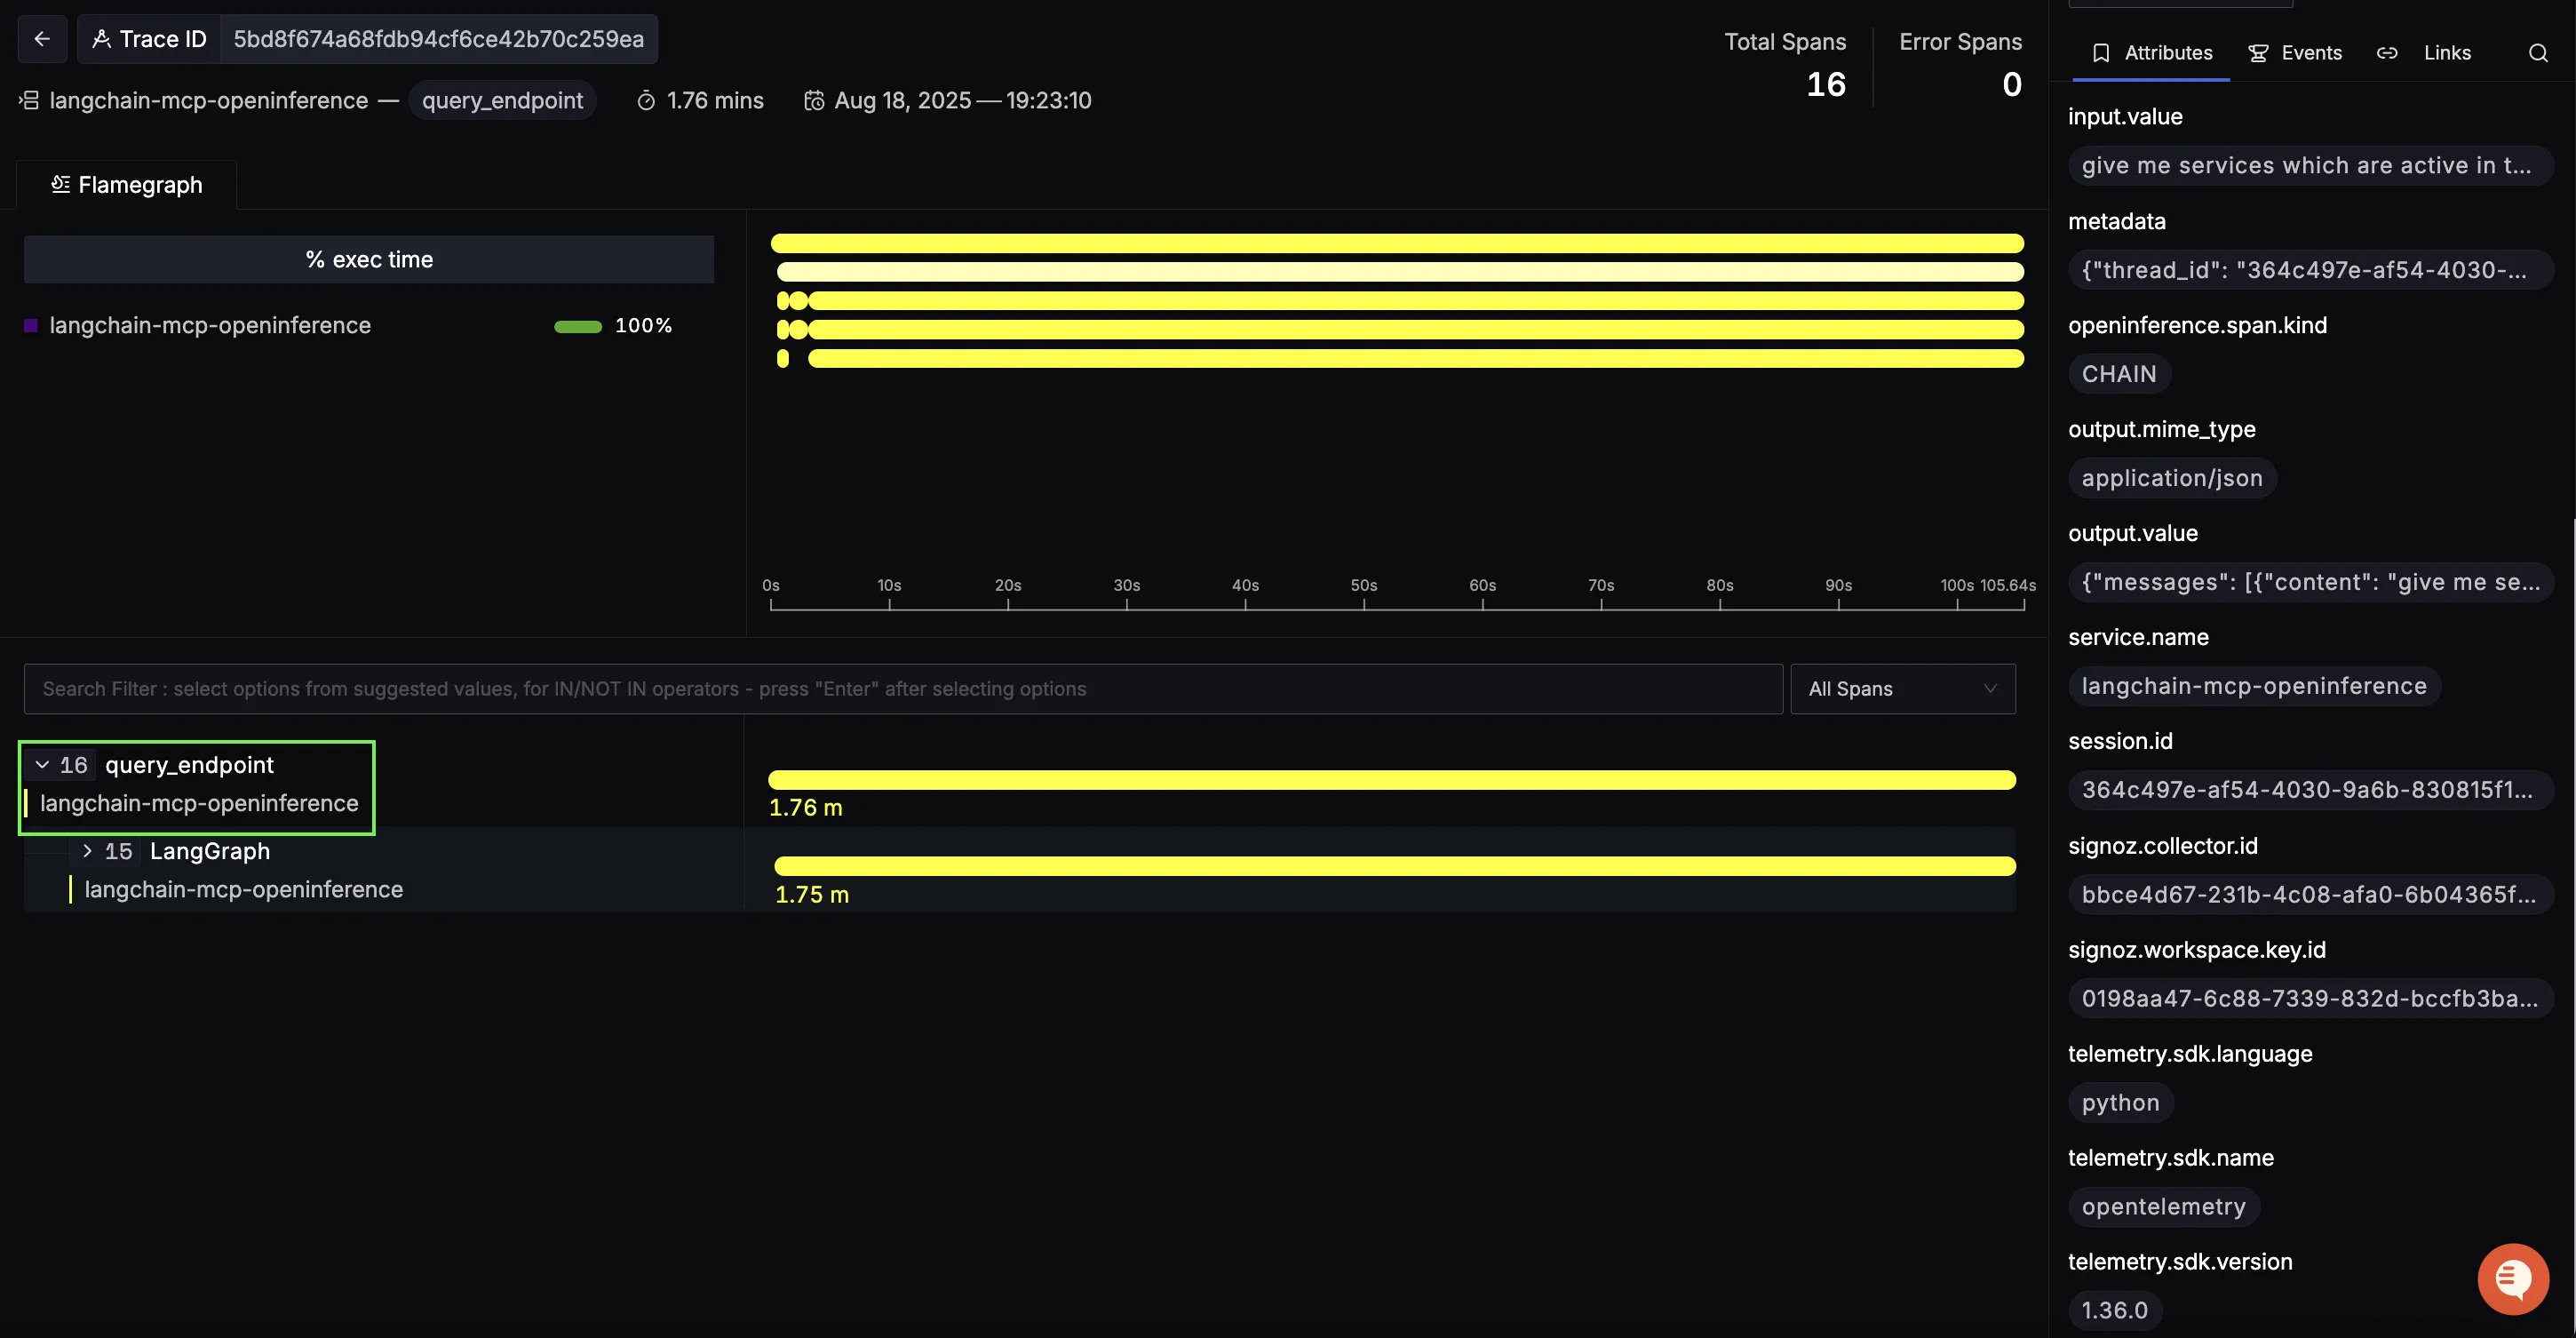
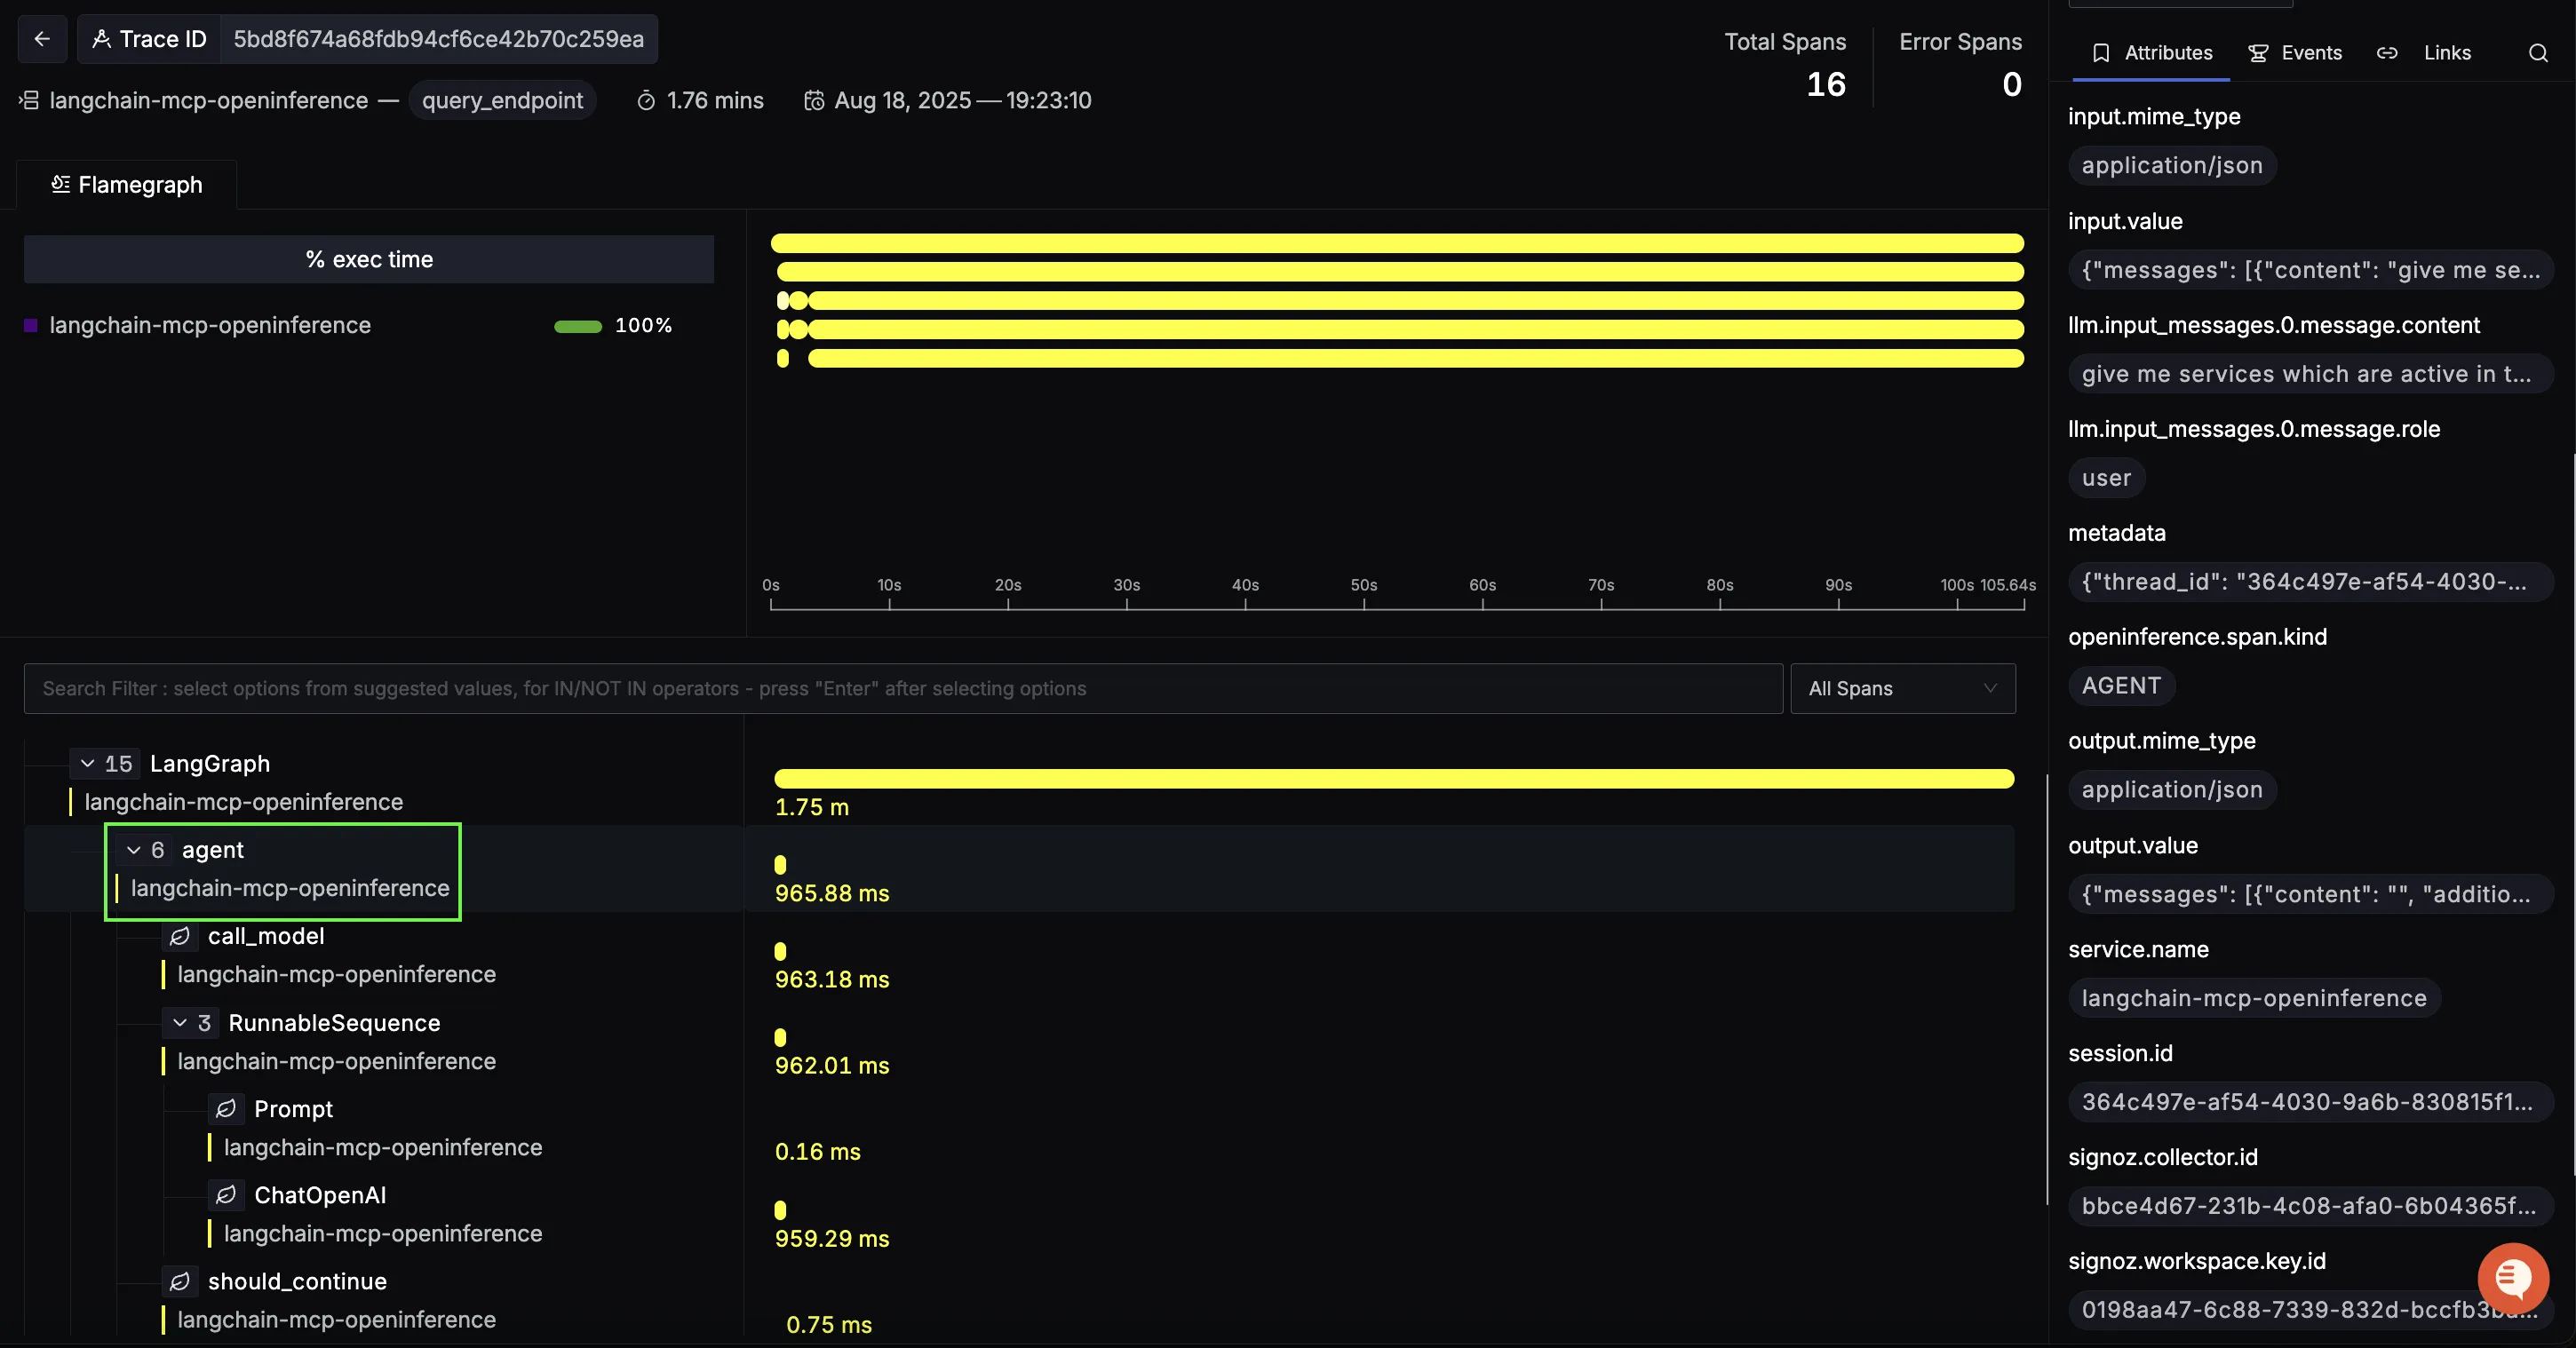
Once telemetry is enabled for the SigNoz MCP agent, traces clearly show how a user request flows through LangGraph, the agent’s reasoning, the MCP tool invocation, and the final response assembly. In a typical run, you’ll see this shape:
query_endpoint (root span)
This top-level span represents the entire MCP query lifecycle from the user’s natural-language prompt to the final summarized answer. It’s your single place to track end-to-end latency for an observability question, containing the LangGraph from our previous blog.
Use the right-hand attributes to confirm request metadata and inspect the input/output payloads that kicked off the flow.
Initial Agent span (planning & tool selection)
Nested under the root is the first agent span. Here the LLM interprets the user’s question and decides which MCP capability to call (logs, metrics, or traces). In your example, the chain shows:
call_model → RunnableSequence → ChatOpenAI → should_continue
This span’s duration is a good proxy for prompt complexity and reasoning cost before any external call happens.
What to look for:
- Long initial agent spans can indicate heavy prompts or unnecessary loops.
- Inputs/outputs show the exact messages the model which is great for debugging misinterpretations.
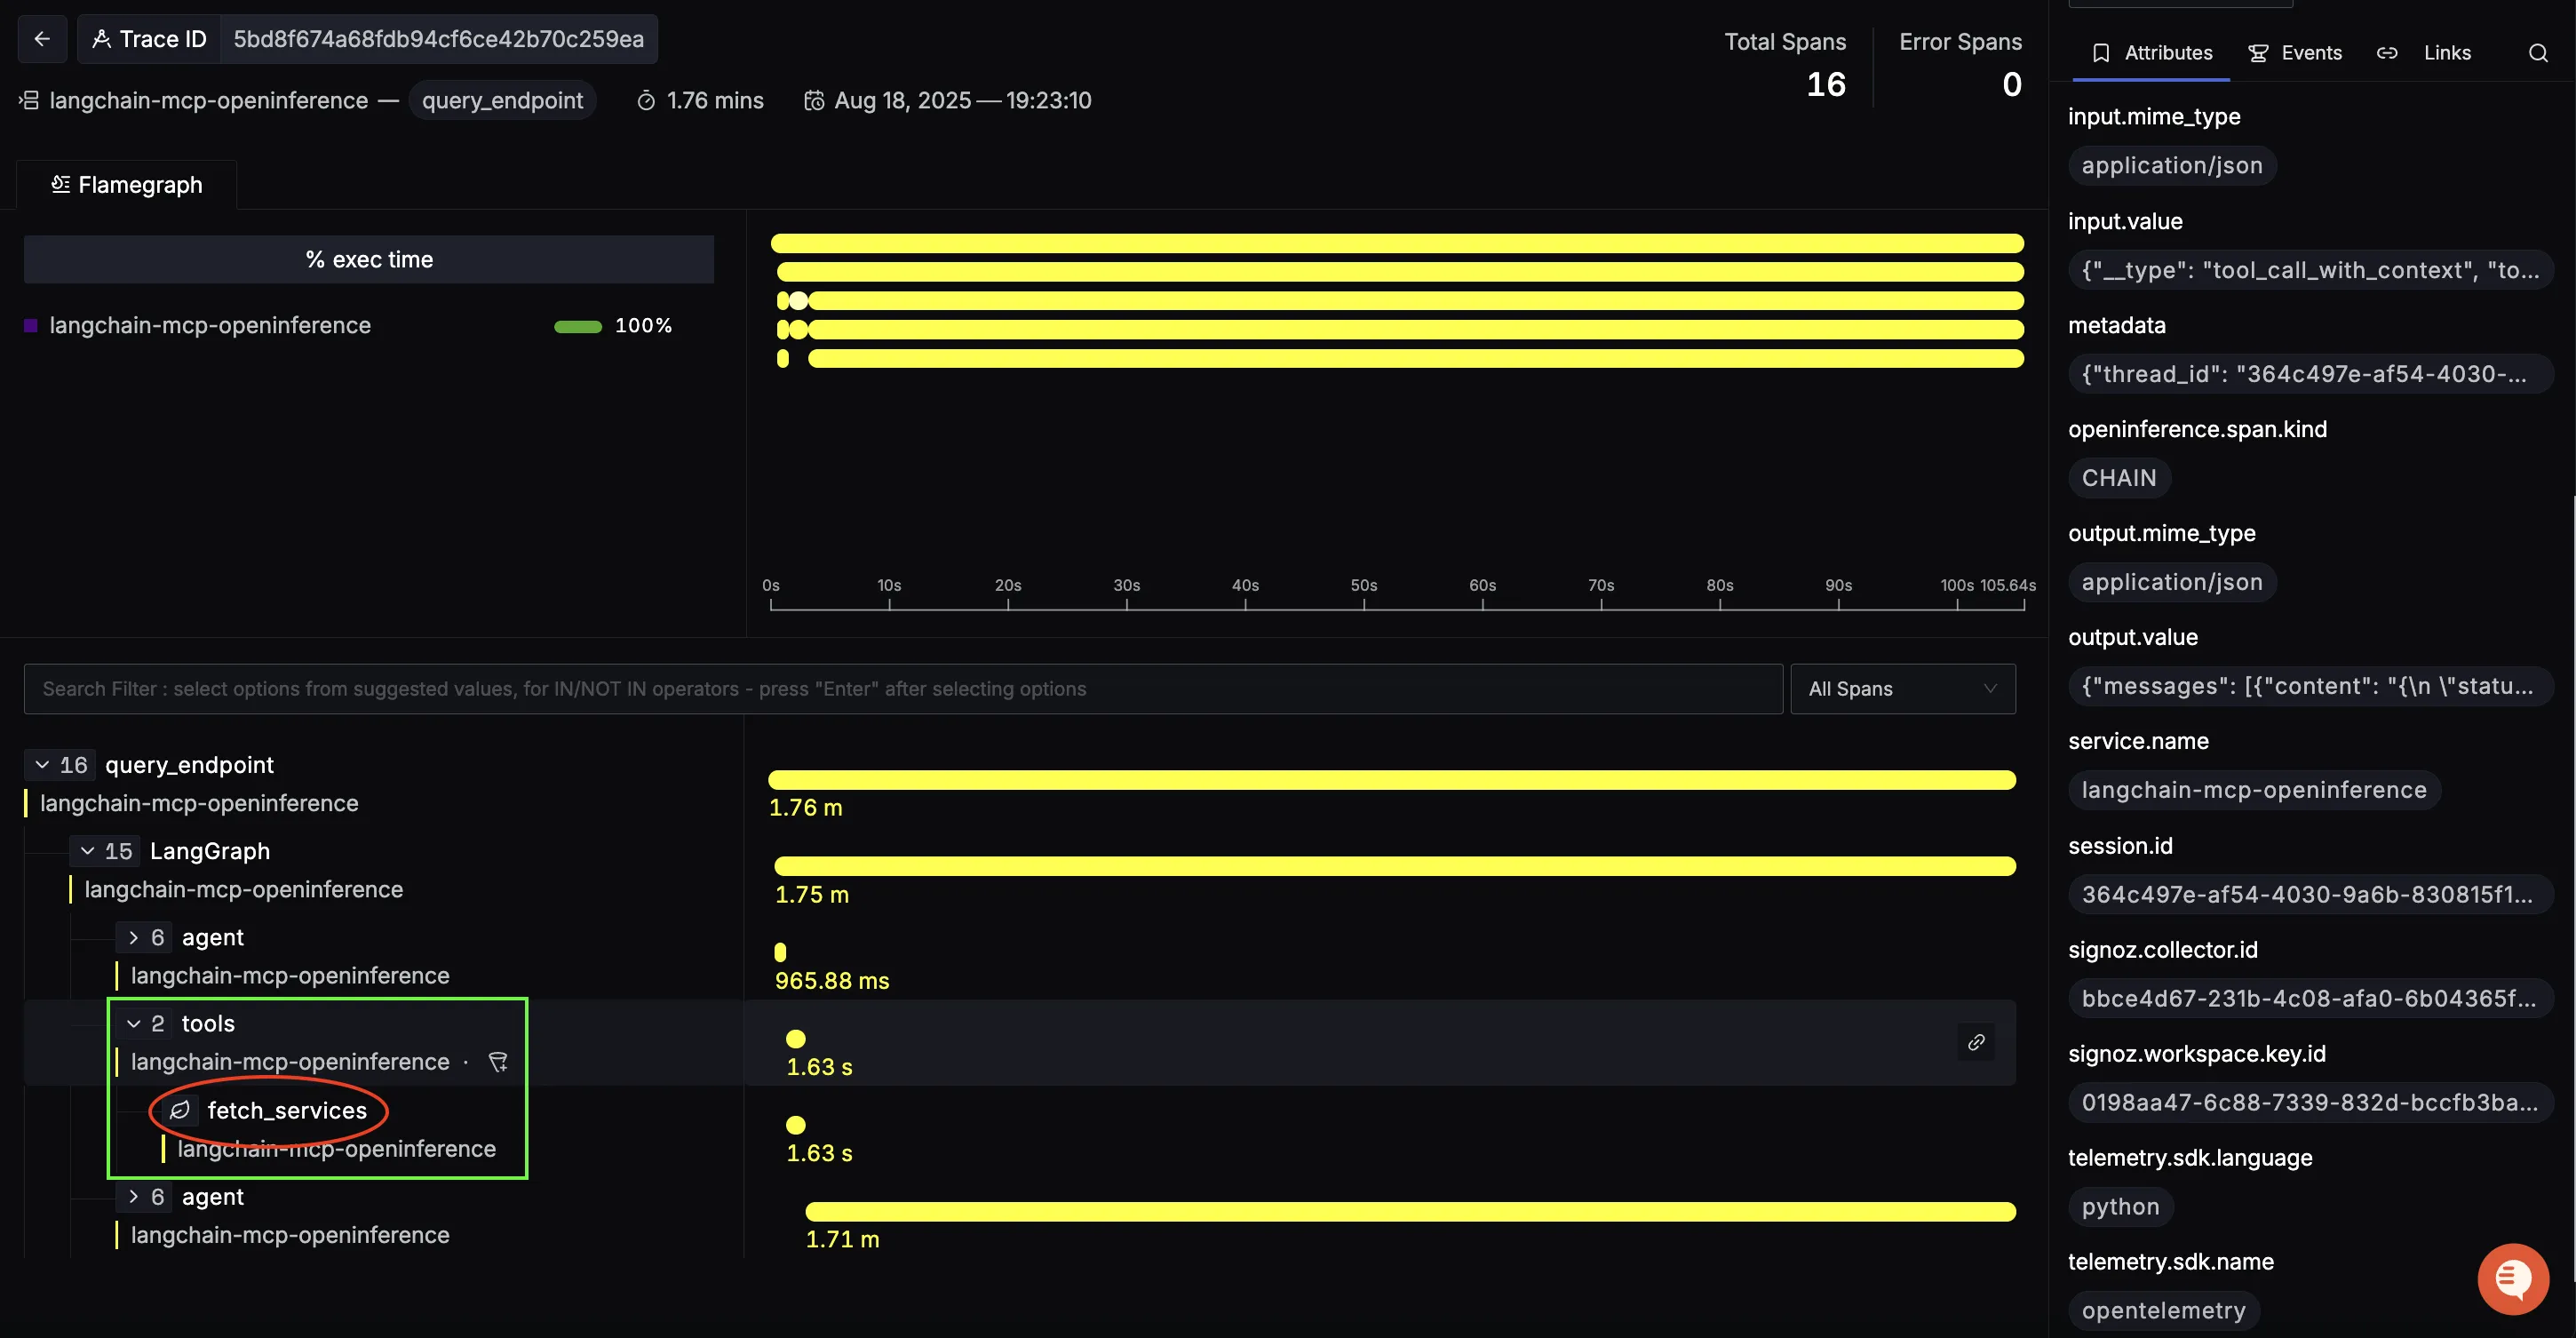
MCP tool span (data retrieval from SigNoz)
Next comes the MCP tool call. For example, a fetch_services operation hitting the SigNoz MCP server to retrieve services, metrics, logs, or traces. This is the place to diagnose backend/query latency and payload size issues.
Closing Agent span (reasoning & final answer)
After the tool response, the closing agent span composes the final answer: it parses MCP results, filters/sorts/aggregates as needed, and generates a clean natural-language summary.
What to look for:
- Long closing spans usually mean large MCP payloads being summarized (token pressure) or extra follow-up reasoning.
- Inspect the prompt the agent used for summarization to ensure it’s concise and grounded in the retrieved data.
Handling Errors with Full Context
Errors are inevitable in AI agents: API limits, bad tool responses, or timeouts. Without observability, it’s hard to know what failed and where.
With SigNoz, errors are tied to specific spans in the trace, so you can see:
- Which component failed (agent reasoning, tool call, or response synthesis).
- What the error was (rate limit, timeout, schema mismatch, etc.).
- When in the request it happened.
In this example, a RateLimitError from OpenAI is clearly flagged in the closing agent span. The trace shows the error message, stack trace, and context all in one place.
Instead of guessing, you know exactly what broke, where, and why, making debugging much faster and safer in production.

What you can answer with these traces:
-
Where is the latency?
Is time spent in planning (initial agent), in the MCP query (tool span), or in summarization (closing agent)?
-
Are queries efficient?
Tool spans reveal slow MCP endpoints and overly broad filters. Tighten time windows or add constraints.
-
Is the model working too hard?
Long agent spans (before or after tools) suggest prompt bloat, unnecessary loops, or passing too much raw data back to the LLM.
-
Is the workflow stable?
Use span status codes and events to spot intermittent errors (schema mismatches, token limits, provider hiccups).
With this structure, SigNoz turns the MCP-powered workflow from a black box into a fully traceable conversation: user prompt → agent planning → MCP tool call → agent summary. That visibility makes debugging faster, optimization data-driven, and your observability assistant consistently reliable.
Visualizing Data in SigNoz with Dashboards
Once your LangChain SigNoz MCP agent is instrumented with OpenTelemetry, SigNoz gives you the ability to create rich dashboards to explore emitted telemetry data. Built-in filters and span attributes make it easy to drill down into agent reasoning latency, MCP query performance, error patterns, and model usage. This provides a real-time pulse on how your observability agent itself is performing end-to-end.
Here are some insightful panels we built using the traces from our instrumented MCP workflow:
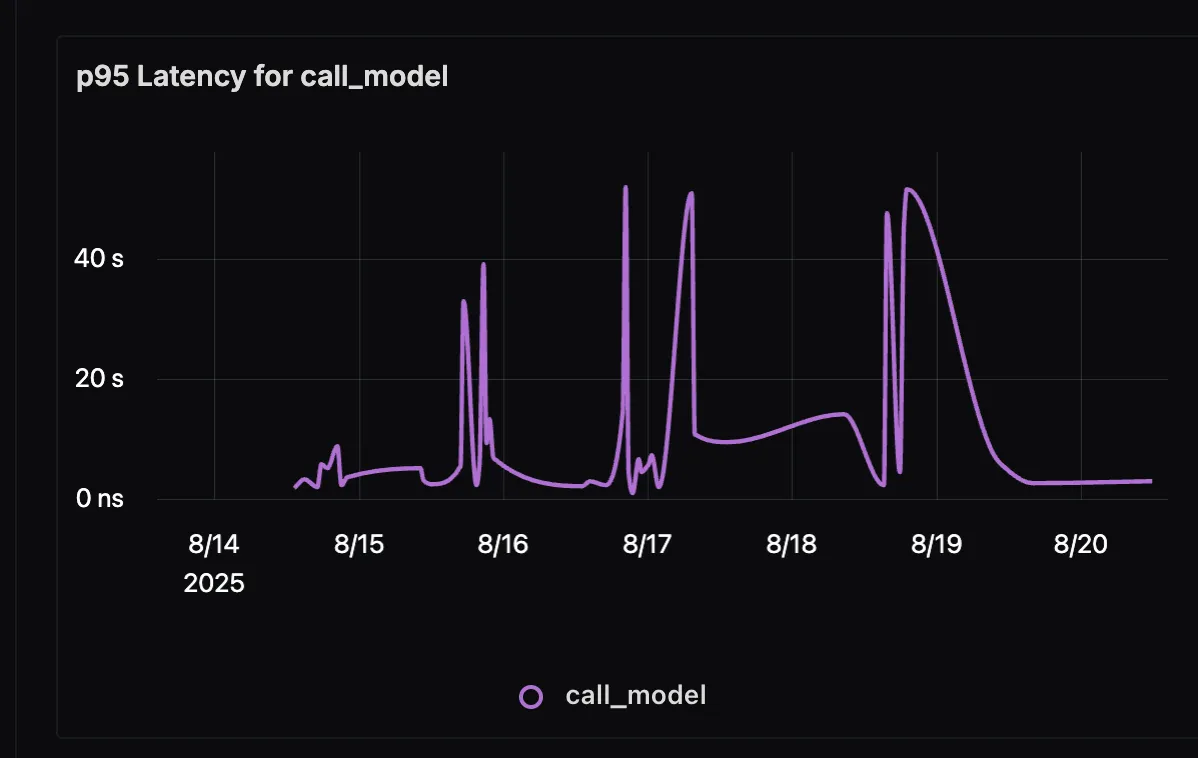
p95 Duration for Agent call_model
This panel shows the 95th percentile latency for LLM calls made by the agent. Since generation often dominates total response time, monitoring p95 latency highlights worst-case scenarios and helps you optimize prompts, reduce context size, or adjust model selection.
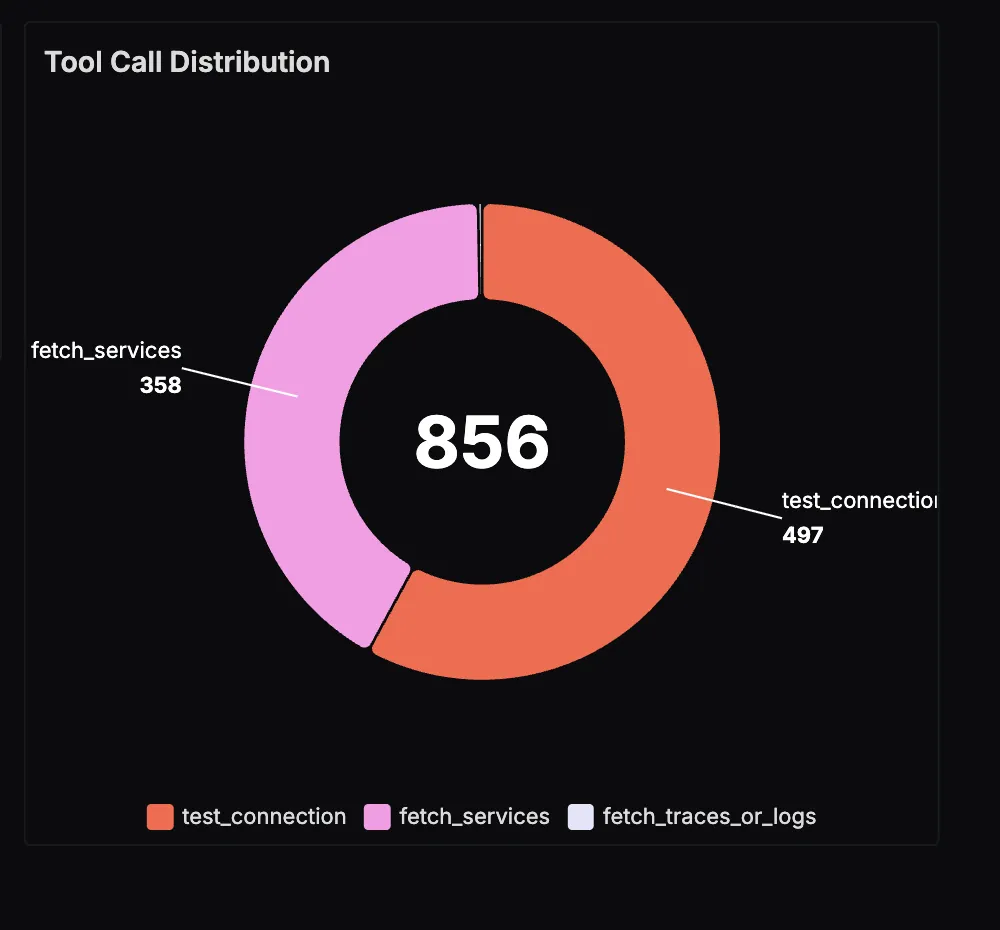
MCP Tool Call Distribution
This panel visualizes how often the agent queries different MCP endpoints: logs, metrics, or traces. It gives you a sense of workload distribution, showing whether users are primarily asking about latency, error logs, or trace investigations.
Input and Output Token Usage
This panel tracks the total number of input and output tokens processed by the LLM over time. Input tokens include user queries and MCP responses passed into the model, while output tokens are the agent’s natural language answers. Monitoring this helps manage cost and detect patterns in verbosity or context expansion.

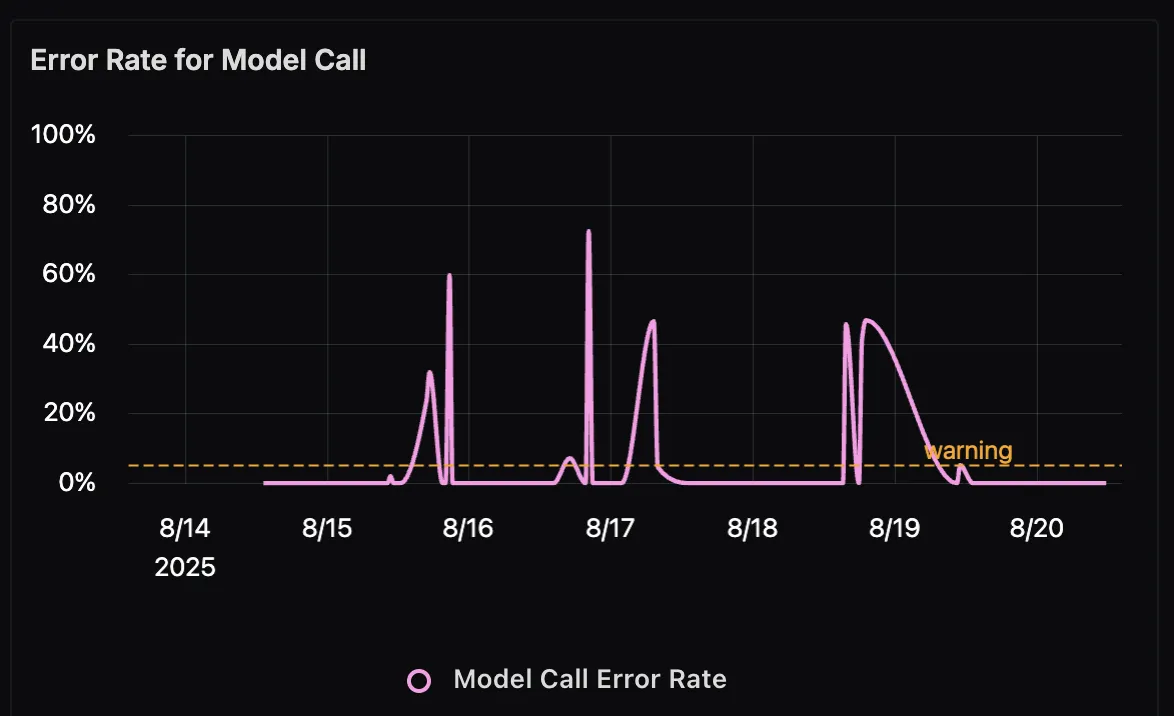
Model Call Error Rate Over Time
This panel tracks the error rate of model calls, visualized as a line chart. Spikes here may indicate upstream issues such as invalid MCP responses, token limits being exceeded, or transient API errors. By correlating these errors with traffic patterns, you can quickly pinpoint reliability issues in production.
With these dashboards in place, you can move beyond ad-hoc debugging and gain data-driven insights into your MCP agent. Whether it’s latency hotspots, slow SigNoz queries, token usage spikes, or rising error rates, SigNoz provides the observability foundation you need to ensure your AI-driven observability assistant stays reliable and responsive.
Wrapping it Up
LangChain agents integrated with MCP servers open the door to powerful new workflows, but that power comes with more moving parts: LLM calls, tool interactions, server communications, and error handling. Without the right observability, it’s easy for problems to hide in the noise.
By pairing OpenTelemetry with SigNoz, you get full visibility into the agent lifecycle: where time is spent, which tools are bottlenecks, and what errors are occurring. Whether it’s a slow external API, a looping agent, or a rate limit error, you can see exactly what happened and where.
With this clarity, debugging becomes faster, scaling becomes smoother, and users get more reliable experiences even as your agents grow more complex.
If you want a step-by-step setup guide, start with the LangChain/LangGraph observability docs and the LLM observability overview.
