How to Monitor Apache Server Metrics with OpenTelemetry
Monitoring Apache web server metrics ensures your web server performs efficiently, securely, and reliably. In this tutorial, you will configure OpenTelemetry Collector to collect Apache metrics and send them to SigNoz for monitoring and visualization.

We cover:
- What is Apache?
- What is OpenTelemetry
- What is OpenTelemetry Collector?
- How does OpenTelemetry Collector collect data?
- Collecting Apache Metrics with OpenTelemetry Collector
- Prerequisites
- Setting up SigNoz
- Setting up Apache
- Setting up OpenTelemetry Collector
- Monitoring Apache metrics with SigNoz dashboard
- Metrics and Resource Attributes for Apache supported by OpenTelemetry
- Conclusion
- Further Reading
If you want to jump straight into implementation, start with this prerequisites section.
What is Apache?
Apache HTTP Server is an open-source web server that seamlessly delivers web pages to clients across the globe over the internet. It accepts HTTP requests from clients and responds back to them with the requested information in the form of web pages.
Apache's core function is the delivery of static web pages, but its capabilities extend far beyond this. Through the incorporation of modules, Apache can effortlessly handle dynamic content. Some of the most widely used modules include SSL for establishing secure connections, Server-Side Programming Support (such as PHP) for dynamic content generation, and load-balancing configurations to ensure optimal performance under heavy traffic.
What is OpenTelemetry
OpenTelemetry is a set of APIs, SDKs, libraries, and integrations aiming to standardize the generation, collection, and management of telemetry data(logs, metrics, and traces). It is backed by the Cloud Native Computing Foundation and is the leading open-source project in the observability domain.
The data you collect with OpenTelemetry is vendor-agnostic and can be exported in many formats. Telemetry data has become critical in observing the state of distributed systems. With microservices and polyglot architectures, there was a need to have a global standard. OpenTelemetry aims to fill that space and is doing a great job at it thus far.
What is OpenTelemetry Collector?
OpenTelemetry Collector is a stand-alone service provided by OpenTelemetry. It can be used as a telemetry-processing system with a lot of flexible configurations that gather and process observability data, such as traces, metrics, and logs, from different parts of a software system. It then sends this data to chosen destinations, allowing for centralized analysis and monitoring. The collector simplifies the task of collecting and exporting telemetry data in cloud-native environments.
How does OpenTelemetry Collector collect data?
Data collection in OpenTelemetry Collector is facilitated through receivers. Receivers are configured via YAML under the top-level receivers tag. To ensure a valid configuration, at least one receiver must be enabled.
Below is an example of an otlp receiver:
receivers:
  otlp:
    protocols:
      grpc:
      http:
The OTLP receiver accepts data through gRPC or HTTP in the OTLP format. There are advanced configurations that you can enable via the YAML file.
Here’s a sample configuration for an otlp receiver:
receivers:
  otlp:
    protocols:
      http:
        endpoint: "localhost:4318"
        cors:
          allowed_origins:
            - http://test.com
            # Origins can have wildcards with *, use * by itself to match any origin.
            - https://*.example.com
          allowed_headers:
            - Example-Header
          max_age: 7200
You can find more details on advanced configurations here.
Once a receiver is configured, it needs to be enabled to start the data flow. This involves setting up pipelines within a service. A pipeline acts as a streamlined pathway for data, outlining how it should be processed and where it should go. A pipeline comprises of the following:
- Receivers: These are entry points for data into the OpenTelemetry Collector, responsible for collecting data from various sources and feeding it into the pipeline.
- Processors: After data is received, processors manipulate, filter, or enhance the data as needed before it proceeds further in the pipeline. They provide a way to customize the data according to specific requirements.
- Exporters: After processing, the data is ready for export. Exporters define the destination for the data, whether it's an external monitoring system, storage, or another service. They format the data appropriately for the chosen output.
Below is an example pipeline configuration:
service:
  pipelines:
    metrics:
      receivers: [otlp, prometheus]
			processors: [batch]
      exporters: [otlp, prometheus]
Here’s a breakdown of the above metrics pipeline:
- Receivers: This pipeline is configured to receive metrics data from two sources: OTLP and Prometheus. The
otlpreceiver collects metrics using both gRPC and HTTP protocols, while theprometheusreceiver gathers metrics from Prometheus. - Processors: Metrics data is processed using the
batchprocessor. This processor likely batches metrics before exporting them, optimizing the data flow. - Exporters: Metrics processed through this pipeline are exported to both OTLP and Prometheus destinations. The
otlpexporter sends data to an endpoint specified in the configuration, and theprometheusexporter handles the export of metrics to a Prometheus-compatible destination.
Collecting Apache Metrics with OpenTelemetry Collector
In this section, you will learn how Apache metrics can be collected with the OpenTelemetry Collector and how to visualize the collected metrics in SigNoz.
Prerequisites
- Apache Installed
- A SigNoz cloud account
For Mac users, Apache comes preinstalled
Setting up SigNoz
You need a backend to which you can send the collected data for monitoring and visualization. SigNoz is an OpenTelemetry-native APM that is well-suited for visualizing OpenTelemetry data.
SigNoz cloud is the easiest way to run SigNoz. You can sign up here for a free account and get 30 days of unlimited access to all features.
You can also install and self-host SigNoz yourself. Check out the docs for installing self-host SigNoz.
Setting up Apache
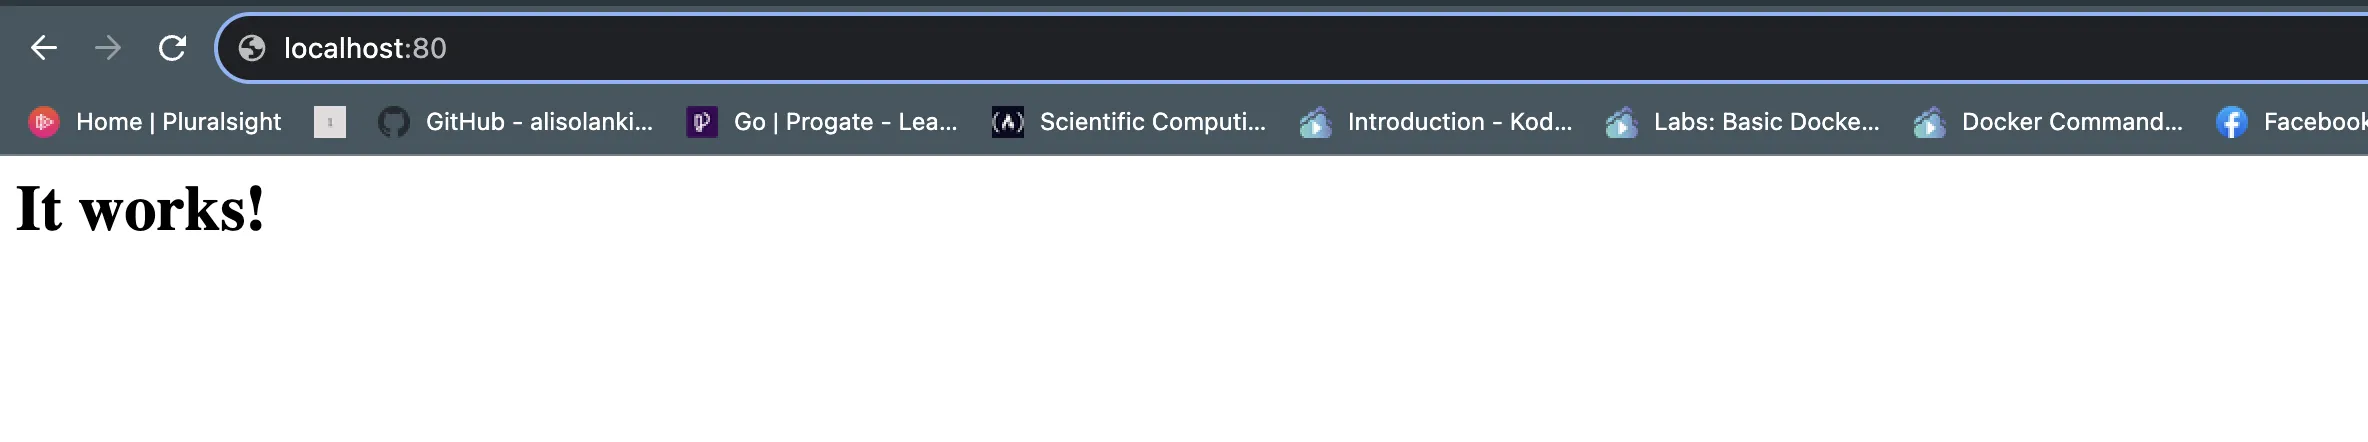
Once you have installed the Apache web server, confirm it is running on the assigned port:
Since Apache will be monitored, it has to be configured to expose its metrics. The endpoint at which Apache exposes metrics is http://localhost/server-status?auto.
To expose the metrics, open the Apache configuration file for editing, depending on the environment you are in.
For mac:
sudo nano /etc/apache2/httpd.confVerify that the below config line is enabled and not commented out
LoadModule status_module lib/httpd/modules/mod_status.so
The mod_status module is an Apache module that provides a web-based view of server statistics, including information about server performance, current connections, and other relevant details. When enabled, it creates a web page accessible through a browser that displays real-time information about the Apache server's status. It's a useful tool for monitoring and troubleshooting server performance.
Scroll to the end of the file and paste the below
<Location "/server-status">
    SetHandler server-status
    Require host example.com
</Location>
This configuration block enables the /server-status endpoint, and it can only be accessed from the localhost. This is a security measure to ensure that sensitive server status information is not exposed to the public internet. This is where Apache’s server statistics will be displayed.
Replace example.com with the correct domain name where you have Apache running. For instance, if you have Apache running on localhost, it will be as below:
<Location "/server-status">
    SetHandler server-status
    Require host localhost
</Location>
Check for syntax errors
sudo apachectl configtestRestart the server to apply changes
sudo apachectl restart
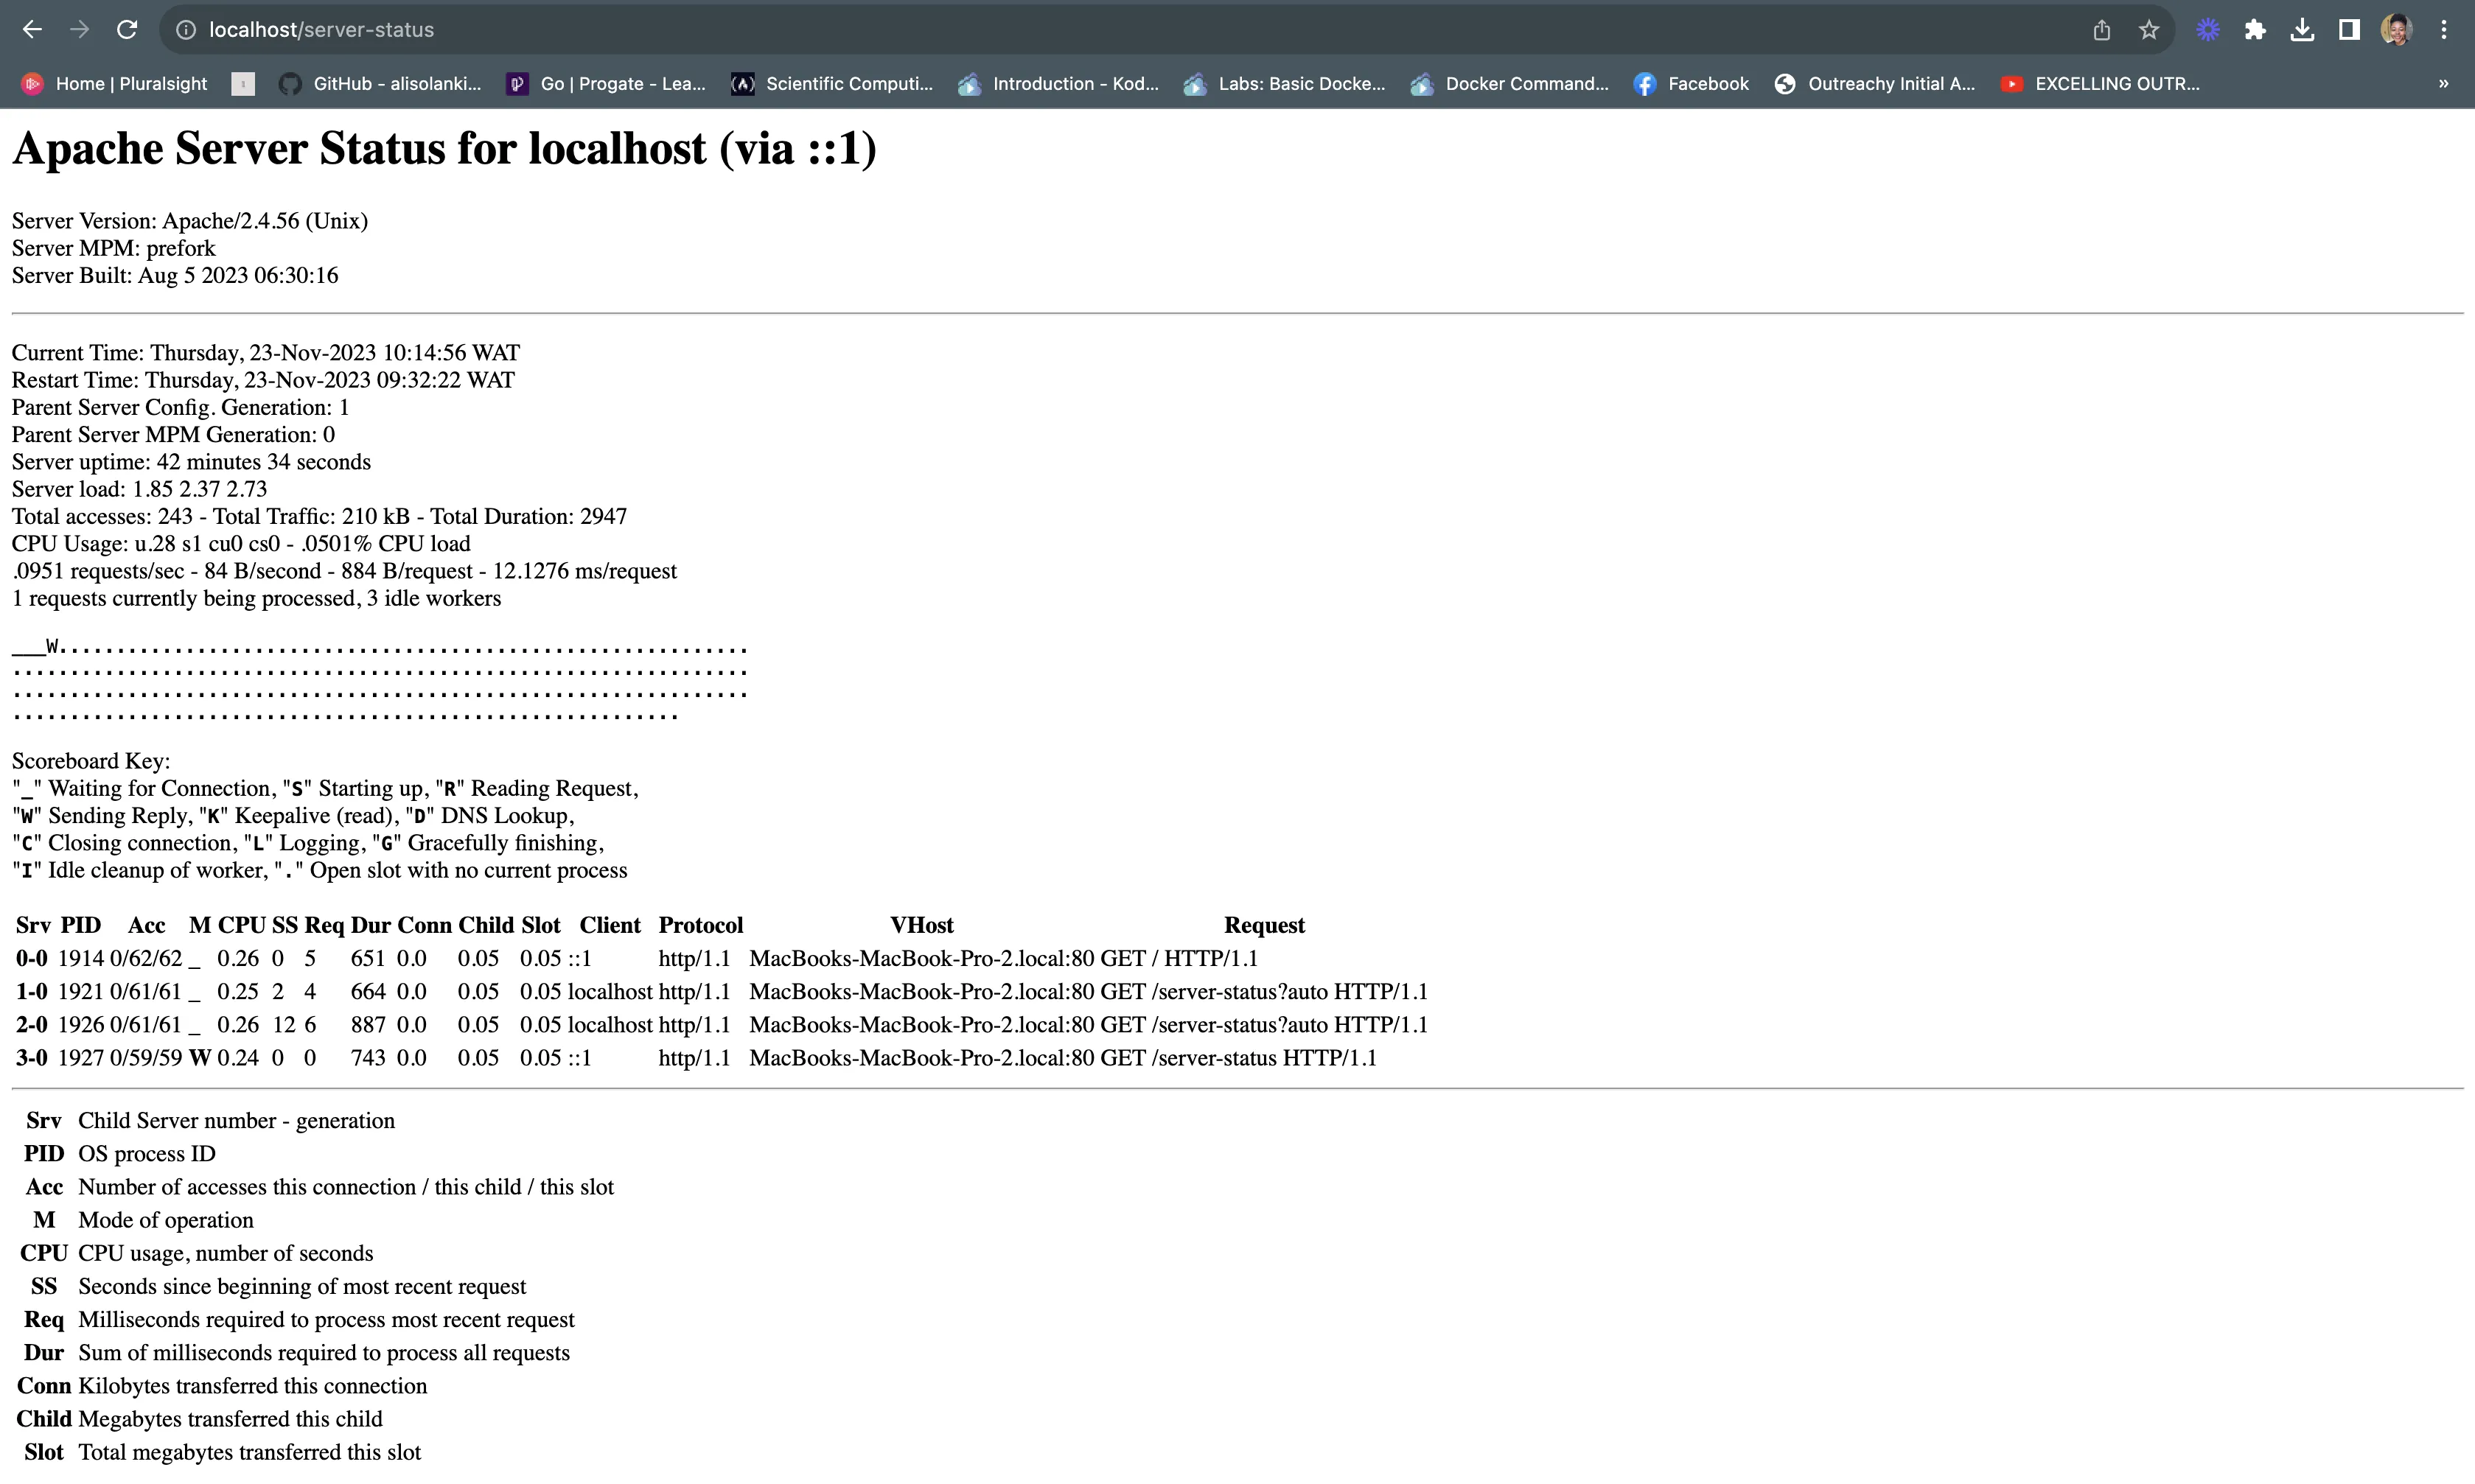
To view Apache server statistics in your browser, navigate to the domain where Apache is running and add the "/server-status" endpoint to the URL. In this example, since Apache is running on localhost, you can access the statistics by visiting http://localhost/server-status in your browser.
Setting up OpenTelemetry Collector
The OpenTelemetry Collector offers various deployment options to suit different environments and preferences. It can be deployed using Docker, Kubernetes, Nomad, or directly on Linux systems. You can find all the installation options here. For the purpose of this article, the OpenTelemetry Collector will be installed manually.
Download the OpenTelemetry Collector
Download the appropriate binary package for your Linux or macOS distribution from the OpenTelemetry Collector releases page. We are using the latest version available at the time of writing this tutorial.
curl --proto '=https' --tlsv1.2 -fOL https://github.com/open-telemetry/opentelemetry-collector-releases/releases/download/v0.89.0/otelcol-contrib_0.89.0_darwin_arm64.tar.gz
For macOS users, download the binary package specific to your system.
| Build | Architecture |
|---|---|
| M1 Chip | arm64 |
| Intel | amd64 (x86-64) |
Extract the package
Create a new directory named otelcol-contrib and then extract the contents of the otelcol-contrib_0.89.0_darwin_arm64.tar.gz archive into this newly created directory with the following command:
mkdir otelcol-contrib && cd otelcol-contrib
Extract the contents of the binary package in that directory:
tar xvzf otelcol-contrib_0.89.0_darwin_arm64.tar.gz -C otelcol-contrib
Set up the Configuration file
In the same otelcol-contrib directory, create a config.yaml file:
touch config.yaml
Paste the below config into the file:
receivers:
  otlp:
    protocols:
      grpc: {}
      http: {}
  apache:
    endpoint: "http://localhost:80/server-status?auto"
    collection_interval: 10s

processors:
  batch:
    send_batch_size: 1000
    timeout: 10s

exporters:
  otlp:
    endpoint: "ingest.{region}.signoz.cloud:443"
    tls:
      insecure: false
    timeout: 20s # Adjust the timeout value as needed
    headers:
      "signoz-ingestion-key": "<SIGNOZ_INGESTION_KEY>"
  logging:
    verbosity: detailed

service:
  telemetry:
    metrics:
      address: localhost:8888
  pipelines:
    metrics:
      receivers: [otlp, apache]
      processors: [batch]
      exporters: [otlp]
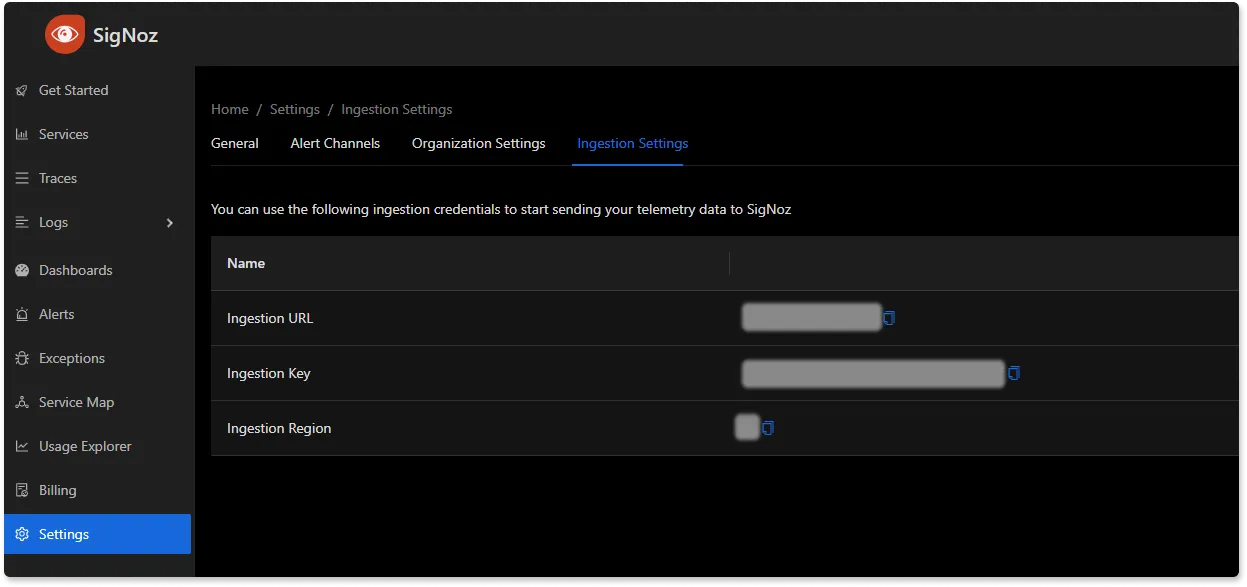
Replace http://localhost:80 with the correct endpoint where you have Apache running. Also, replace {region} with the region for your SigNoz cloud account and <SIGNOZ_INGESTION_KEY> with the ingestion key for your account. You can find these settings in the SigNoz dashboard under Settings > Ingestion Settings.
You can find more information on OpenTelemetry Apache receiver here.
Run the collector service
In the same otelcol-contrib directory, run the below command to start the collector service:
./otelcol-contrib --config ./config.yaml
You should receive a similar output to show it has started successfully:
2023-11-23T14:30:58.999+0100    info    service@v0.89.0/telemetry.go:85     Setting up own telemetry...
2023-11-23T14:30:59.000+0100    info    service@v0.89.0/telemetry.go:202    Serving Prometheus metrics      {"address": "localhost:8888", "level": "Basic"}
2023-11-23T14:30:59.000+0100    info    service@v0.89.0/service.go:143      Starting otelcol-contrib...     {"Version": "0.89.0", "NumCPU": 8}
2023-11-23T14:30:59.000+0100    info    extensions/extensions.go:34         Starting extensions...
2023-11-23T14:30:59.001+0100    warn    internal@v0.89.0/warning.go:40      Using the 0.0.0.0 address exposes this server to every network interface, which may facilitate Denial of Service attacks      {"kind": "receiver", "name": "otlp", "data_type": "metrics", "documentation": "https://github.com/open-telemetry/opentelemetry-collector/blob/main/docs/security-best-practices.md#safeguards-against-denial-of-service-attacks"}
2023-11-23T14:30:59.001+0100    info    otlpreceiver@v0.89.0/otlp.go:83     Starting GRPC server    {"kind": "receiver", "name": "otlp", "data_type": "metrics", "endpoint": "0.0.0.0:4317"}
2023-11-23T14:30:59.002+0100    warn    internal@v0.89.0/warning.go:40      Using the 0.0.0.0 address exposes this server to every network interface, which may facilitate Denial of Service attacks      {"kind": "receiver", "name": "otlp", "data_type": "metrics", "documentation": "https://github.com/open-telemetry/opentelemetry-collector/blob/main/docs/security-best-practices.md#safeguards-against-denial-of-service-attacks"}
2023-11-23T14:30:59.002+0100    info    otlpreceiver@v0.89.0/otlp.go:101    Starting HTTP server    {"kind": "receiver", "name": "otlp", "data_type": "metrics", "endpoint": "0.0.0.0:4318"}
2023-11-23T14:30:59.002+0100    info    service@v0.89.0/service.go:169      Everything is ready. Begin running and processing data.
Monitoring Apache metrics with SigNoz dashboard
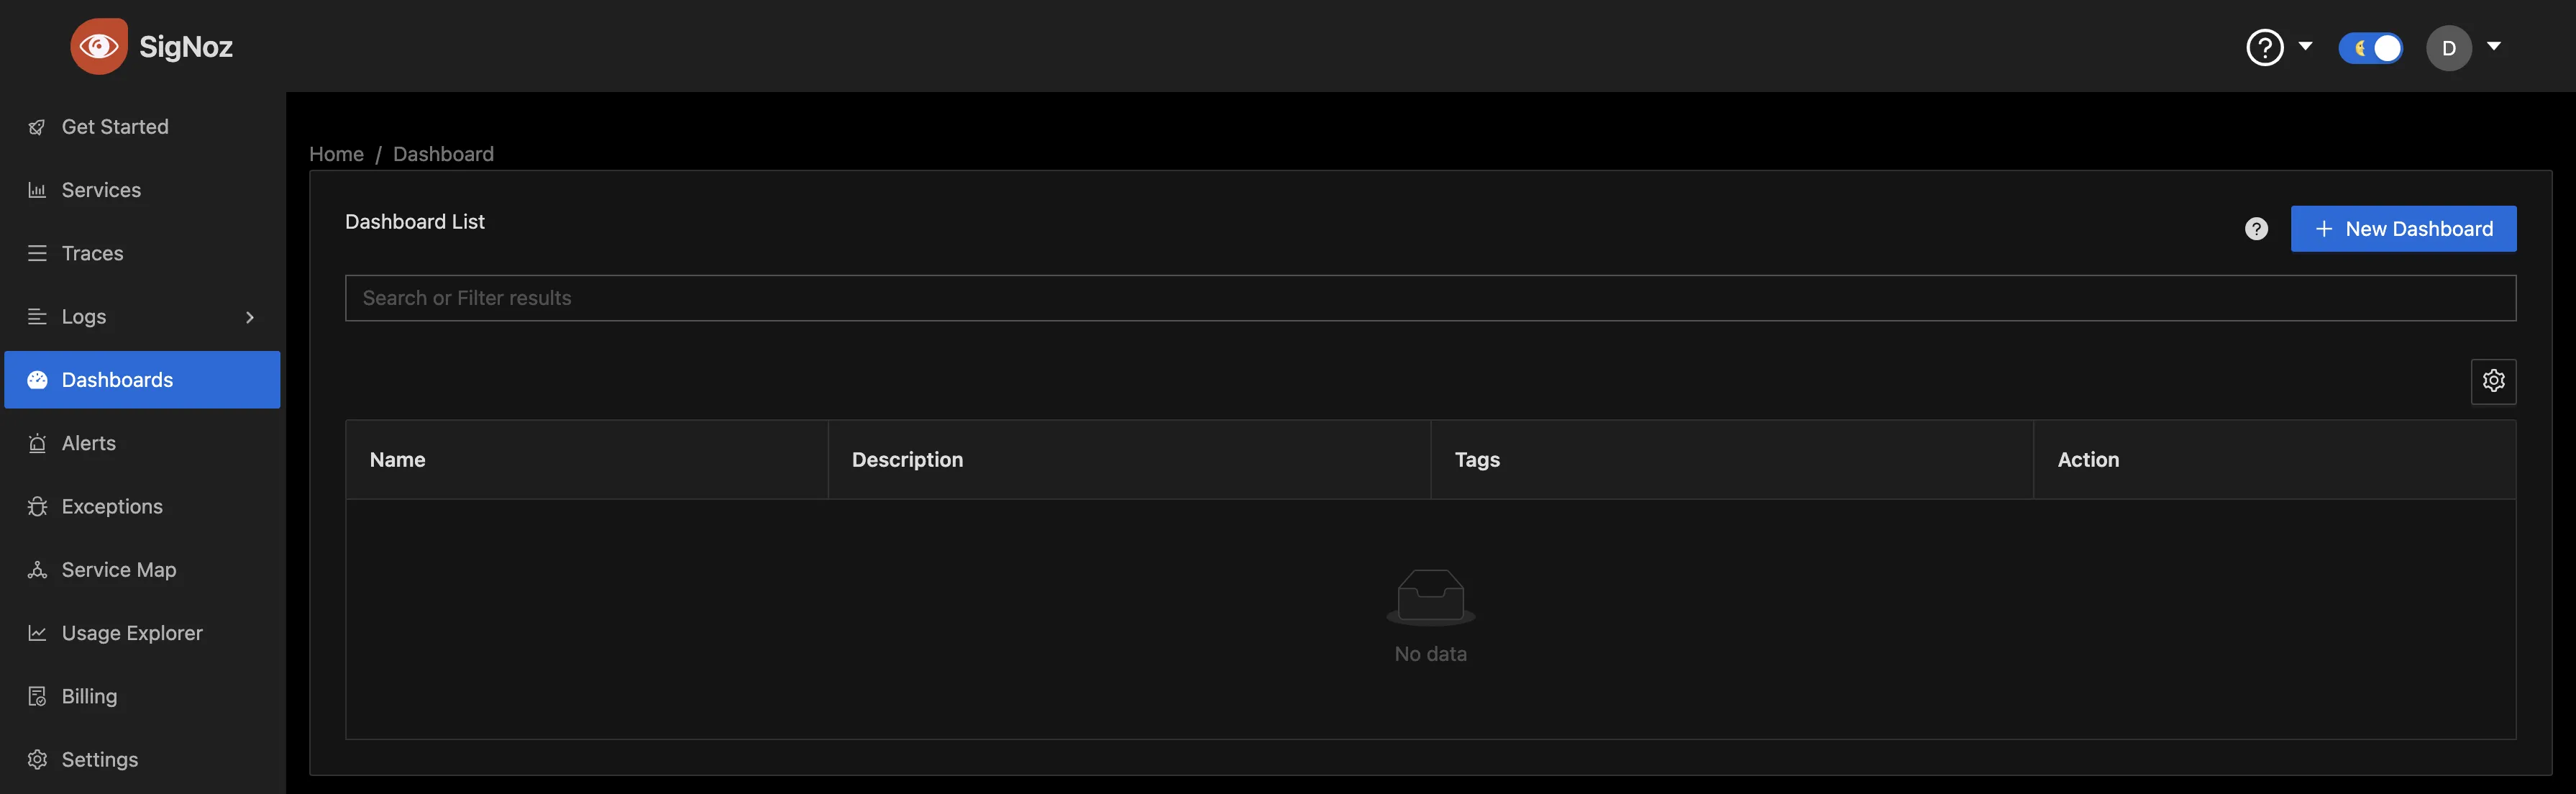
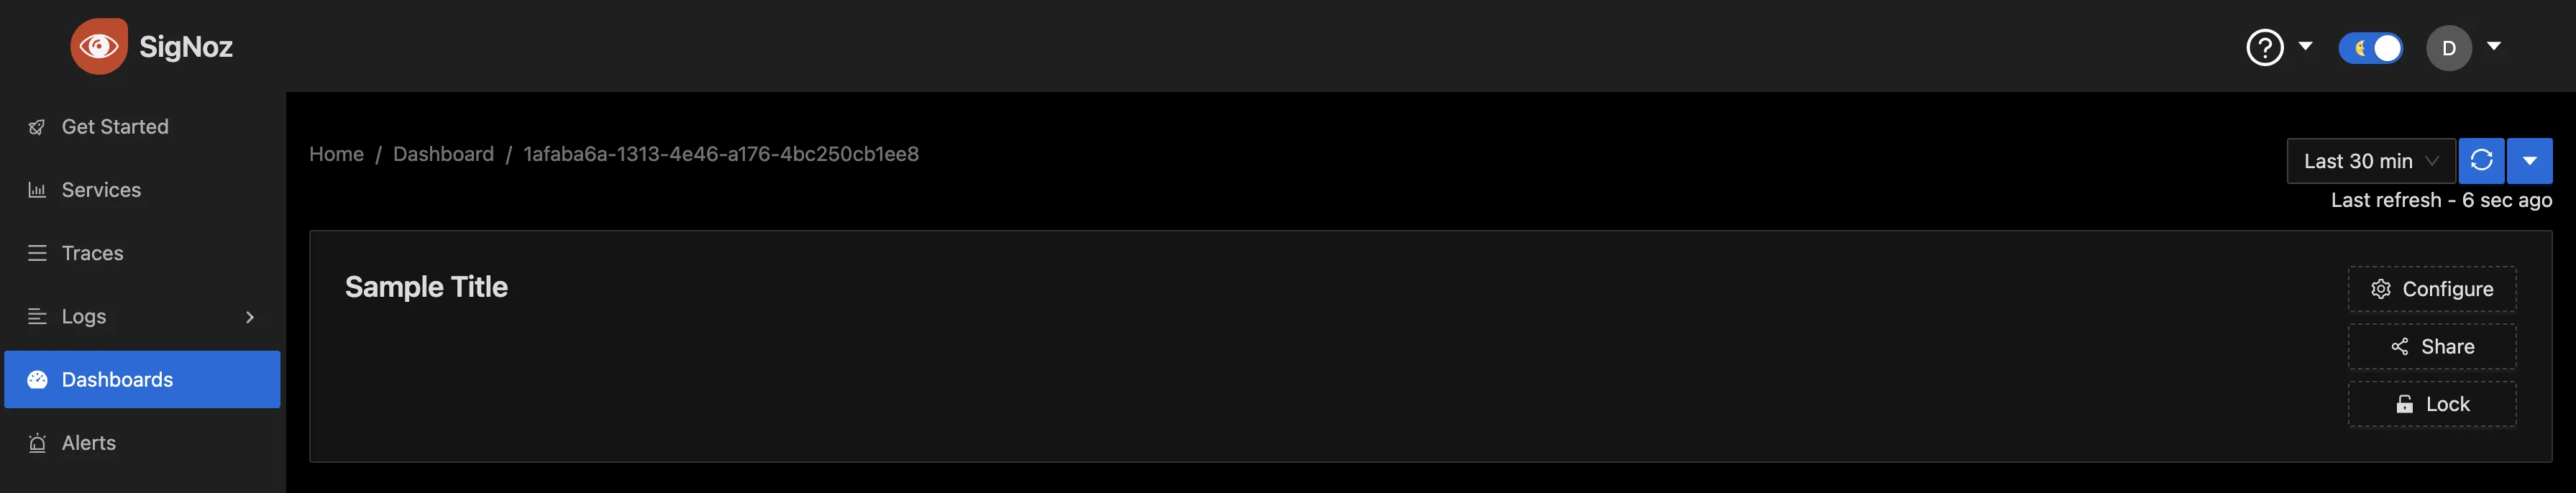
Once the collector service has been started successfully, navigate to your SigNoz Cloud account and access the "Dashboard" tab. Click on the “New Dashboard” button to create a new dashboard.
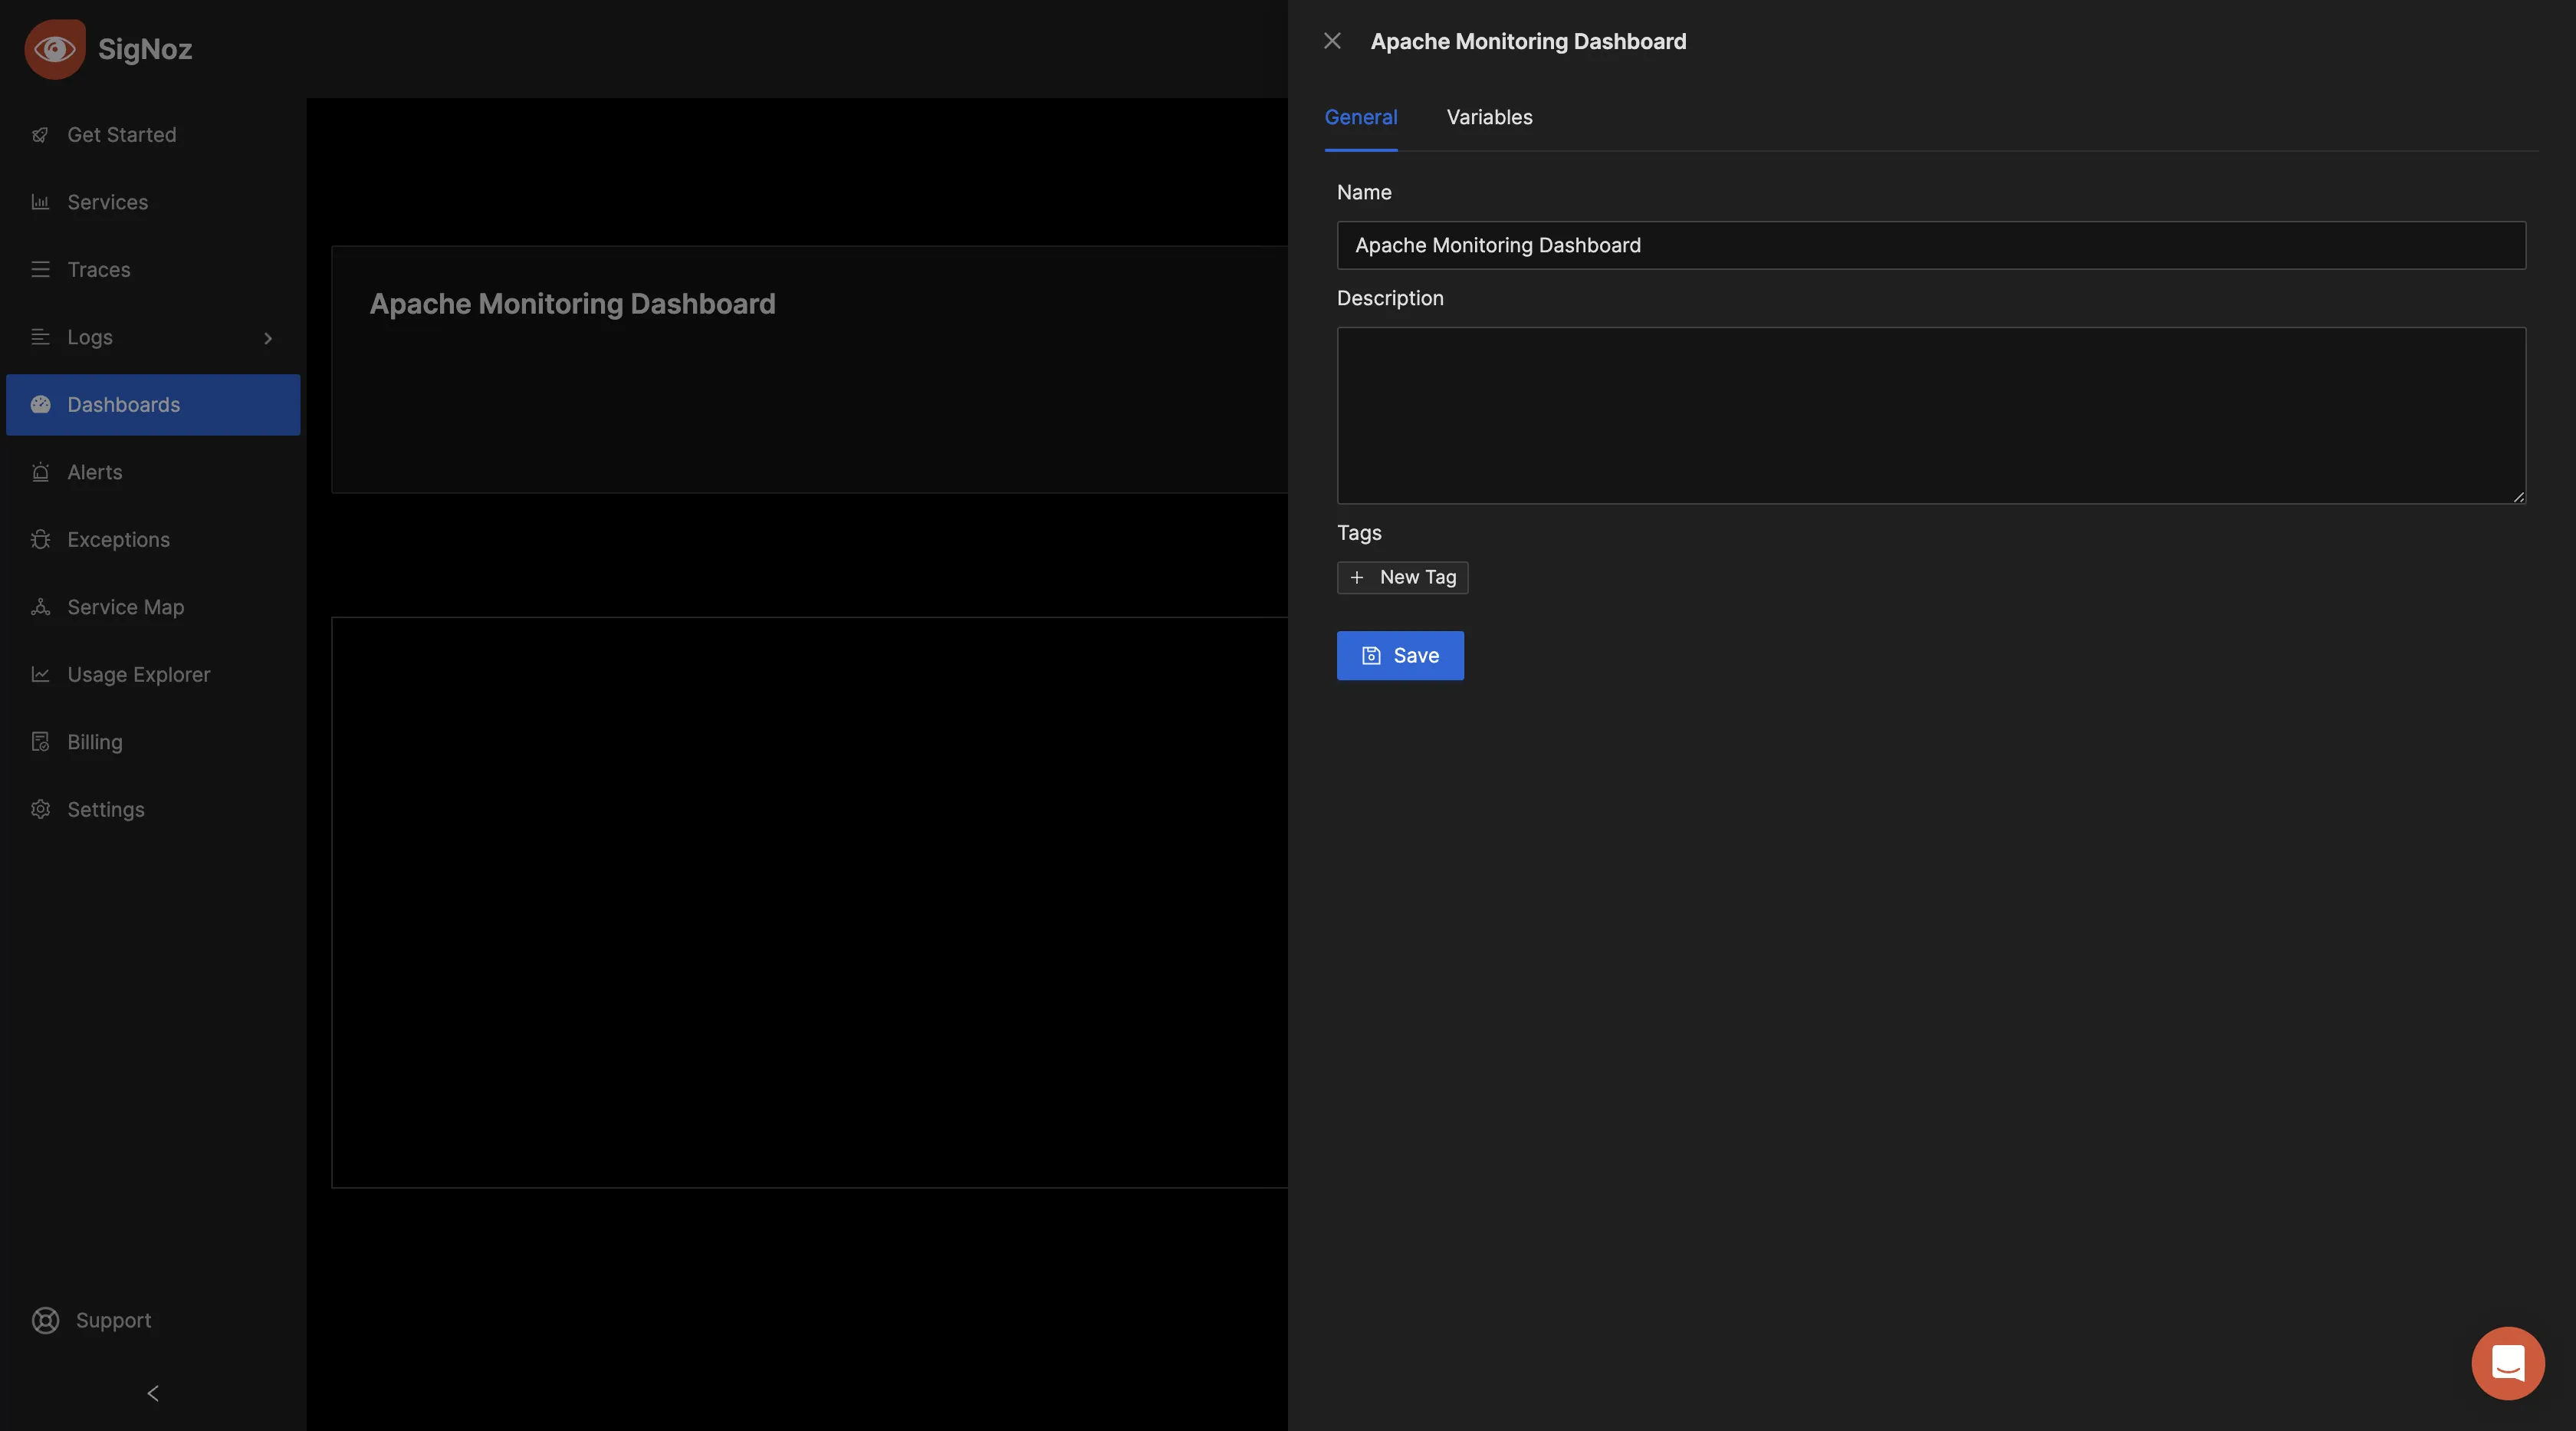
To give the dashboard a name, click on “Configure.”
Enter your preferred dashboard name in the "Name" input box and save the changes.
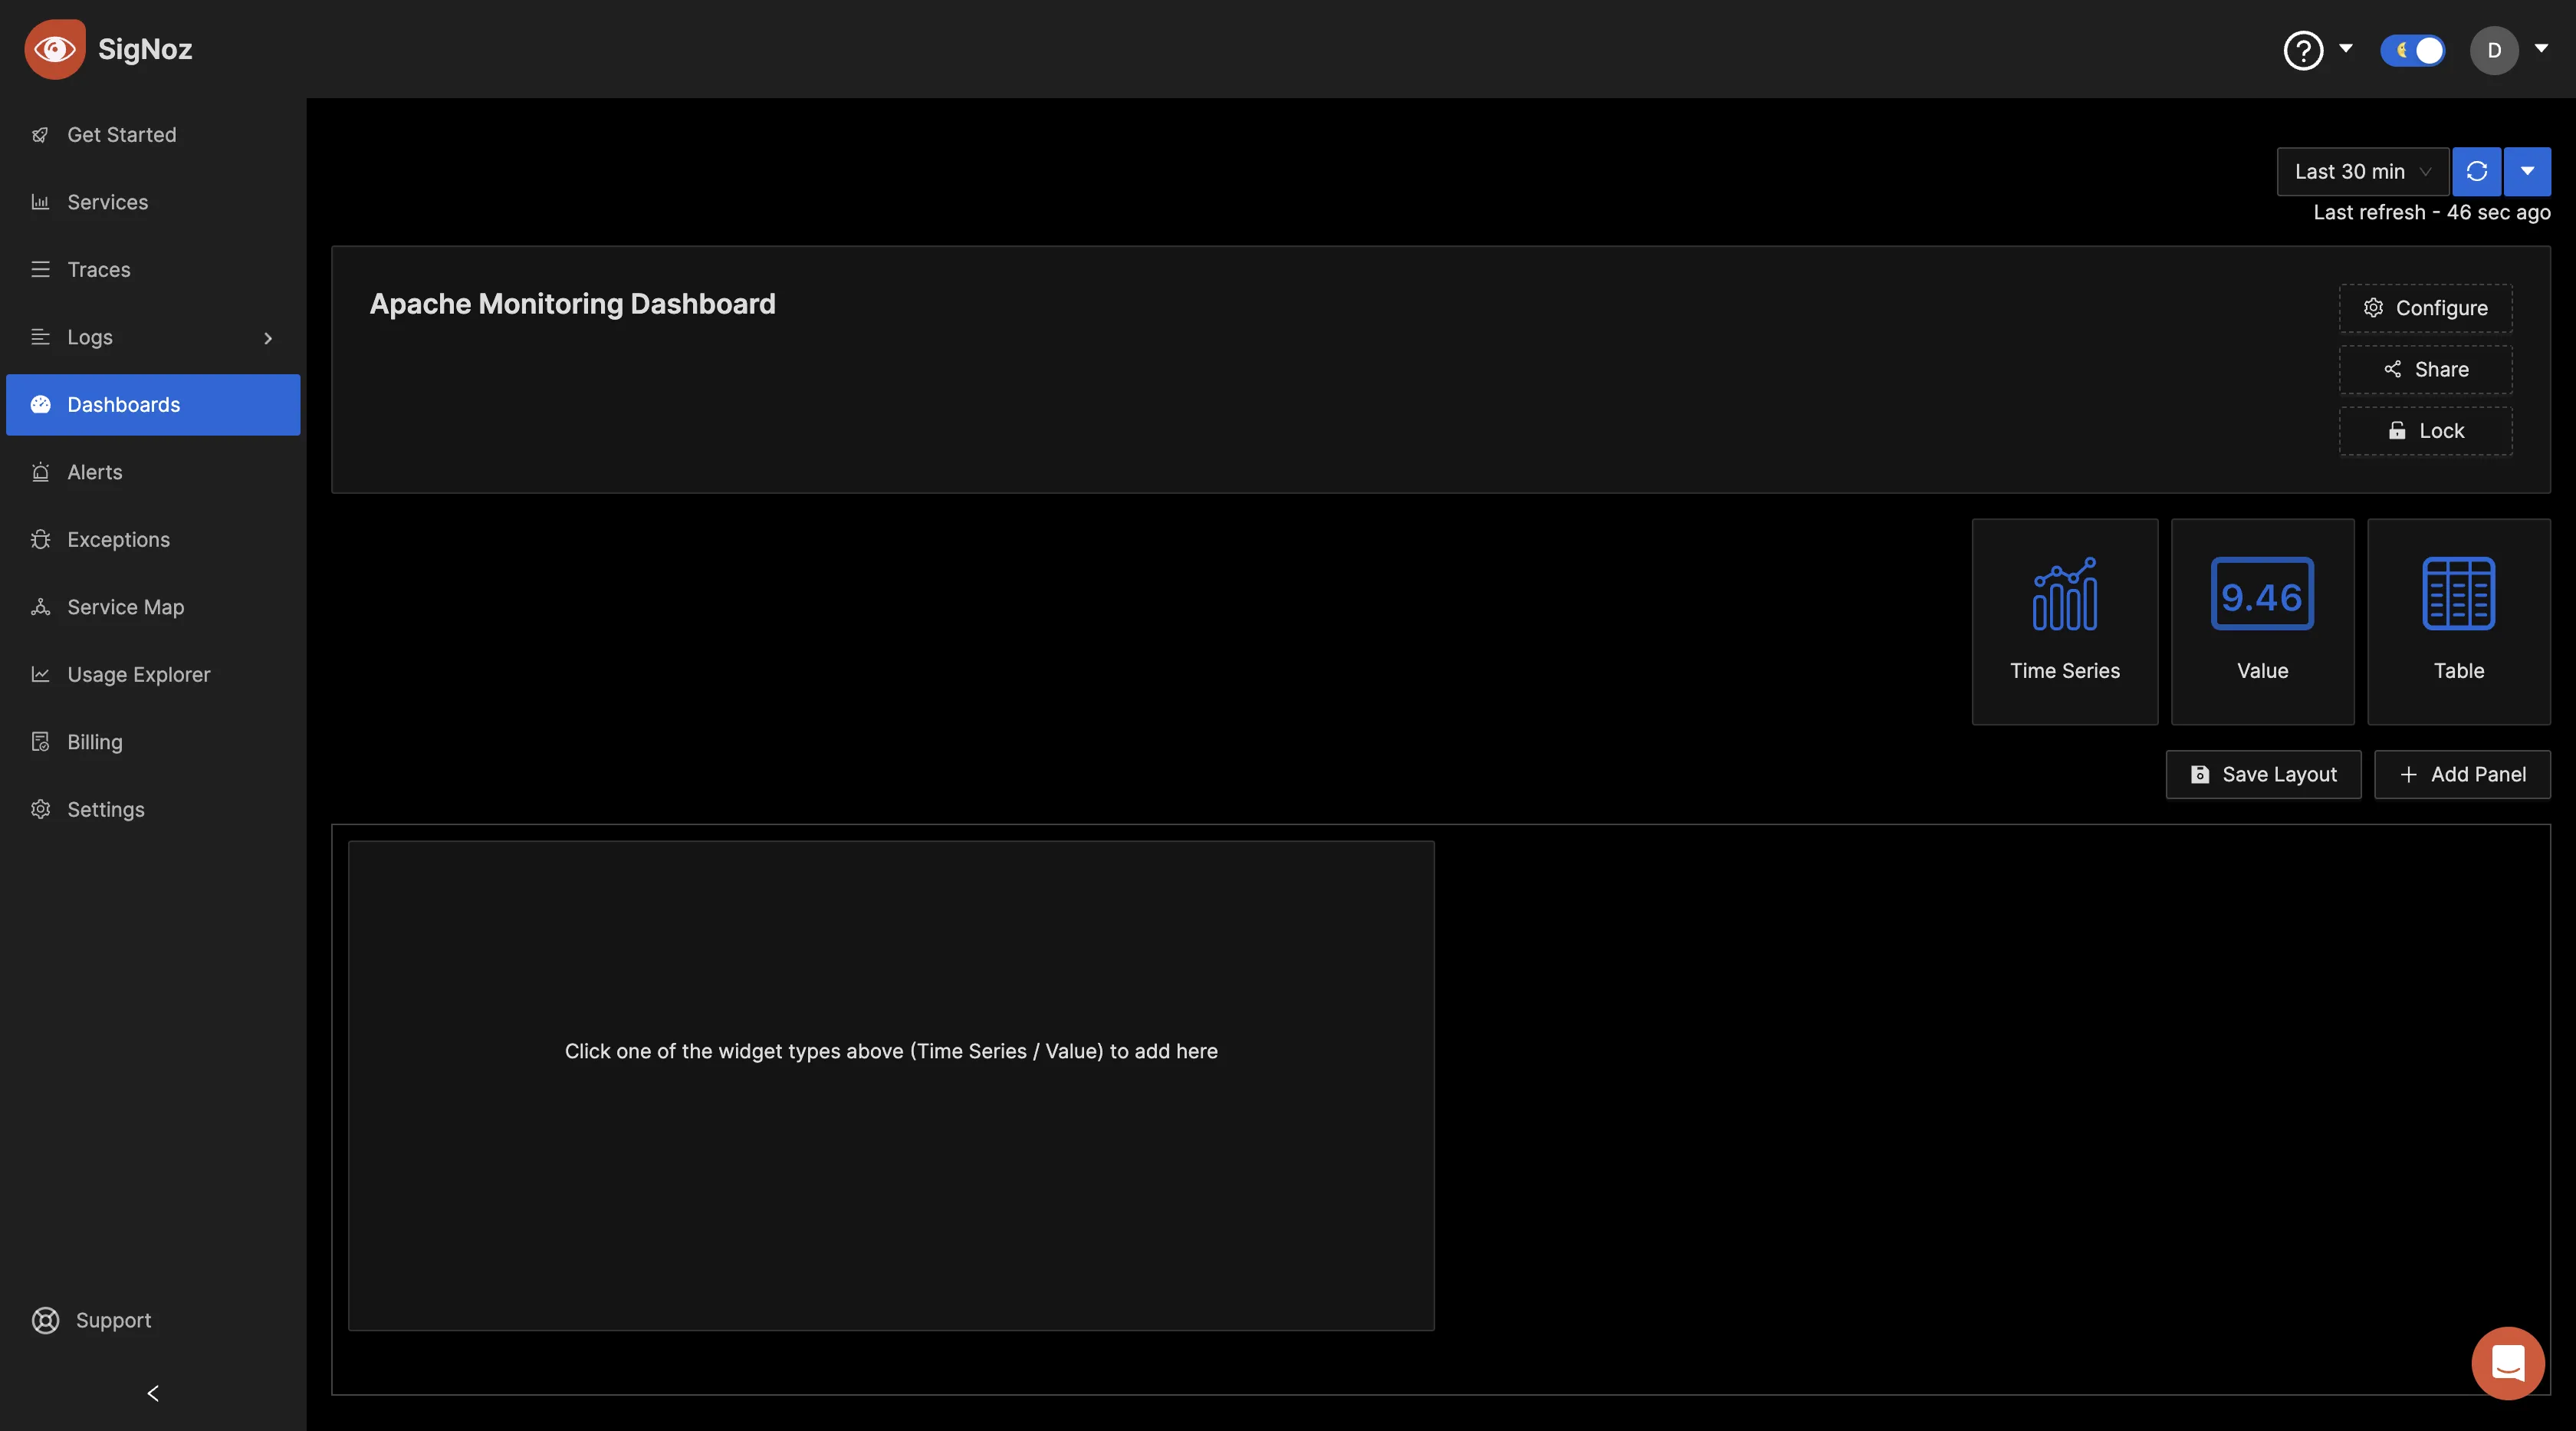
Now, you can create various panels for your dashboard. There are three visualization options to display your data: Time Series, Value, and Table formats. Choose the format that best suits your preferences, depending on the metric you want to monitor. For the initial metric, you can opt for the "Time Series" visualization.
In the "Query Builder" tab, enter "Apache" and you should see various Apache metrics. This confirms that the OpenTelemetry Collector is successfully collecting the Apache metrics and forwarding them to SigNoz for monitoring and visualization.
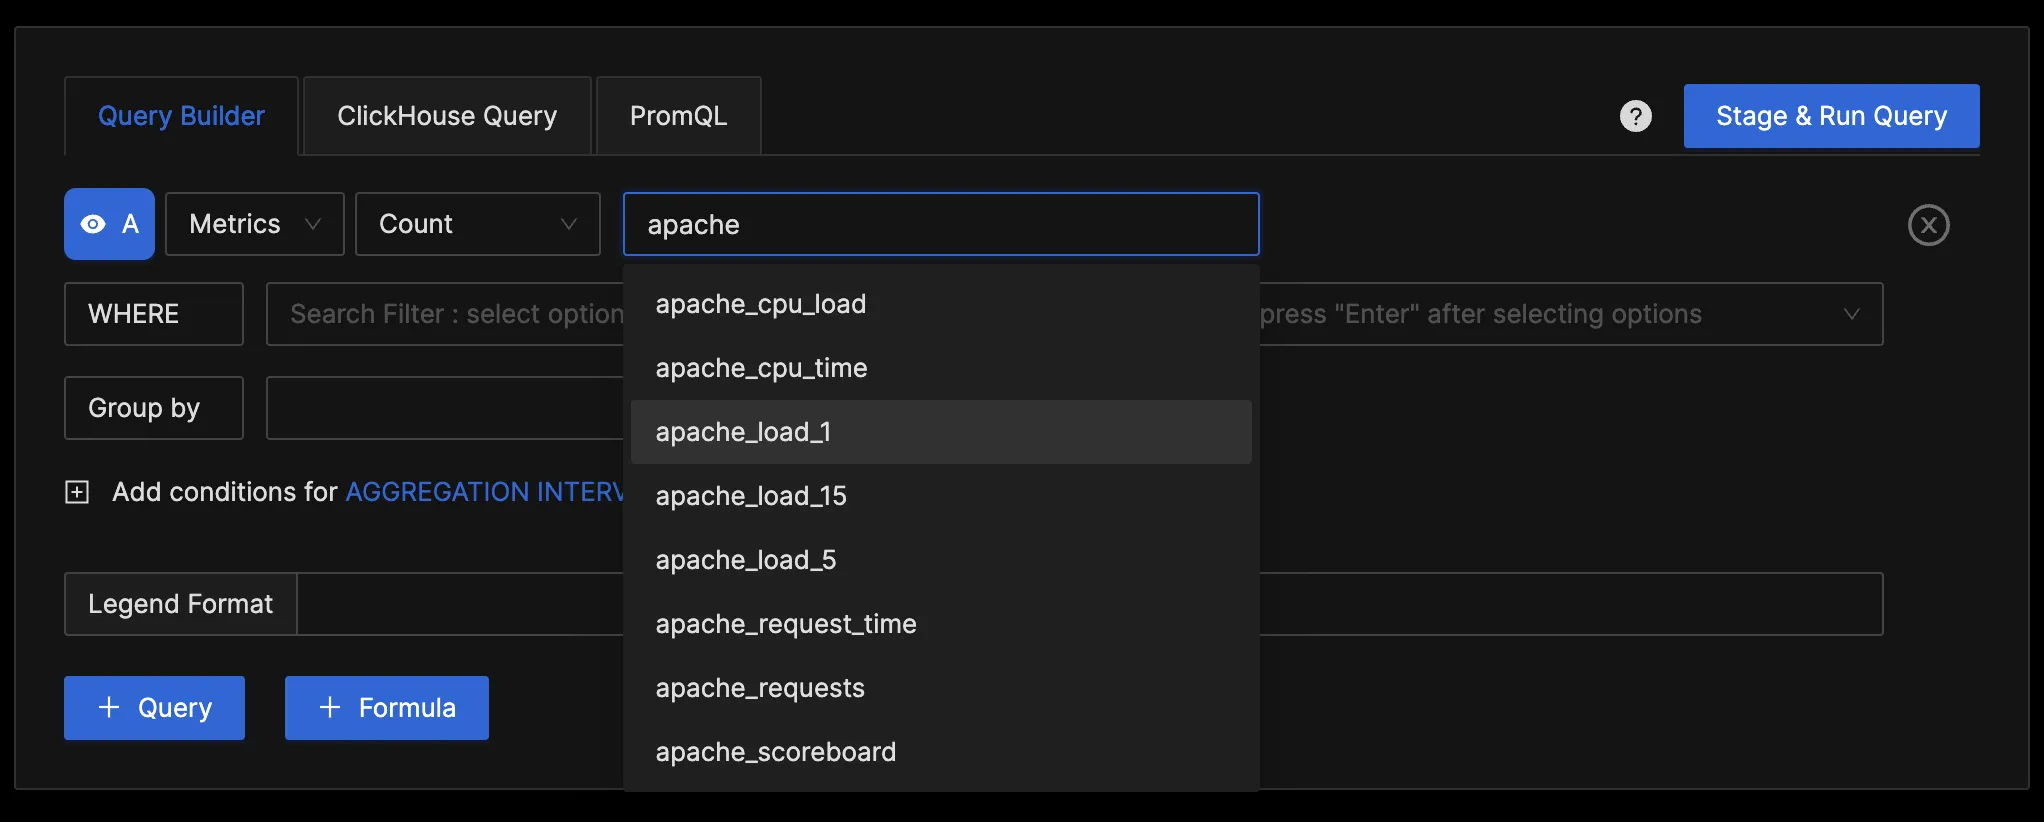
You can query the collected metrics using the query builder and create panels for your dashboard.
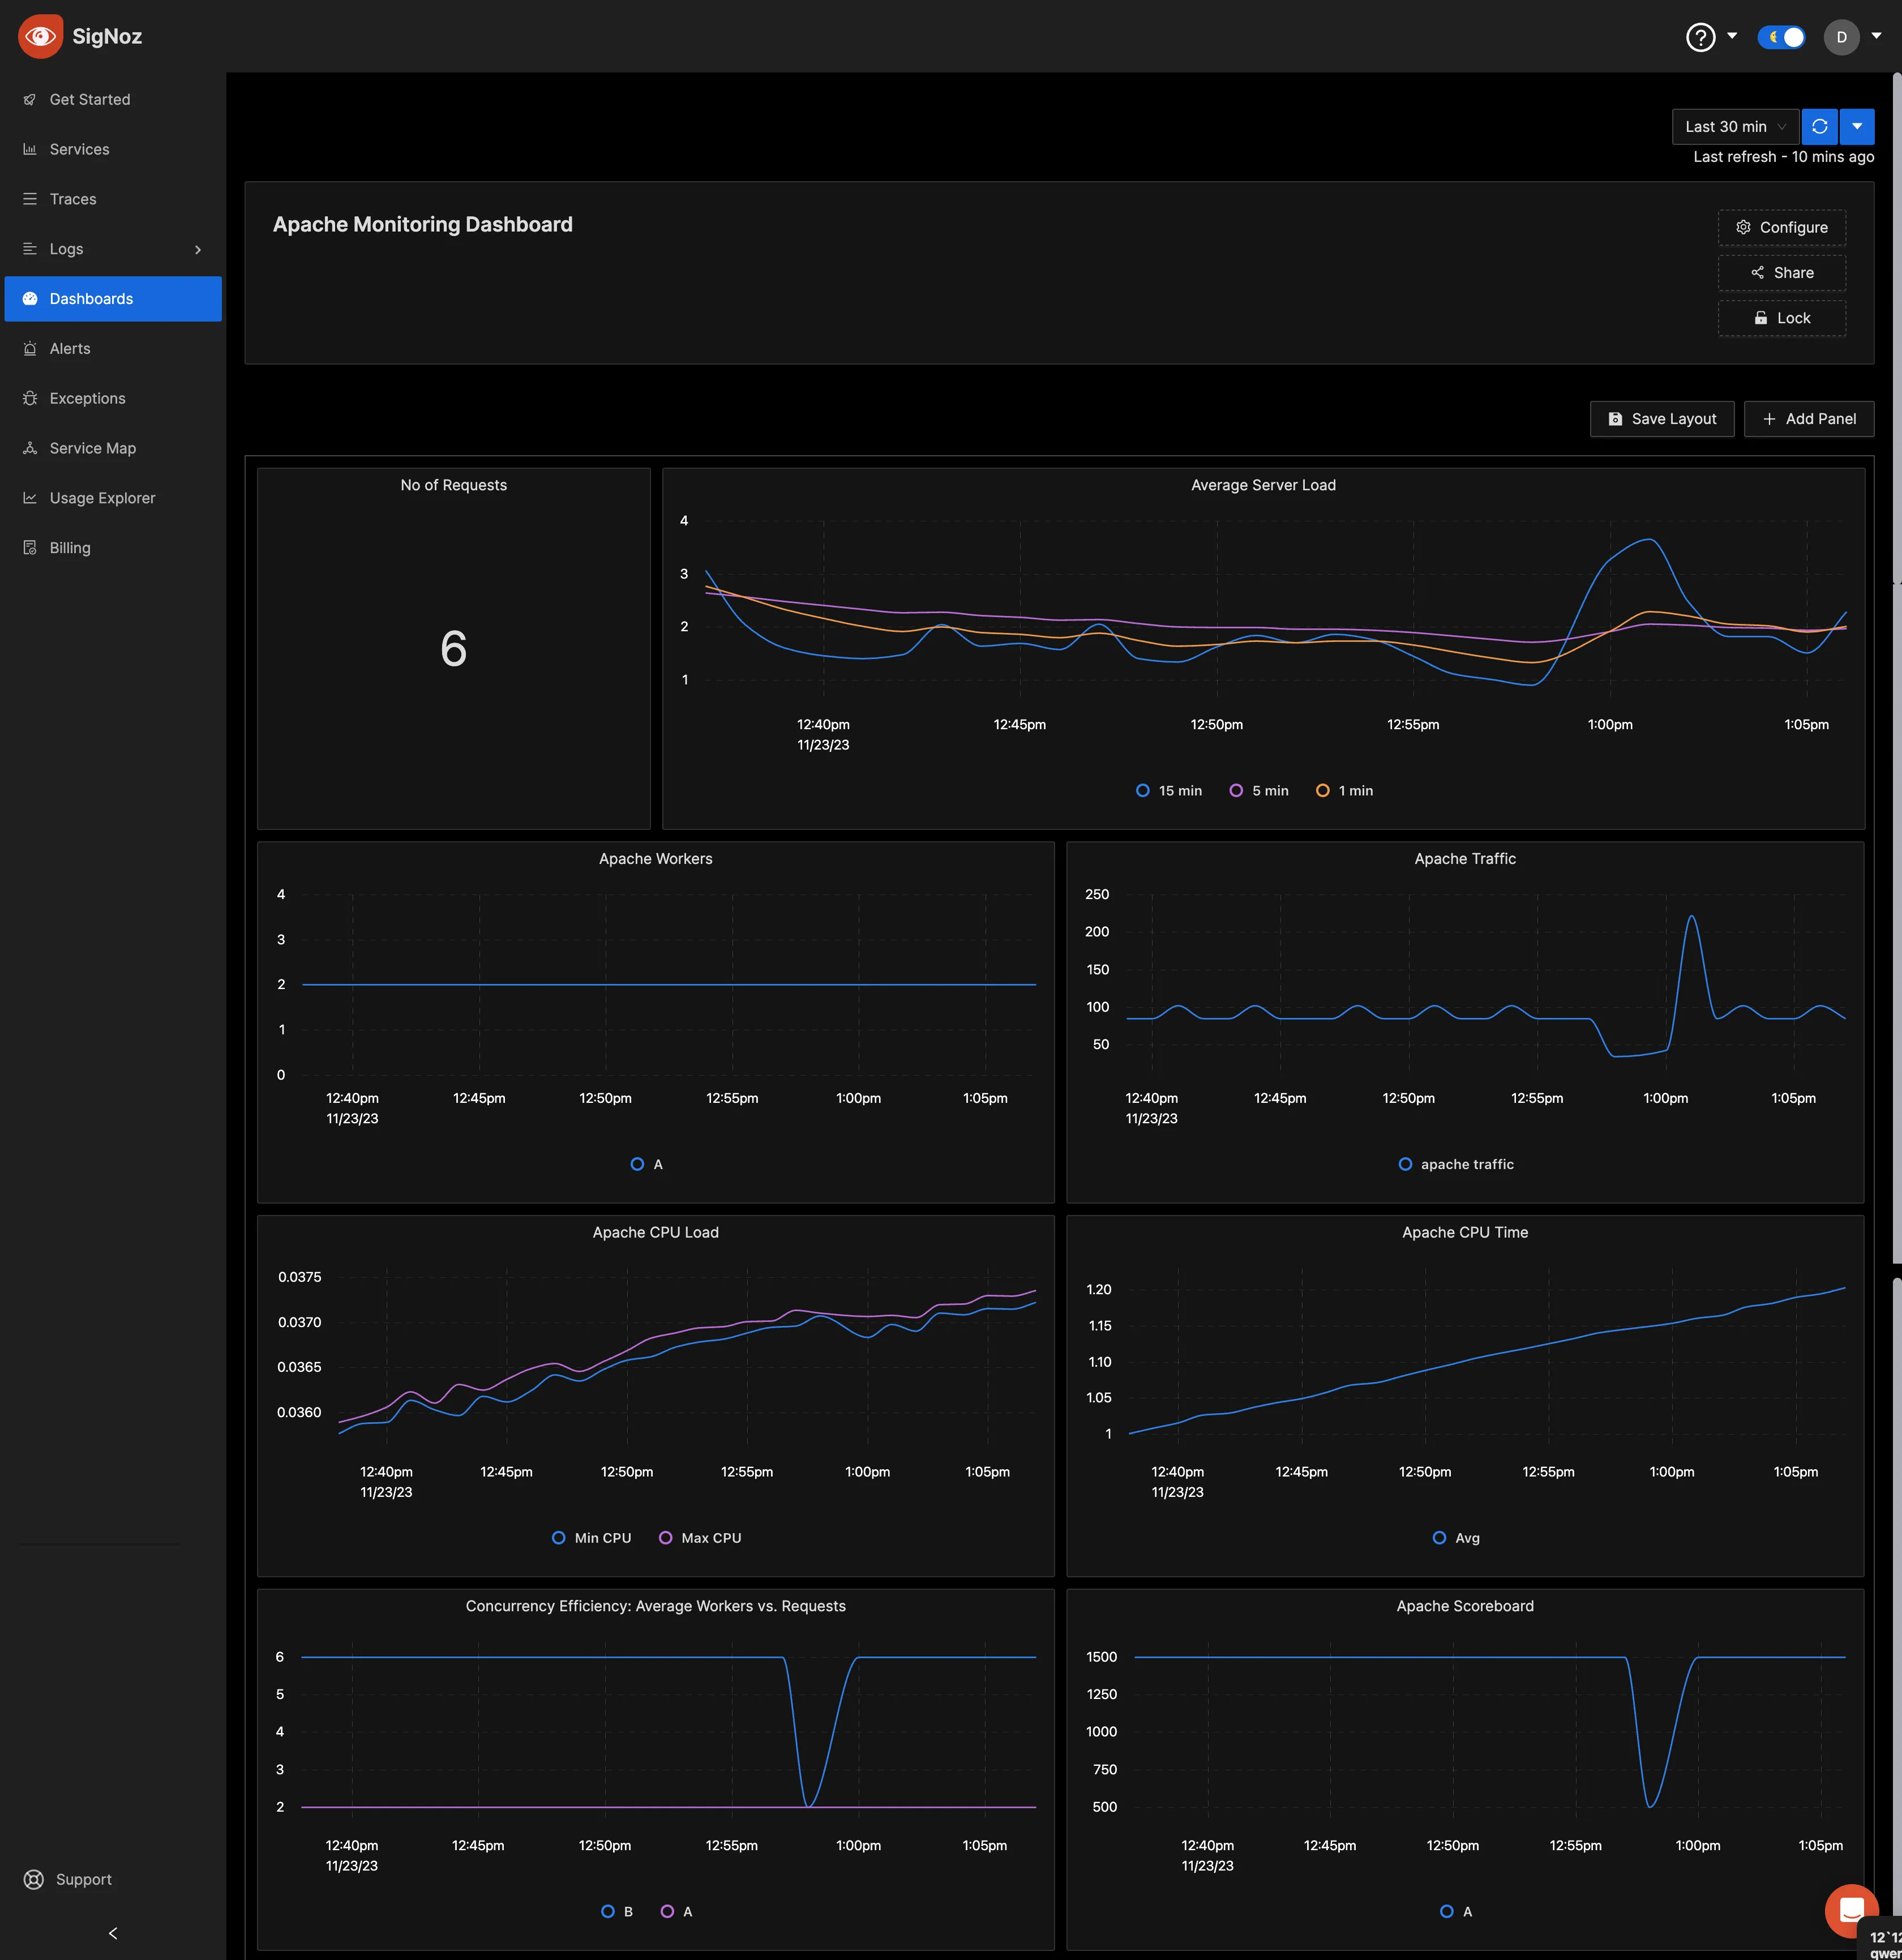
Visit the SigNoz documentation to learn more about creating dashboards and running queries. To replicate the above dashboard shown, use the JSON configuration here.
Import the copied JSON file into a new dashboard, and it will recreate the same layout and configurations for your convenience.
Besides just setting up dashboards to monitor your Apache metrics, you can create alerts for the different metrics you query. Click on the drop-down of the panel from your dashboard, and then click on “Create Alerts.”
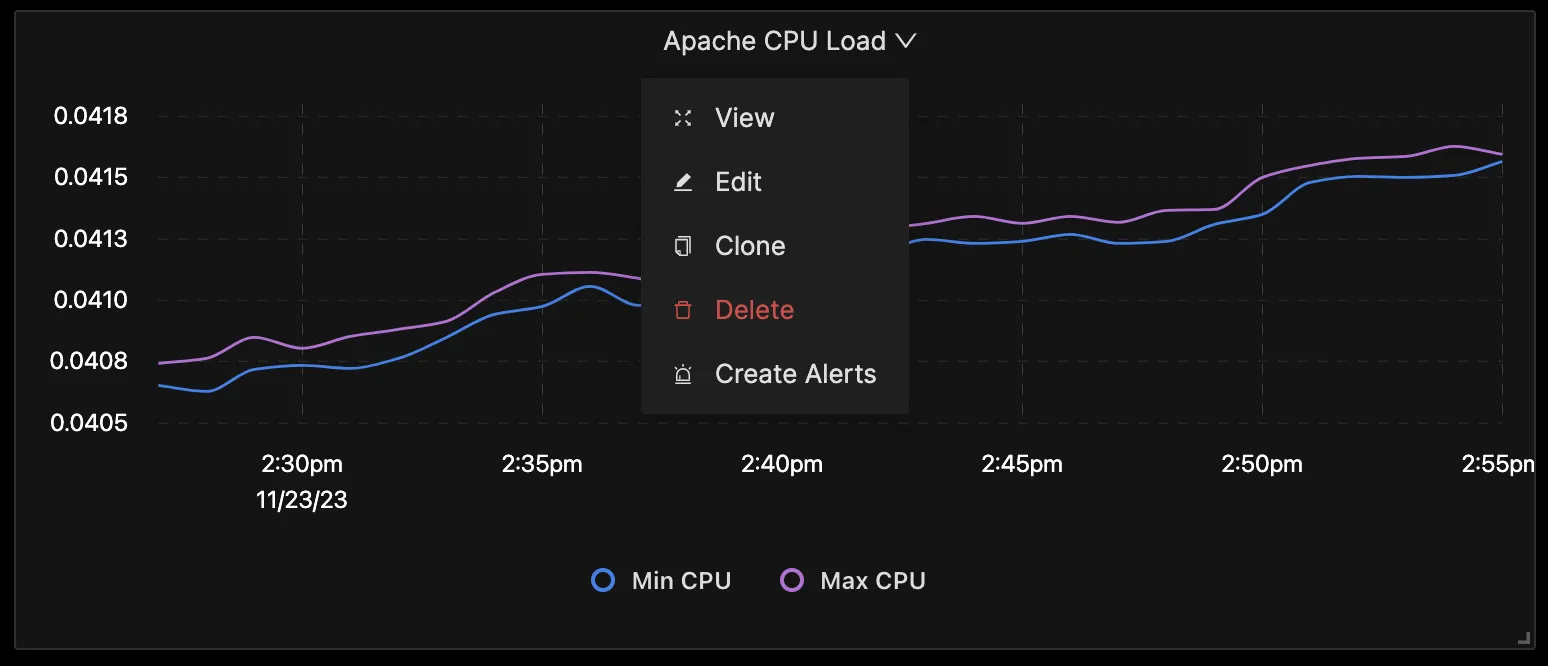
It will take you to the alerts page, and from there, you can create the alerts.
Metrics and Resource Attributes for Apache supported by OpenTelemetry
The following metrics and resource attributes for Apache can be collected by the Opentelemetry Collector.
Metrics
These metrics are enabled by default. Collectors provide many metrics that you can use to monitor how your Apache server is performing or if something is not right.
Key Terms for Metrics & Attributes
- Metric Name: The name of the metric is a unique identifier that distinguishes it from other metrics. It helps in referencing and organizing various metrics on SigNoz as well.
- Metric Type: The type of metric defines the kind of data it represents. The metric type indicates the type of data that the metric measures. some common metric types include gauge, counter, sum, and histogram.
- Value Type: The value type indicates the type of data that is used to represent the value of the metric. Some common value types are integer and double.
- Unit: The unit specifies the measurement unit associated with the metric. It helps in interpreting and comparing metric values, including Bytes, NONE, etc.
- Temporality: It involves understanding the temporal patterns and fluctuations within the data, providing insights into how the metric evolves over time. Temporality is crucial for analyzing trends, identifying patterns, and making informed decisions based on the temporal behavior of the observed metric.
- Monotonic: The monotonic flag indicates whether the metric value is always increasing or decreasing. A monotonic metric is useful for tracking trends over time, such as the total count of events or occurrences.
| Metrics | Description | Metrics Name | Metric Type | Value Type | Unit | Aggregation Temporality | Monotic |
|---|---|---|---|---|---|---|---|
| CPU Load | CPU load on the Apache server | apache.cpu.load | Gauge | Double | % | N/A | N/A |
| CPU Time | Cumulative CPU time consumed by Apache processes | apache.cpu.time | Sum | Double | {jiff} | Cumulative | True |
| Current Connections | Total current connections to the Apache server | apache.current_connections | Sum | Int | {connections} | Cumulative | False |
| Server Load | Load on the Apache server | apache.load | Gauge | Double | % | N/A | N/A |
| Request Time | Cumulative time taken to process Apache requests | apache.request.time | Sum | Int | ms | Cumulative | True |
| Total Requests | Total number of requests handled by the Apache server | apache.requests | Sum | Int | {requests} | Cumulative | True |
| Scoreboard Metrics | Cumulative count of workers in different states | apache.scoreboard | Sum | Int | {workers} | Cumulative | False |
| Traffic Metrics | Cumulative traffic handled by the Apache server | apache.traffic | Sum | Int | By | Cumulative | True |
| Uptime | Total uptime of the Apache server | apache.uptime | Sum | Int | s | Cumulative | True |
| Workers | Total count of Apache server workers | apache.workers | Sum | Int | {workers} | Cumulative | False |
You can visit the Apache receiver GitHub repo to learn more about these metrics.
Resource Attributes
Resource attributes are a set of key-value pairs that provide additional context about the source of a metric. They are used to identify and classify metrics, and to associate them with specific resources or entities within a system.
The below attributes are enabled by default for Apache.
| Name | Description | Values | Enabled |
|---|---|---|---|
| apache.server.name | The name of the Apache HTTP server. | Any Str | true |
| apache.server.port | The port of the Apache HTTP server. | Any Str | true |
You can see these resource attributes in the OpenTelemetry Collector Contrib repo for the Apache receiver.
Conclusion
In this tutorial, you configured an OpenTelemetry collector to export metrics data from an Apache web server. You then sent the data to SigNoz for monitoring and visualization.
Visit our complete guide on OpenTelemetry Collector to learn more about it.
OpenTelemetry is becoming a global standard for open-source observability, offering advantages such as a unified standard for all telemetry signals and avoiding vendor lock-in. With OpenTelemetry, instrumenting your applications to collect logs, metrics, and traces becomes seamless, and you can monitor and visualize your telemetry data with SigNoz.
SigNoz is an open-source OpenTelemetry-native APM that can be used as a single backend for all your observability needs.
Further Reading
Complete Guide on OpenTelemetry Collector
