OpenTelemetry Browser Instrumentation Complete Tutorial
Browser instrumentation refers to collecting and analyzing data about a user's interactions with a web browser. This type of instrumentation involves using specialized tools and techniques to gather information about how a website is being used, such as page load times, network requests, and user interactions.

The data collected through browser instrumentation can be used to improve website performance, identify and troubleshoot errors, and gain insights into user behavior. In this tutorial, we will use OpenTelemetry to instrument a React browser application.
OpenTelemetry Browser Instrumentation
OpenTelemetry provides libraries that enable the collection of telemetry data from web browsers using the OpenTelemetry API. You can collect performance metrics, traces, and other telemetry data from client-side applications running in the browser. The collected data can be exported to an observability backend like SigNoz.
By using OpenTelemetry Browser Instrumentation, developers can gain valuable insights into how their web applications are performing and identify opportunities for optimization, leading to a better user experience. OpenTelemetry is backed by CNCF and is continuously evolving to improve observability for software systems.
OpenTelemetry just provides an instrumentation layer, you would need a backend to store and analyze data. In this tutorial, we will use SigNoz - an open source full-stack observability tool to visualize the collected data.
Let’s learn how to instrument a React browser application with OpenTelemetry.
Browser Instrumentation with OpenTelemetry
Prerequisites
- Reactjs
- SigNoz
Install SigNoz
Step 1: Install SigNoz
First, you need to install SigNoz so that OpenTelemetry can send the data to it.
SigNoz can be installed on macOS or Linux computers in just three steps by using a simple install script.
The install script automatically installs Docker Engine on Linux. However, on macOS, you must manually install Docker Engine before running the install script.
git clone -b main https://github.com/SigNoz/signoz.git
cd signoz/deploy/
./install.sh
You can visit the documentation for instructions on how to install SigNoz using Docker Swarm and Helm Charts.

When you are done installing SigNoz, you can access the UI at http://localhost:3301/application
Step 2: Get the sample React app
Sample React App It contains the sample boilerplate code that we will instrument.
git clone https://github.com/SigNoz/react-app-browser-instrumentation.git
Instrument React App with OpenTelemetry
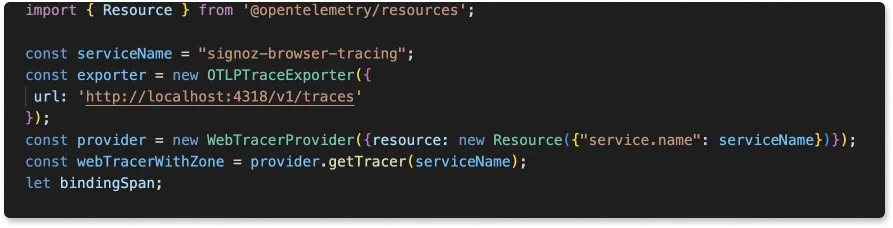
Step 3: Tracing.js file Our application code consists of a tracing.js file. The tracing.js file contains the code for setting up OpenTelemetry. You can find the file here.
Step 4: Instrument Browser Instrumentation in React app with OpenTelemetry
To instrument the React app with OpenTelemetry, we need to install the OpenTelemetry dependencies.
npm i @opentelemetry/api @opentelemetry/auto-instrumentations-web @opentelemetry/context-zone @opentelemetry/exporter-trace-otlp-http @opentelemetry/instrumentation-fetch @opentelemetry/instrumentation-xml-http-request @opentelemetry/resources @opentelemetry/sdk-trace-web
Since we already set up the tracing.js file in the sample react app, you can just change the service name.
Step 3: Enable CORS in the OpenTelemetry Collector
SigNoz installation comes with an OpenTelemetry Collector, which must be configured for receiving traces from the browser application. Enable CORS in the OTel Receiver.
Under SigNoz folder, open the otel-collector-config.yaml file. The file is located at deploy/docker/otel-collector-config.yaml
You can view the file at SigNoz GitHub repo. Inside the file, add the following CORS config:
http:
  cors:
    allowed_origins:
      - https://netflix.com  # URL of your Frontend application
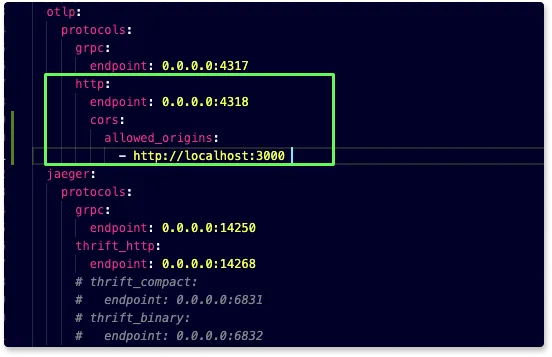
You need to update the URL in the config file to match your frontend application URL. For this tutorial, we will be running our frontend application on http://localhost:3000.
http:
  cors:
    allowed_origins:
      - http://localhost:3000
Once you make the changes, you need to restart the Docker containers.
To stop running the SigNoz cluster:
cd deploy/docker
sudo docker compose stop
To start/resume the running SigNoz cluster:
cd deploy/docker
sudo docker compose start
The stopped SigNoz cluster should resume and mount to the existing docker volumes.
Step 6: Start the React app
Go to the root folder of your React application, and run the following command:
npm run start
Congratulations! You have successfully run your React application with OpenTelemetry. It’s time to see the collected data.
Monitor React App with SigNoz
Step 7: Generate some data
In order to monitor your React application with SigNoz, you first need to generate some data.
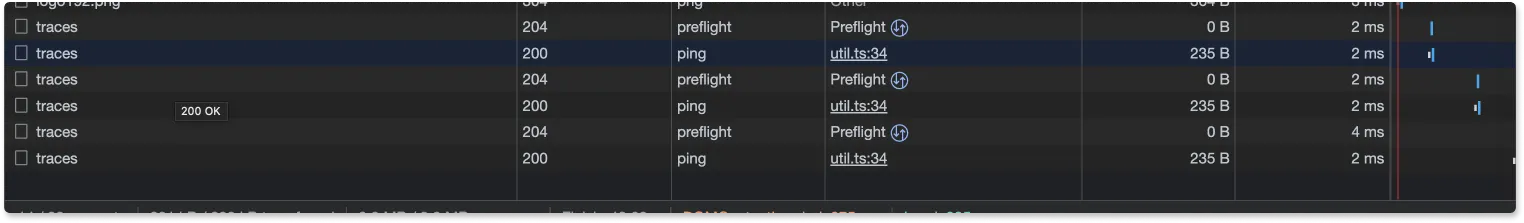
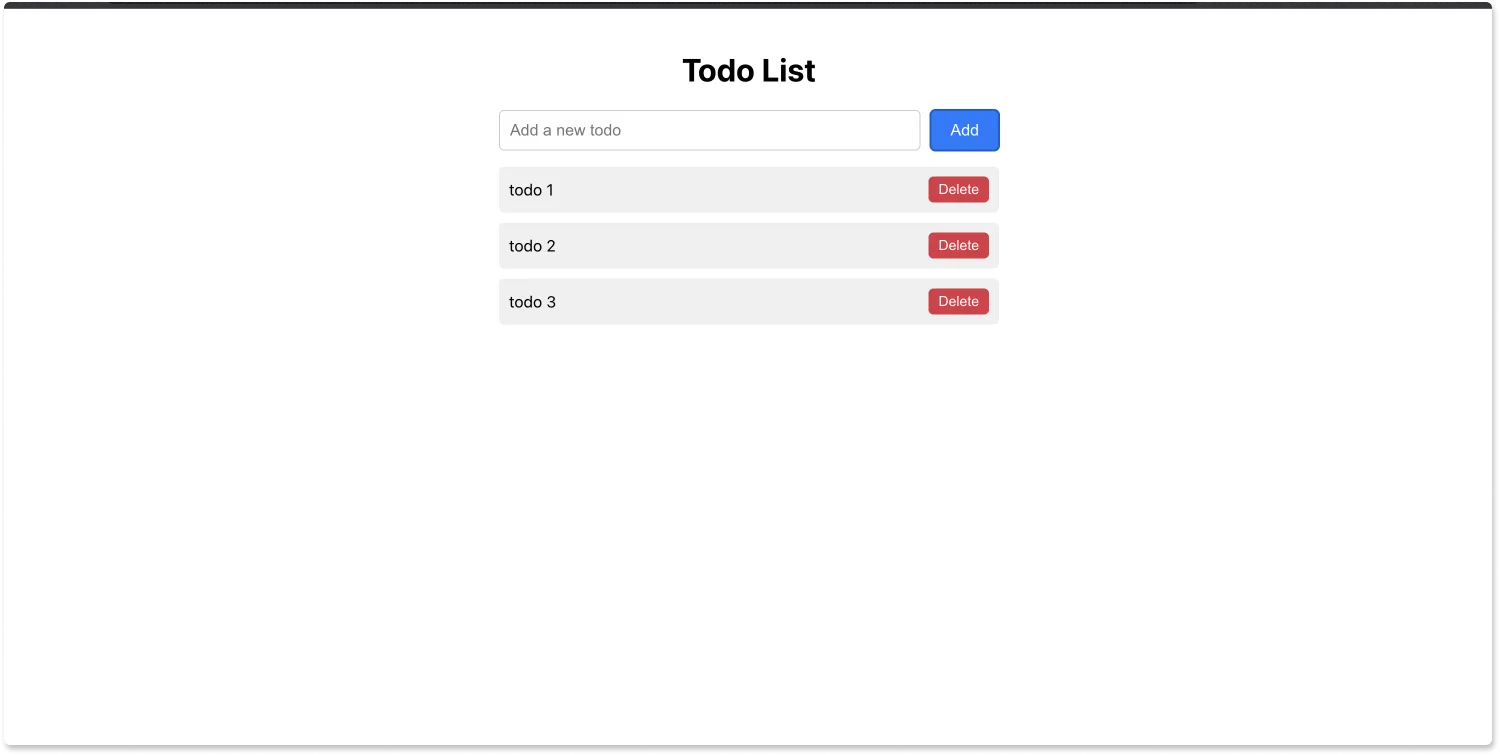
Visit http://localhost:3000/ to access your frontend application. Using the UI, make some calls to the backend API. You can check the network tab in your browser to see the requests that you have made.
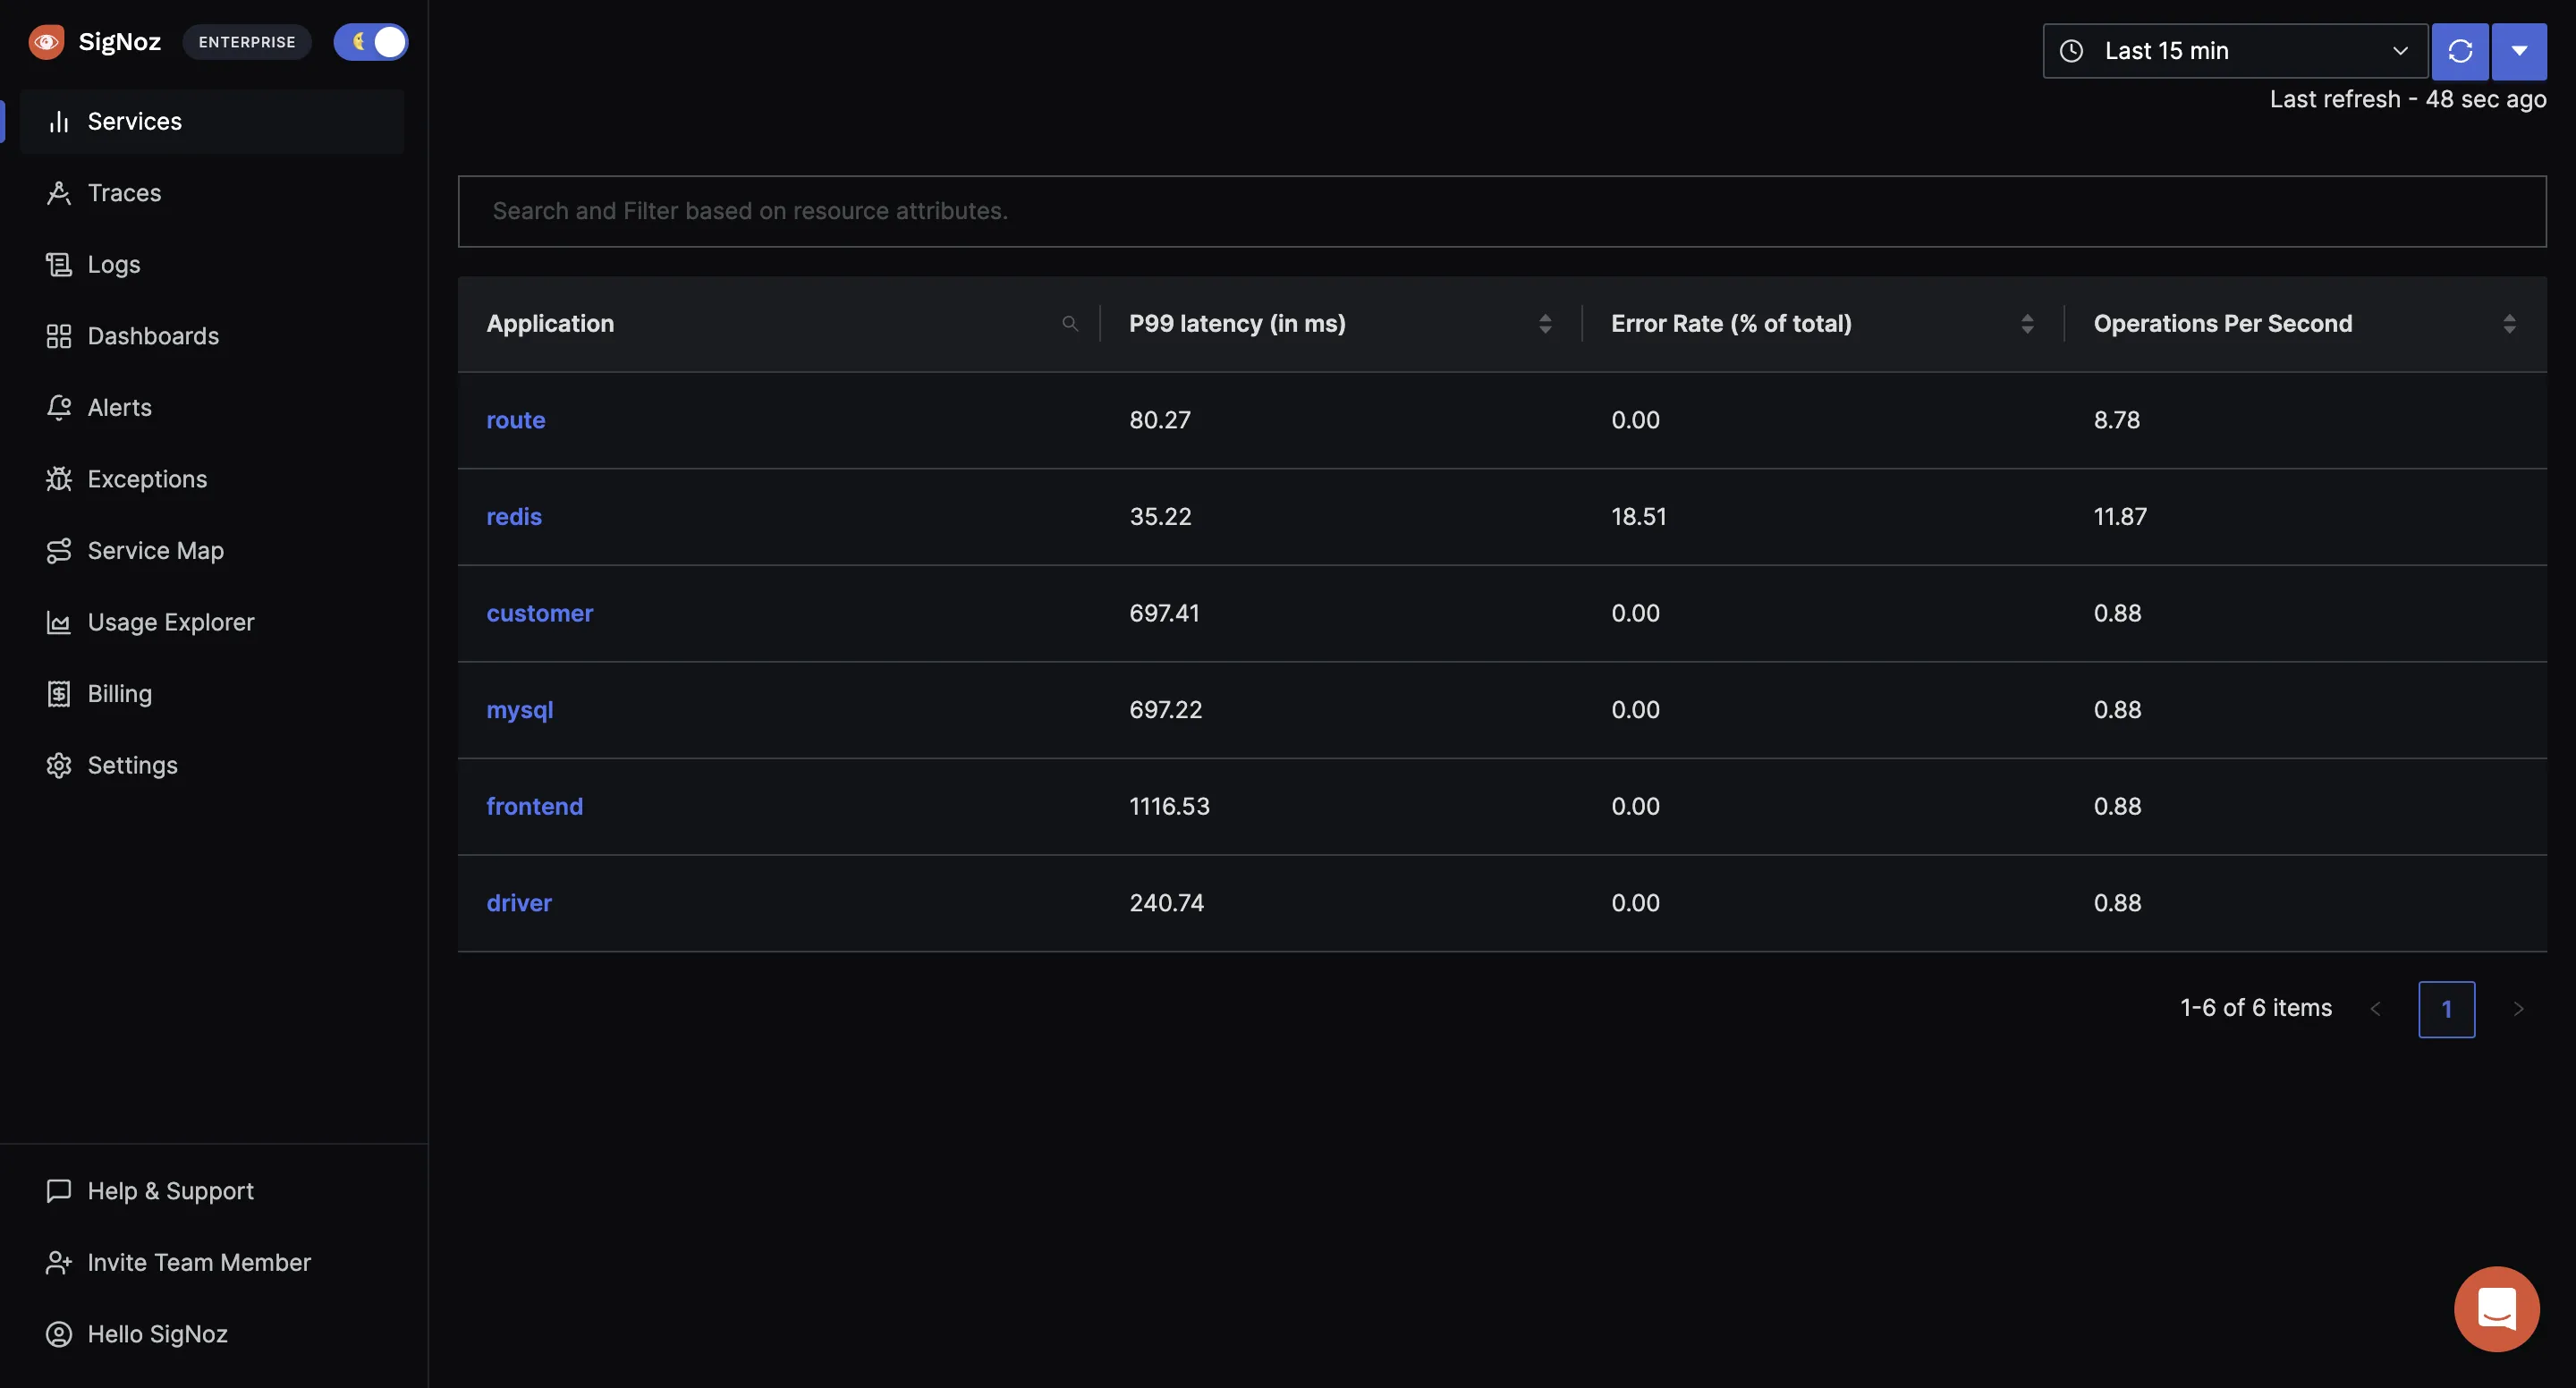
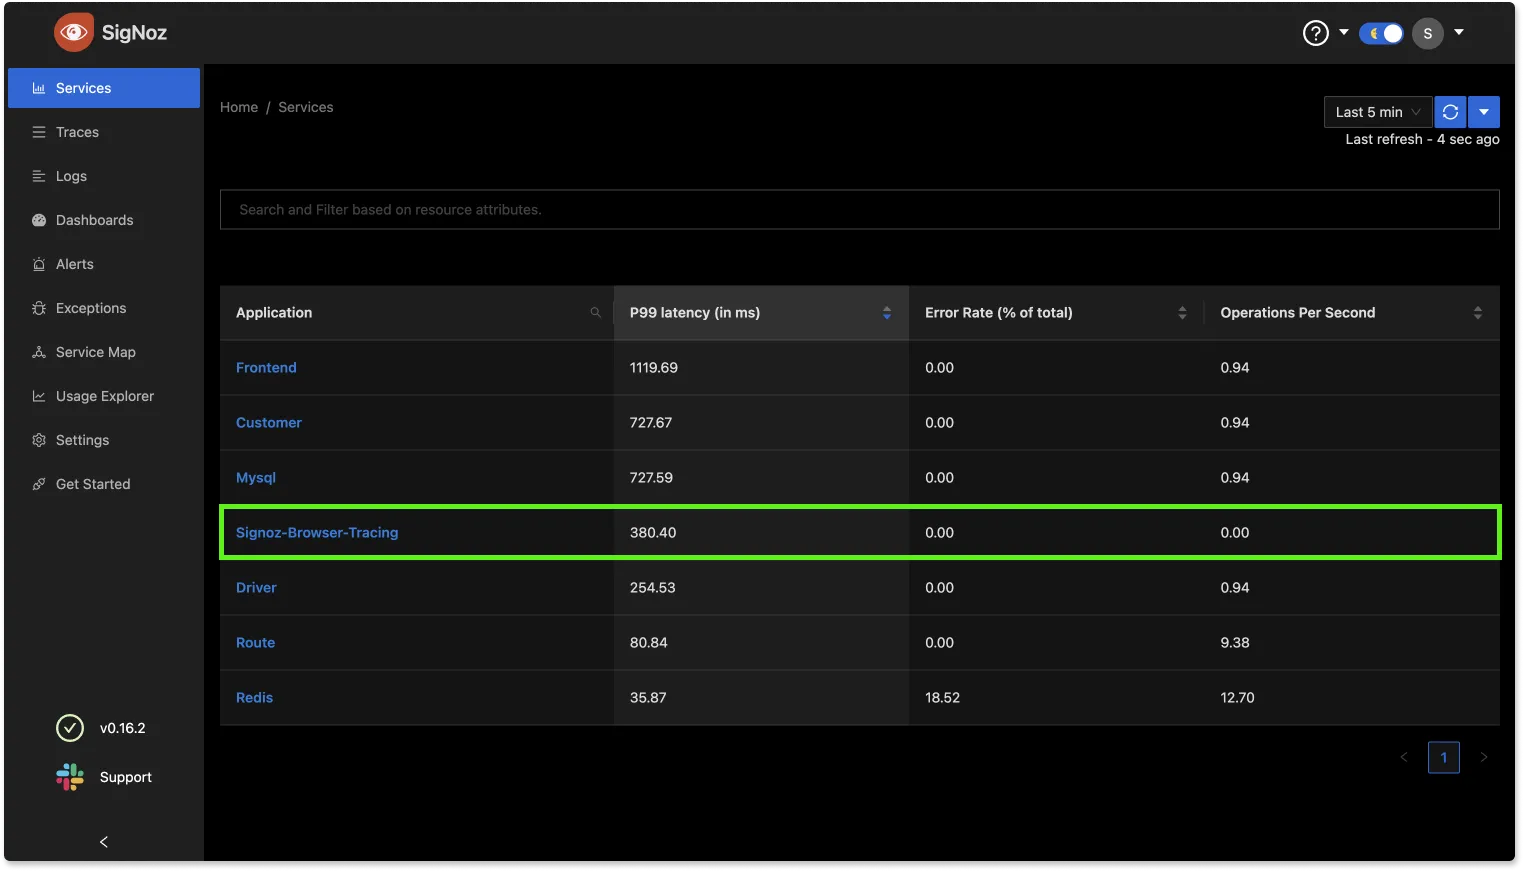
Step 8: Monitor your application with SigNoz
With SigNoz, you can monitor the data collected by OpenTelemetry from your sample React application. You can see end-to-end traces for your React application.
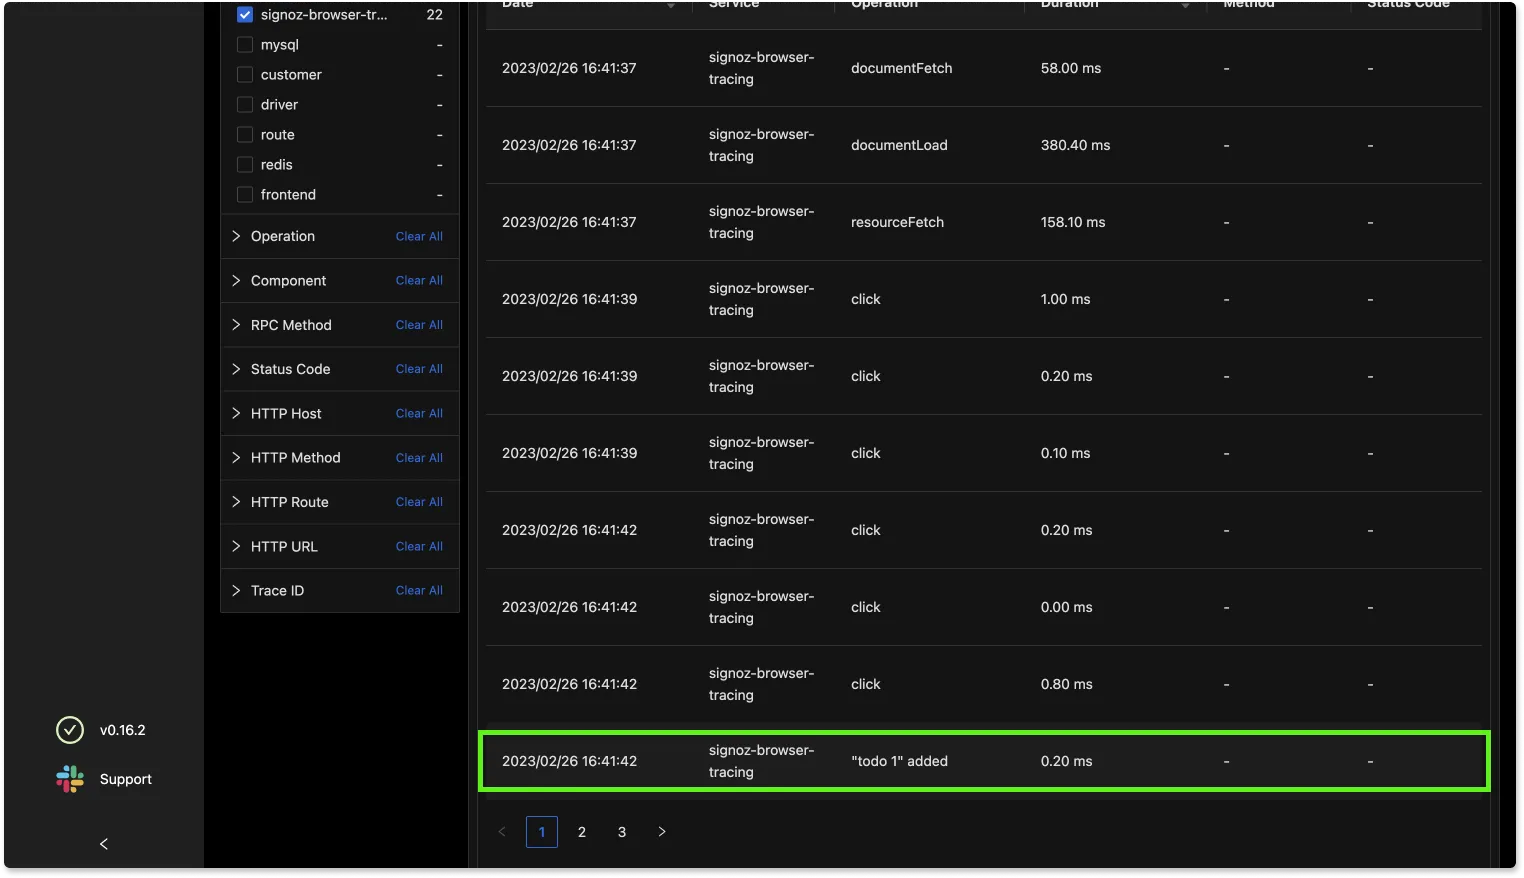
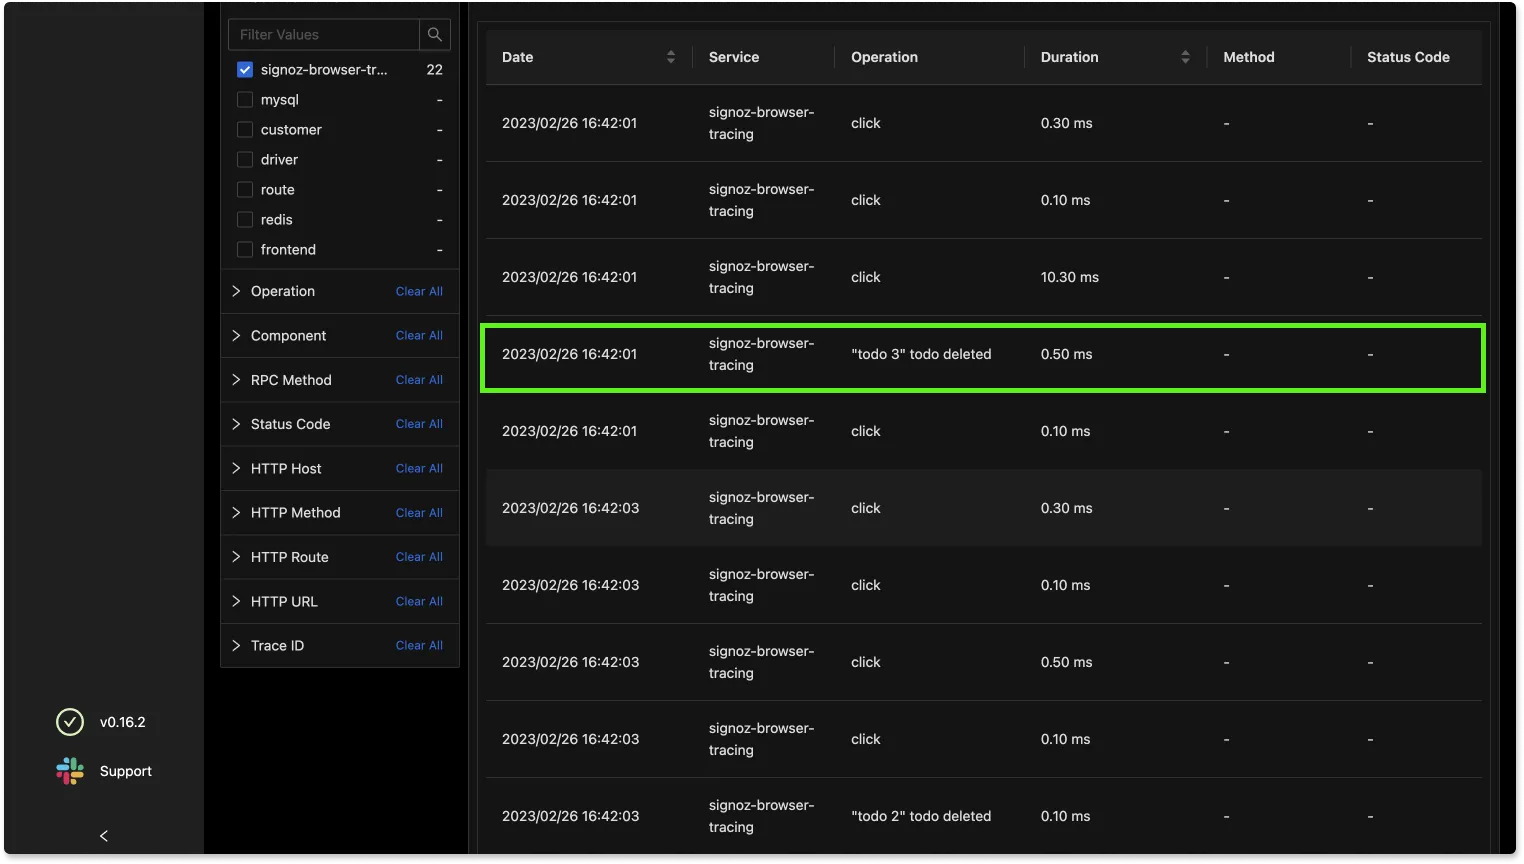
You can analyze your tracing data with powerful filters using the Traces tab on the SigNoz dashboard.
Todo 1 got added
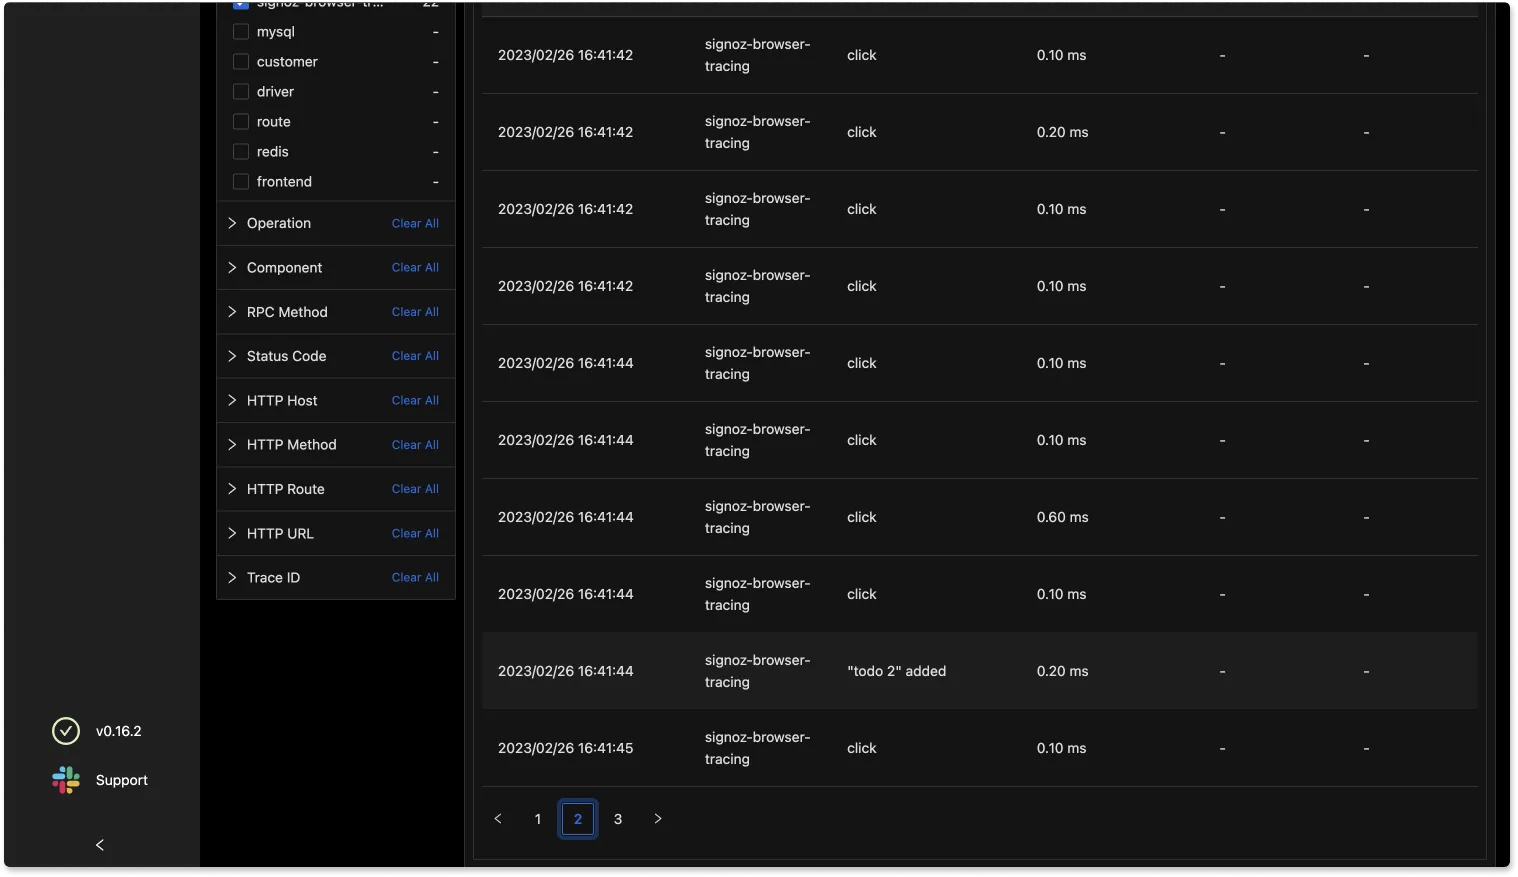
Todo 2 got added
Todo 3 got deleted
Conclusion
OpenTelemetry browser instrumentation lets you collect important metrics about performance of browser applications. If you use OpenTelemetry, you also don’t get locked in with any vendor. OpenTelemetry is a one-stop solution for generating and collecting all telemetry signals. You can future-proof your instrumentation by using OpenTelemetry libraries.
OpenTelemetry combined with SigNoz provides a full-stack open source solution. SigNoz provides all three telemetry signals - logs, metrics, and traces under a single pane of glass.
If you have any questions or need any help in setting things up with SigNoz, join our slack community and ping us in #support channel.

Further Reading
SigNoz - an open source alternative to DataDog
Monitor your Express application with OpenTelemetry and SigNoz
