Monitoring CouchDB with OpenTelemetry and SigNoz
OpenTelemetry can help you monitor CouchDB performance metrics with the help of OpenTelemetry Collector. In this tutorial, you will install OpenTelemetry Collector to collect CouchDB metrics and then send the collected data to SigNoz for monitoring and visualization.
Before that, let’s have a brief overview of CouchDB.
If you want to jump straight into implementation, start with this Prerequisites section.
A Brief Overview of CouchDB
CouchDB stores data in documents, which are like digital files. This makes it easy to organize and manage information. Unlike some databases that need a strict structure, CouchDB lets you change and adapt your data without any hassle. It's like having a tool that can handle different shapes and sizes of information.
CouchDB is simple to use. You don't need complicated setups or confusing rules. It's like the easy-to-use librarian for your data. It can grow with your needs. As your programs or applications get bigger, CouchDB can handle more data without slowing down. CouchDB can easily adjust to changes in how your data is organized. This means you can improve and update your programs without causing a lot of trouble for your database.
Why CouchDB Matters:
CouchDB serves as the backbone of your data-driven applications, providing a reliable foundation for information management. Unlike traditional databases, CouchDB excels in handling unstructured data, offering flexibility that developers appreciate.
A Brief Overview of OpenTelemetry
OpenTelemetry is a set of APIs, SDKs, libraries, and integrations aiming to standardize the generation, collection, and management of telemetry data(logs, metrics, and traces). It is backed by the Cloud Native Computing Foundation and is the leading open-source project in the observability domain.
The data you collect with OpenTelemetry is vendor-agnostic and can be exported in many formats. Telemetry data has become critical in observing the state of distributed systems. With microservices and polyglot architectures, there was a need to have a global standard. OpenTelemetry aims to fill that space and is doing a great job at it thus far.
In this tutorial, you will use OpenTelemetry Collector to collect CouchDB metrics for performance monitoring.
What is OpenTelemetry Collector?
OpenTelemetry Collector is a stand-alone service provided by OpenTelemetry. It can be used as a telemetry-processing system with a lot of flexible configurations to collect and manage telemetry data.
It can understand different data formats and send it to different backends, making it a versatile tool for building observability solutions.
Read our complete guide on OpenTelemetry Collector
How does OpenTelemetry Collector collect data?
A receiver is how data gets into the OpenTelemetry Collector. Receivers are configured via YAML under the top-level receivers tag. There must be at least one enabled receiver for a configuration to be considered valid.
Here’s an example of an otlp receiver:
receivers:
  otlp:
    protocols:
      grpc:
      http:
An OTLP receiver can receive data via gRPC or HTTP using the OTLP format. There are advanced configurations that you can enable via the YAML file.
Here’s a sample configuration for an otlp receiver.
receivers:
  otlp:
    protocols:
      http:
        endpoint: "localhost:4318"
        cors:
          allowed_origins:
            - http://test.com
            # Origins can have wildcards with *, use * by itself to match any origin.
            - https://*.example.com
          allowed_headers:
            - Example-Header
          max_age: 7200
You can find more details on advanced configurations here.
After configuring a receiver, you must enable it. Receivers are enabled via pipelines within the service section. A pipeline consists of a set of receivers, processors, and exporters.
The following is an example pipeline configuration:
service:
  pipelines:
    metrics:
      receivers: [otlp, prometheus]
      exporters: [otlp, prometheus]
    traces:
      receivers: [otlp, jaeger]
      processors: [batch]
      exporters: [otlp, zipkin]
Now that you understand how OpenTelemetry collector collects data, let’s see how you can collect CouchDB metrics with OpenTelemetry.
Prerequisites
User for OpenTelemetry - The OpenTelemetry Collector for CouchDB requires select permissions to interact with the database and get stats out of it.
Open TCP port 5984 -
In this article, we assume that your CouchDB server and the OpenTelemetry Collector will reside on the same server. If this isn't the case, an additional step is required to open your CouchDB service port, traditionally using port 5984.
The OpenTelemetry Collector for CouchDB communicates with the databases over TCP port 5984. It's crucial to open this port for communication.
To open TCP port 5984 on a Linux server, utilize the following command:
sudo ufw allow 5984/tcp
If you're implementing a firewall for your VMs to manage inbound traffic, ensure that port 5984 is allowed there as well.
Once these preparations are complete, you're ready to proceed with installing and running the OpenTelemetry Collector for CouchDB.
Setting up SigNoz
You need a backend to which you can send the collected data for monitoring and visualization. SigNoz is an OpenTelemetry-native APM that is well-suited for visualizing OpenTelemetry data.
SigNoz cloud is the easiest way to run SigNoz. You can sign up here for a free account and get 30 days of unlimited access to all features.
You can also install and self-host SigNoz yourself. Check out the docs for installing self-host SigNoz.
Setting Up OpenTelemetry Collector
The OpenTelemetry Collector offers various deployment options to suit different environments and preferences. It can be deployed using Docker, Kubernetes, Nomad, or directly on Linux systems. You can find all the installation options here.
We are going to discuss the manual installation here and resolve any hiccups that come in the way.
Step 1 - Downloading OpenTelemetry Collector
Download the appropriate binary package for your Linux or macOS distribution from the OpenTelemetry Collector releases page. We are using the latest version available at the time of writing this tutorial.
For MACOS (arm64):
curl --proto '=https' --tlsv1.2 -fOL https://github.com/open-telemetry/opentelemetry-collector-releases/releases/download/v0.116.0/otelcol-contrib_0.116.0_darwin_arm64.tar.gz
Step 2 - Extracting the package
Create a new directory named otelcol-contrib and then extract the contents of the otelcol-contrib_0.116.0_darwin_arm64.tar.gz archive into this newly created directory with the following command:
mkdir otelcol-contrib && tar xvzf otelcol-contrib_0.116.0_darwin_arm64.tar.gz -C otelcol-contrib
Step 3 - Setting up the Configuration file
Create a config.yaml file in the otelcol-contrib folder. This configuration file will enable the collector to connect with CouchDB and have other settings, such as the frequency at which you want to monitor the instance.
The config file has a receiver enabled for hostmetrics too, which will enable you to
Go into the directory:
cd otelcol-contrib
Create config.yaml in folder otelcol-contrib with the below content in it.
receivers:
  hostmetrics:
    collection_interval: 30s
    scrapers:
      cpu: {}
      disk: {}
      load: {}
      filesystem: {}
      memory: {}
      network: {}
      paging: {}
      process:
        mute_process_name_error: true
        mute_process_exe_error: true
        mute_process_io_error: true
      processes: {}
  couchdb;
		endpoint: "<COUCHDB_URL>:<COUCHDB_PORT>"
		username: <COUCHDB_USERNAME>
		password: <COUCHDB_PASSWORD>
		collection_interval: 15s
processors:
  batch:
    send_batch_size: 1000
    timeout: 10s
  # Ref: https://github.com/open-telemetry/opentelemetry-collector-contrib/blob/main/processor/resourcedetectionprocessor/README.md
  resourcedetection:
    detectors: [env, system, ec2] # include ec2 for AWS, gcp for GCP and azure for Azure.
    # Using OTEL_RESOURCE_ATTRIBUTES envvar, env detector adds custom labels.
    timeout: 2s
		override: false
    system:
      hostname_sources: [os] # alternatively, use [dns,os] for setting FQDN as host.name and os as fallback
exporters:
  otlp:
    endpoint: "ingest.{region}.signoz.cloud:443" # replace {region} with your region
    tls:
      insecure: false
    headers:
      "signoz-ingestion-key": <SIGNOZ_INGESTION_KEY>
  debug:
    verbosity: detailed
service:
  telemetry:
    metrics:
      address: localhost:8888
  pipelines:
    metrics:
      receivers: [couchdb]
      processors: [batch]
      exporters: [otlp]
    metrics/hostmetrics:
      receivers: [hostmetrics]
      processors: [resourcedetection, batch]
      exporters: [otlp]
You would need to replace the following details for the config to work properly:
- Endpoint for your CouchDB instance. In place of COUCHDB_URL and port in place of COUCHDB_PORT
- Username & Password of the new user were created in prerequisite steps by replacing COUCHDB_USERNAME & COUCHDB_PASSWORD
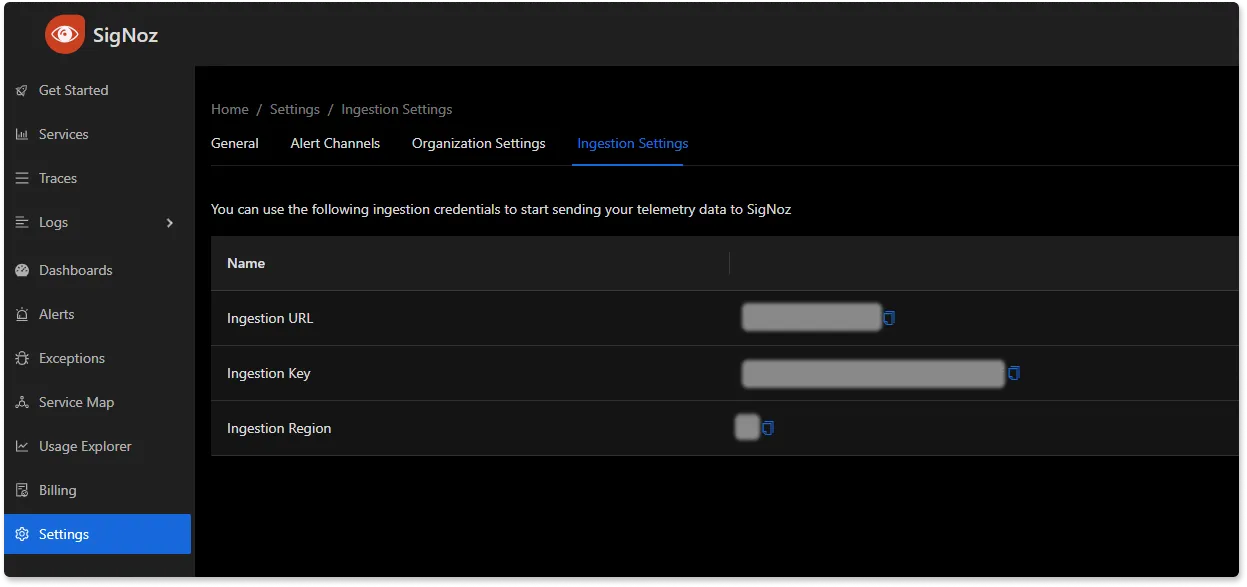
- Under exporters, configure the
endpointfor SigNoz cloud along with the ingestion key undersignoz-ingestion-key. You can find these settings in the SigNoz dashboard.
Also, note how we have set up the pipeline in the service section of the config. We have added couchdb in the receiver section of metrics and set the exporter to otlp.
Step 4 - Running the collector service
Every Collector release includes an otelcol executable that you can run. Since we’re done with configurations, we can now run the collector service with the following command.
From the otelcol-contrib, run the following command:
./otelcol-contrib --config ./config.yaml
If you want to run it in the background:
./otelcol-contrib --config ./config.yaml &> otelcol-output.log & echo "$\!" > otel-pid
Step 5 - Debugging the output
If you want to see the output of the logs, we’ve just set up for the background process. You may look it up with:
tail -f -n 50 otelcol-output.log
tail 50 will give the last 50 lines from the file otelcol-output.log
You can check if your service is running successfully by seeing the last log something like -
2023-11-17T19:33:20.161Z info service@v0.116.0/service.go:169 Everything is ready. Begin running and processing data.
You can stop the collector service with the following command:
kill "$(< otel-pid)"
Monitoring with SigNoz Dashboard
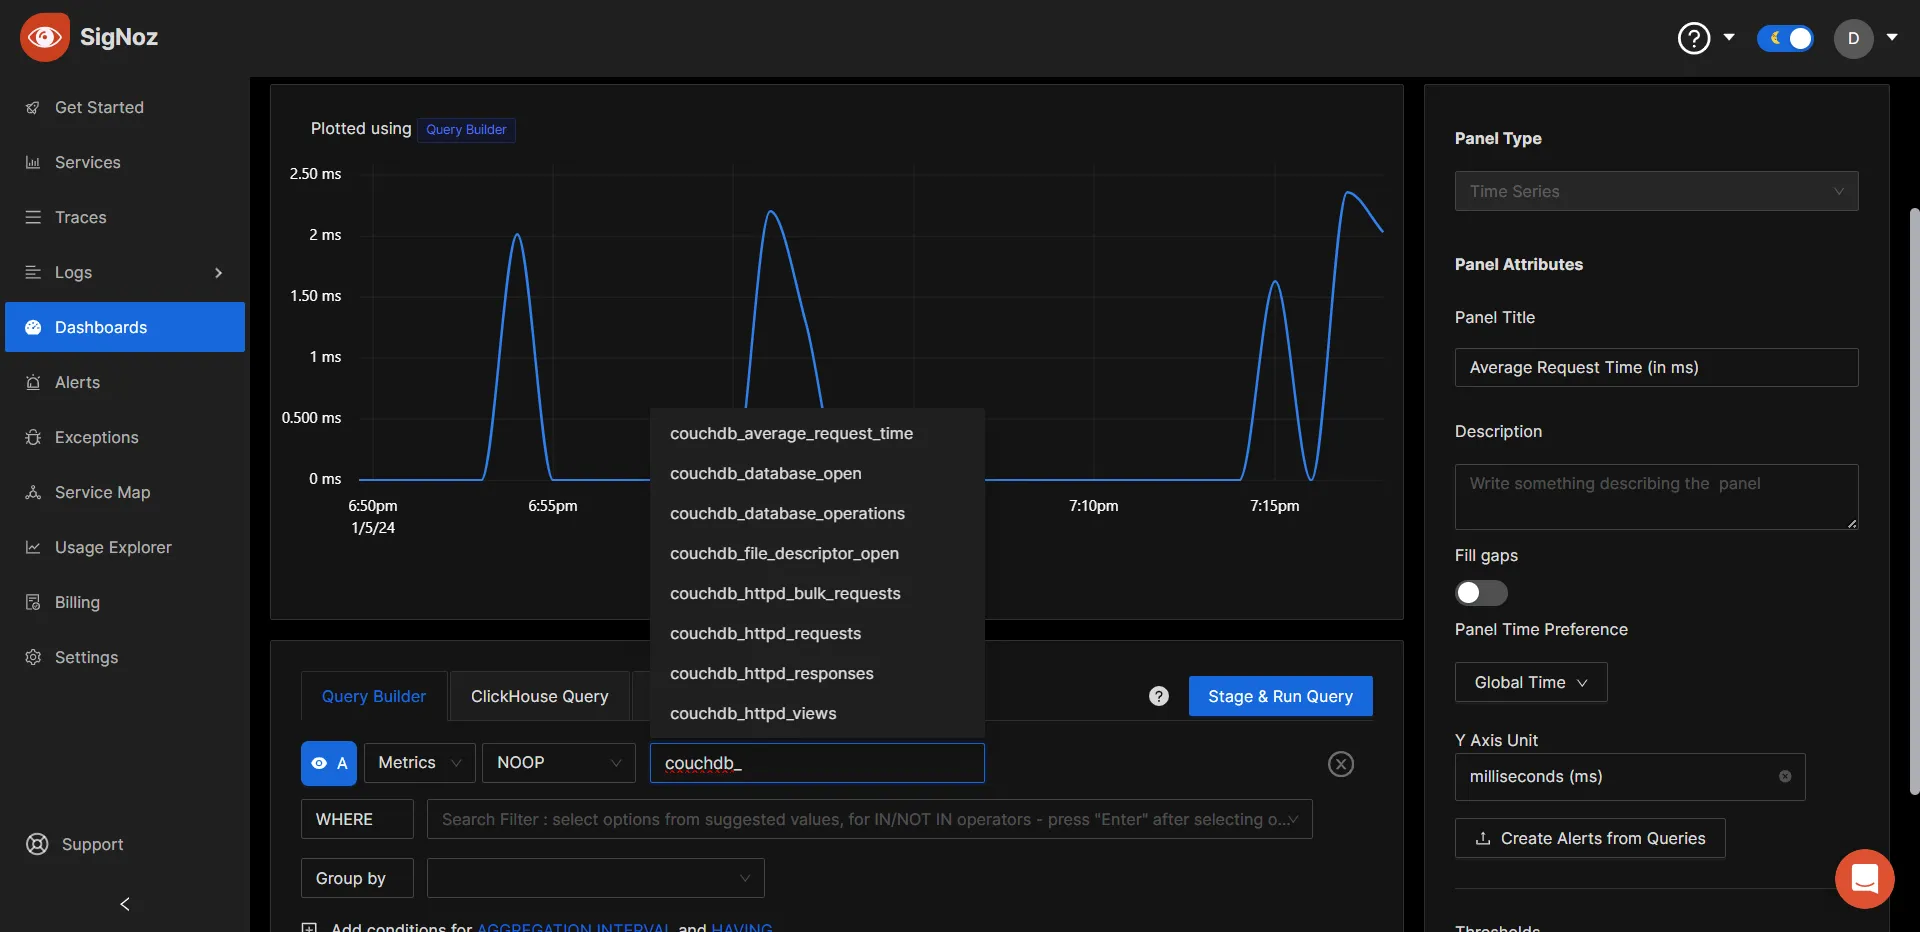
Once the above setup is done, you will be able to access the metrics in the SigNoz dashboard. You can go to the Dashboards tab and try adding a new panel. You can learn how to create dashboards in SigNoz here.
CouchDB Metrics
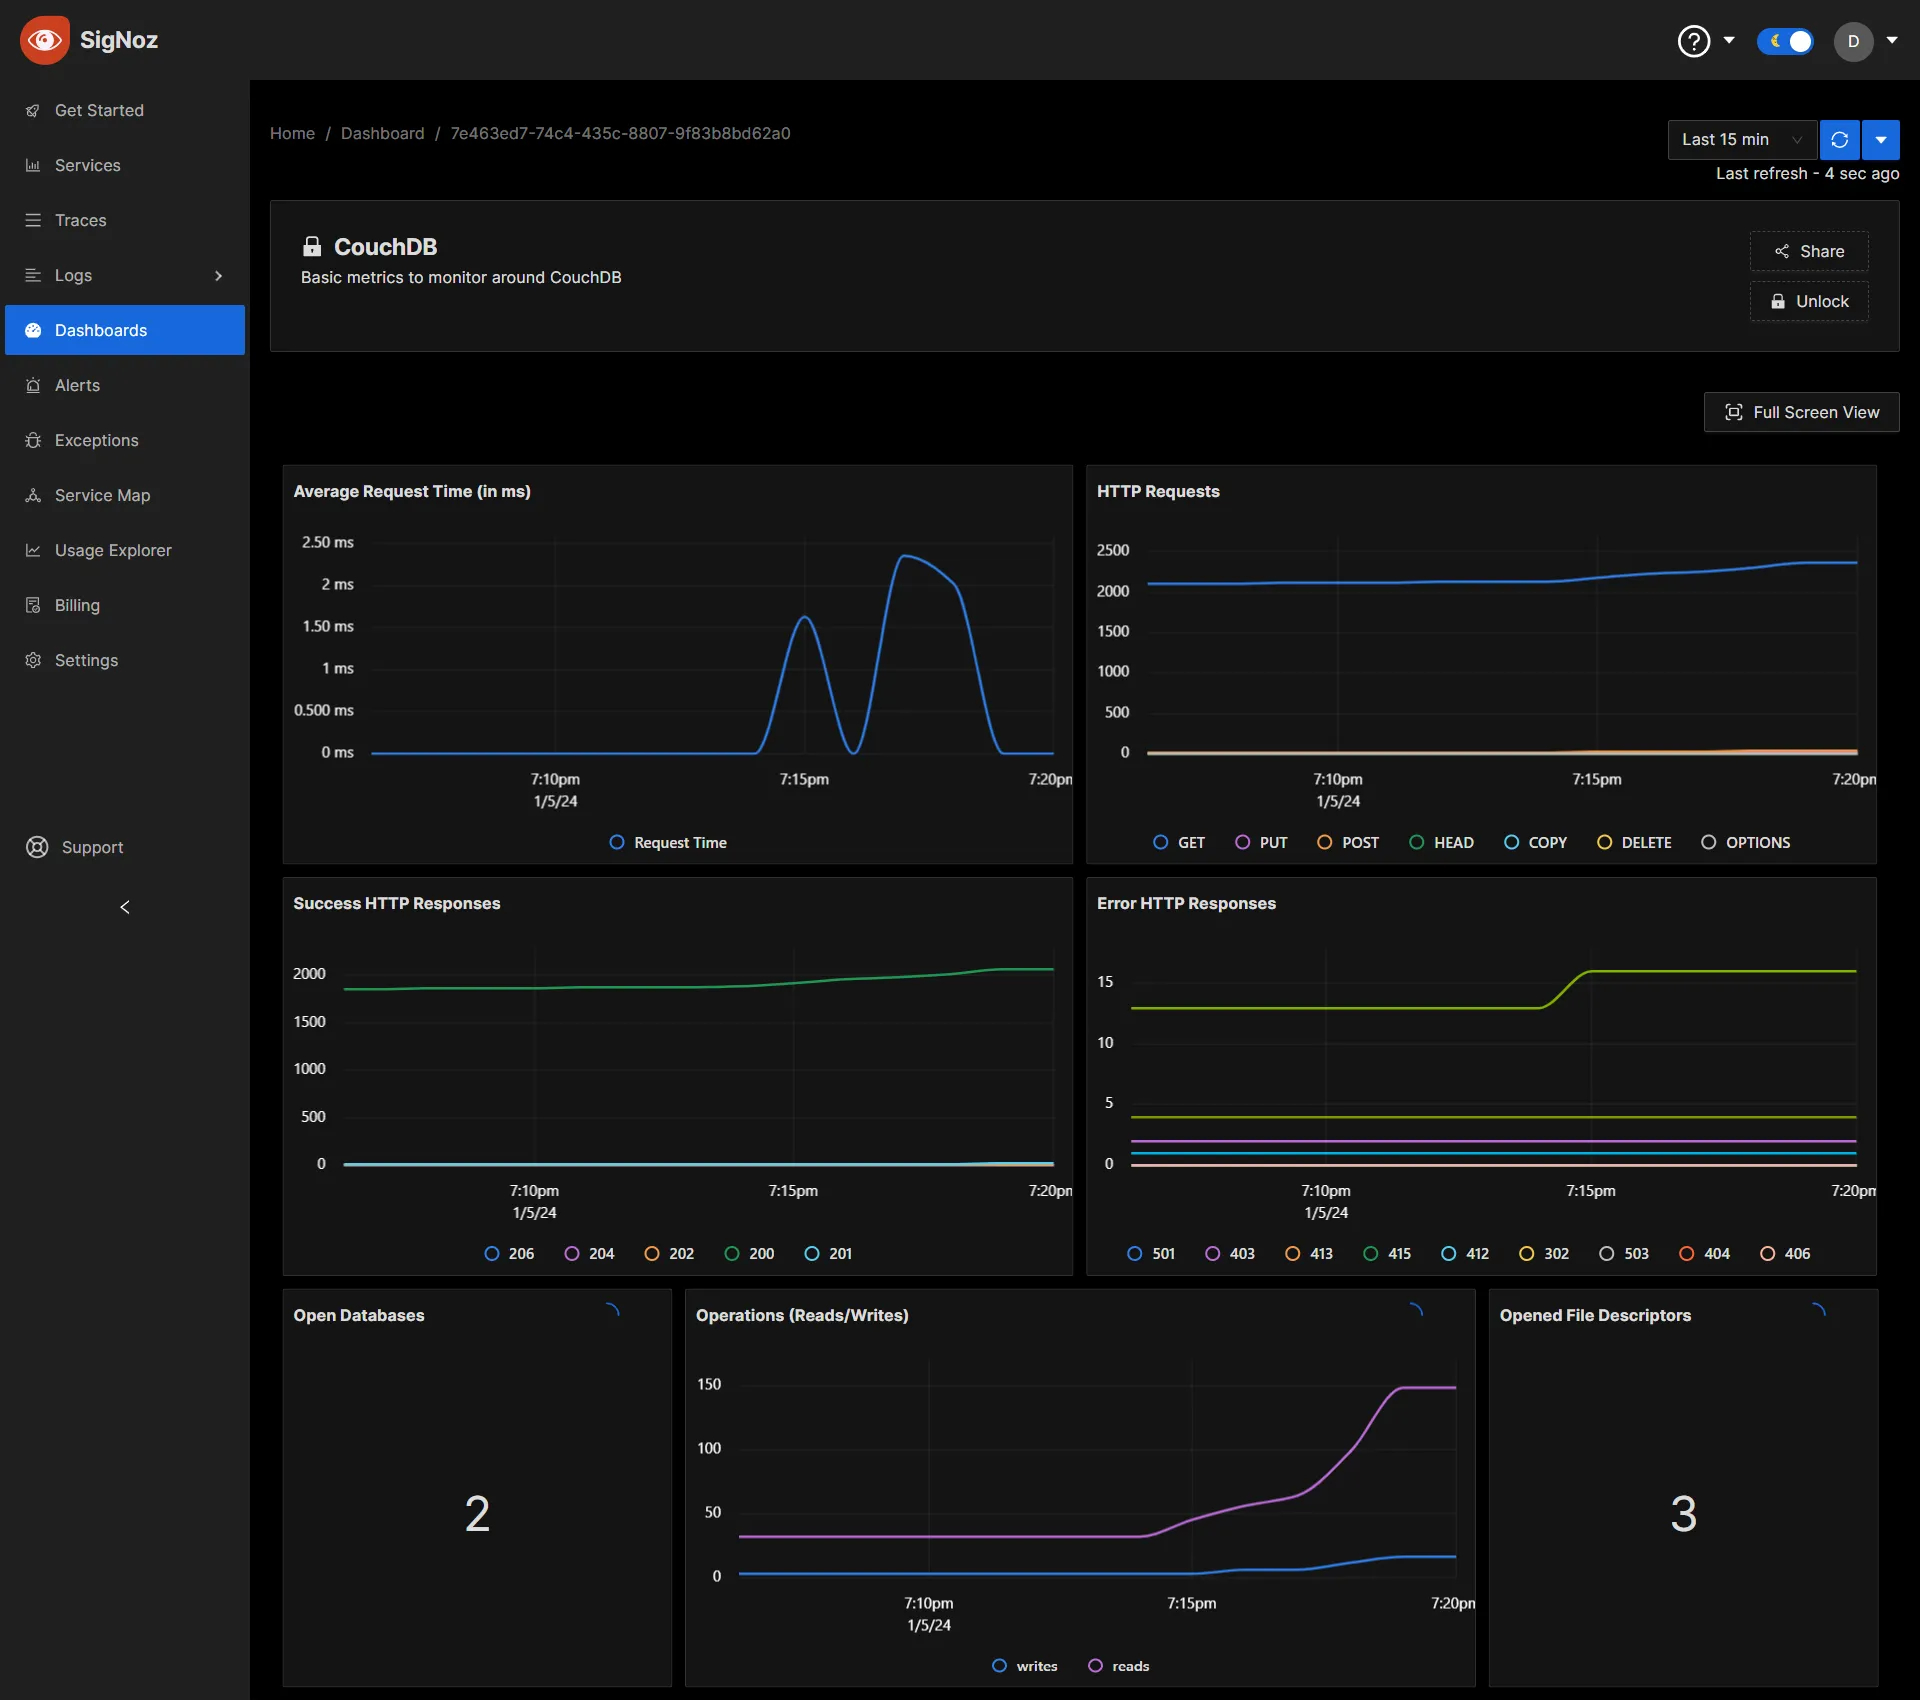
Dashboard JSON
For basic metrics, we’ve created a JSON file that you can upload to create a dashboard with basic metrics like this:
Metrics & Attributes for CouchDB supported by OpenTelemetry
The following metrics and resource attributes for CouchDB can be collected by the Opentelemetry Collector.
Metrics
These metrics are enabled by default. Collectors provide many metrics that you can use to monitor how your CouchCB server is performing or if something is not right.
| Metric | Description | Name | Type | Value Type | Unit | Temporality | Monotonic |
|---|---|---|---|---|---|---|---|
| Average request time | The average duration of a served request. | couchdb.average_request_time | GAUGE | DOUBLE | MilliSeconds (ms) | N/A | false |
| Bulk Requests Count | The number of bulk requests. | couchdb.httpd.bulk_requests | SUM | INT | NONE | Cumulative | true |
| HTTP Requests Count | The number of HTTP requests by method. | couchdb.httpd.requests | SUM | INT | NONE | Cumulative | true |
| HTTP Status Code Responses Count | The number of each HTTP status code. | couchdb.httpd.responses | SUM | INT | NONE | Cumulative | true |
| HTTP Views Count | The number of views read. | couchdb.httpd.views | SUM | INT | NONE | Cumulative | true |
| Opened Databases | The number of open databases. | couchdb.database.open | SUM | INT | NONE | Cumulative | false |
| Open File Descriptors Count | The number of open file descriptors. | couchdb.file_descriptor.open | SUM | INT | NONE | Cumulative | false |
| Database Operations | The number of database operations. | couchdb.database.operations | SUM | INT | NONE | Cumulative | true |
Attributes
| Metric | Attribute | Description | Value Type | Values |
|---|---|---|---|---|
| HTTP Requests Count | http.method | An HTTP request method. | STRING | COPY, DELETE, GET, HEAD, OPTIONS, POST, PUT |
| HTTP Status Code Responses Count | http.status_code | An HTTP status code. | STRING | |
| HTTP Views Count | view | The view type. | STRING | temporary_view_reads, view_reads |
| Database Operations | operation | The operation type. | STRING | writes, reads |
| Host Metrics | couchdb.node.name | The name of the node. | STRING |
Key Terms for Metrics & Attributes
Name: The name of the metric is a unique identifier that distinguishes it from other metrics. It helps in referencing and organizing various metrics on SigNoz as well.
Type: The type of metric defines the kind of data it represents. Common metric types include INT, DOUBLE, STRING, etc.
Unit: The unit specifies the measurement unit associated with the metric. It helps in interpreting and comparing metric values, including Bytes, NONE, etc.
Temporality: It involves understanding the temporal patterns and fluctuations within the data, providing insights into how the metric evolves over time. Temporality is crucial for analyzing trends, identifying patterns, and making informed decisions based on the temporal behavior of the observed metric.
Monotonicity: It refers to the cumulative nature of a metric, indicating that its values continuously increase or remain non-decreasing over time. This property is crucial for tracking cumulative values, such as the total count of events or occurrences.
These are the currently supported metrics at the time the article is written. Check the OpenTelemetry Collector Contrib repo for any updates.
Conclusion
In this article, we’ve discussed a 101 guide to start monitoring CouchDB metrics using Signoz and OpenTelemetry. But your journey doesn't have to end here. The world of monitoring and observability is vast and ever-evolving. Dive deeper, explore advanced metrics, and fine-tune your monitoring setup to fit your specific needs. This is where the magic happens, where you turn data into insights that drive better decisions and improved system performance.
Visit our complete guide on OpenTelemetry Collector to learn more about it. OpenTelemetry is quietly becoming the world standard for open-source observability, and by using it, you can have advantages like a single standard for all telemetry signals, no vendor lock-in, etc.
SigNoz is an open-source OpenTelemetry-native APM that can be used as a single backend for all your observability needs.
Further Reading
