OpenTelemetry .NET | Monitor a .NET application with OpenTelemetry
C# (pronounced C-Sharp) is a simple, modern, object-oriented, and type-safe programming language. ASP.NET is one of the top frameworks for building modern applications using C#, F#, or Visual Basic.

OpenTelemetry is one of the popular CNCF projects. Some other notable projects under CNCF include Kubernetes, Helm, and Fluentd. The OpenTelemetry project aims to create an open source web standard for instrumenting cloud-native applications.
With cloud computing and containerization, there has been a rapid rise in applications with distributed systems. Distributed architectures like microservices and serverless have many benefits like on-demand scaling, but they also come with operational and troubleshooting complexities.
A robust monitoring and observability framework is needed to simplify complex cloud-native environments. One of the major challenges of setting up this framework is instrumenting a distributed application. OpenTelemetry helps solve this challenge by providing a uniform instrumentation layer. It generates three core signals from applications:
- Traces: Insights about the traffic across the services
- Metrics: Insights on performance & resource consumption
- Logs: How the code is executing with the help of errors/exceptions
OpenTelemetry is used to generate and collect the telemetry data(traces, metrics, and logs), but it does not provide storage and visualization of collected data. OpenTelemetry provides you the freedom to choose a backend analysis tool. And that’s where SigNoz comes into the picture.
SigNoz & OpenTelemetry
SigNoz is a full-stack open-source application monitoring and observability platform which can be installed within your infra. It provides metrics monitoring, distributed tracing, exceptions monitoring, and custom dashboards - everything under a single pane of glass. You can also set alerts on your critical metrics to keep yourself notified.
SigNoz is built to natively support OpenTelemerty, thus making it a great choice for the OpenTelemetry backend.
Now let’s get down to see how to instrument a .NET application with OpenTelemetry and then visualize the data with SigNoz.
We will divide the tutorial into the following parts:
- Installing SigNoz
- Instrumenting a sample ASP.NET 6 MVC web app for traces
- Instrumenting .NET application for metrics
- Exception Logging
Installing SigNoz
SigNoz can be installed on macOS or Linux computers in just three steps by using a simple installation script.
The install script automatically installs Docker Engine on Linux. However, on macOS, you must manually install Docker Engine before running the install script.
git clone -b main https://github.com/SigNoz/signoz.git
cd signoz/deploy/
./install.sh
You can visit our documentation for instructions on how to install SigNoz using Docker Swarm and Helm Charts.

When you are done installing SigNoz, you can access the UI at http://localhost:3301/application
OpenTelemetry .NET instrumentation for tracing
Step 1: Create new .NET MVC project
dotnet new mvc -n Org.MyWebApp --no-https
Step 2: Install OpenTelemetry Packages
cd Org.MyWebApp
dotnet add package OpenTelemetry.Extensions.Hosting --prerelease
dotnet add package OpenTelemetry.Instrumentation.AspNetCore --prerelease
dotnet add package OpenTelemetry.Exporter.OpenTelemetryProtocol --prerelease
Step 3: Configure OpenTelemetry
You need to set the endpoint of SigNoz in this code snippet. If you have installed SigNoz in your local, then the endpoint is http://localhost:4317.
using OpenTelemetry.Resources;
using OpenTelemetry.Trace;

...
builder.Services.AddOpenTelemetryTracing(budiler =>
    {
        budiler
            .AddAspNetCoreInstrumentation()
            .SetResourceBuilder(ResourceBuilder.CreateDefault()
                .AddService("MyWebApp")
                .AddTelemetrySdk()
            )
            .AddOtlpExporter(options =>
            {
                options.Endpoint = new Uri("http://localhost:4317"); // Signoz Endpoint
            });
    });

var app = builder.Build();
...
Step 4: Run the .NET app
dotnet run
Step 5: Monitor traces of your .NET application
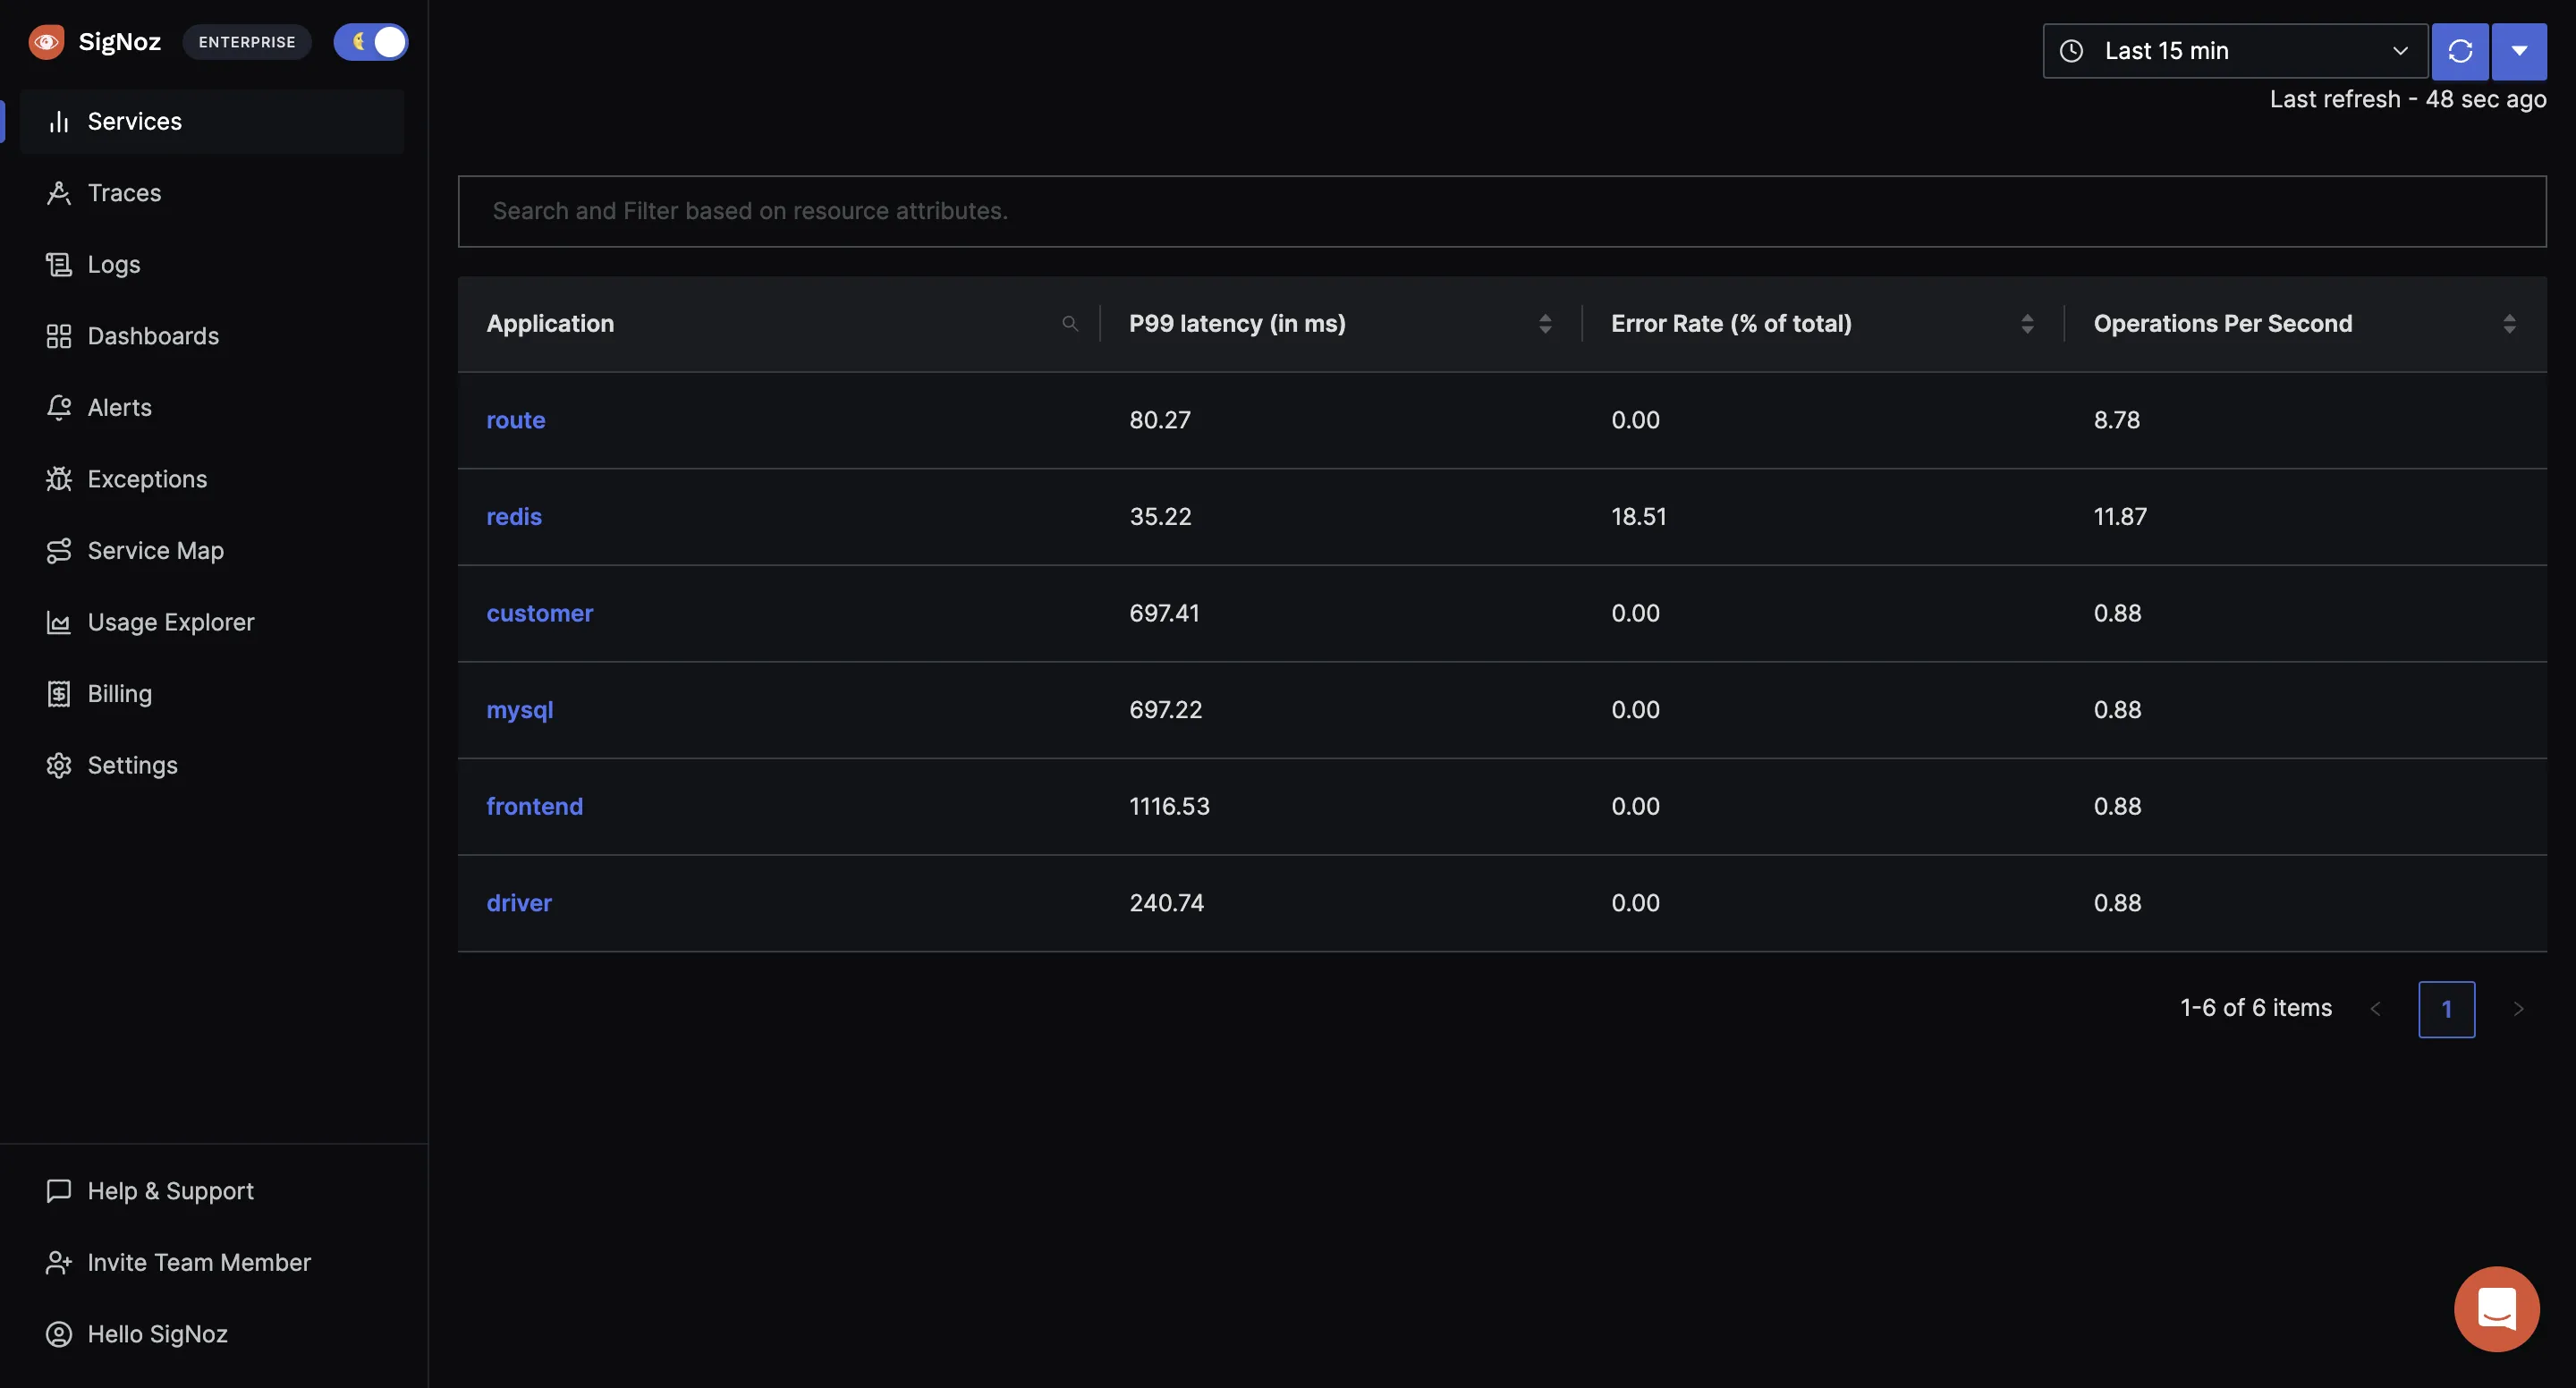
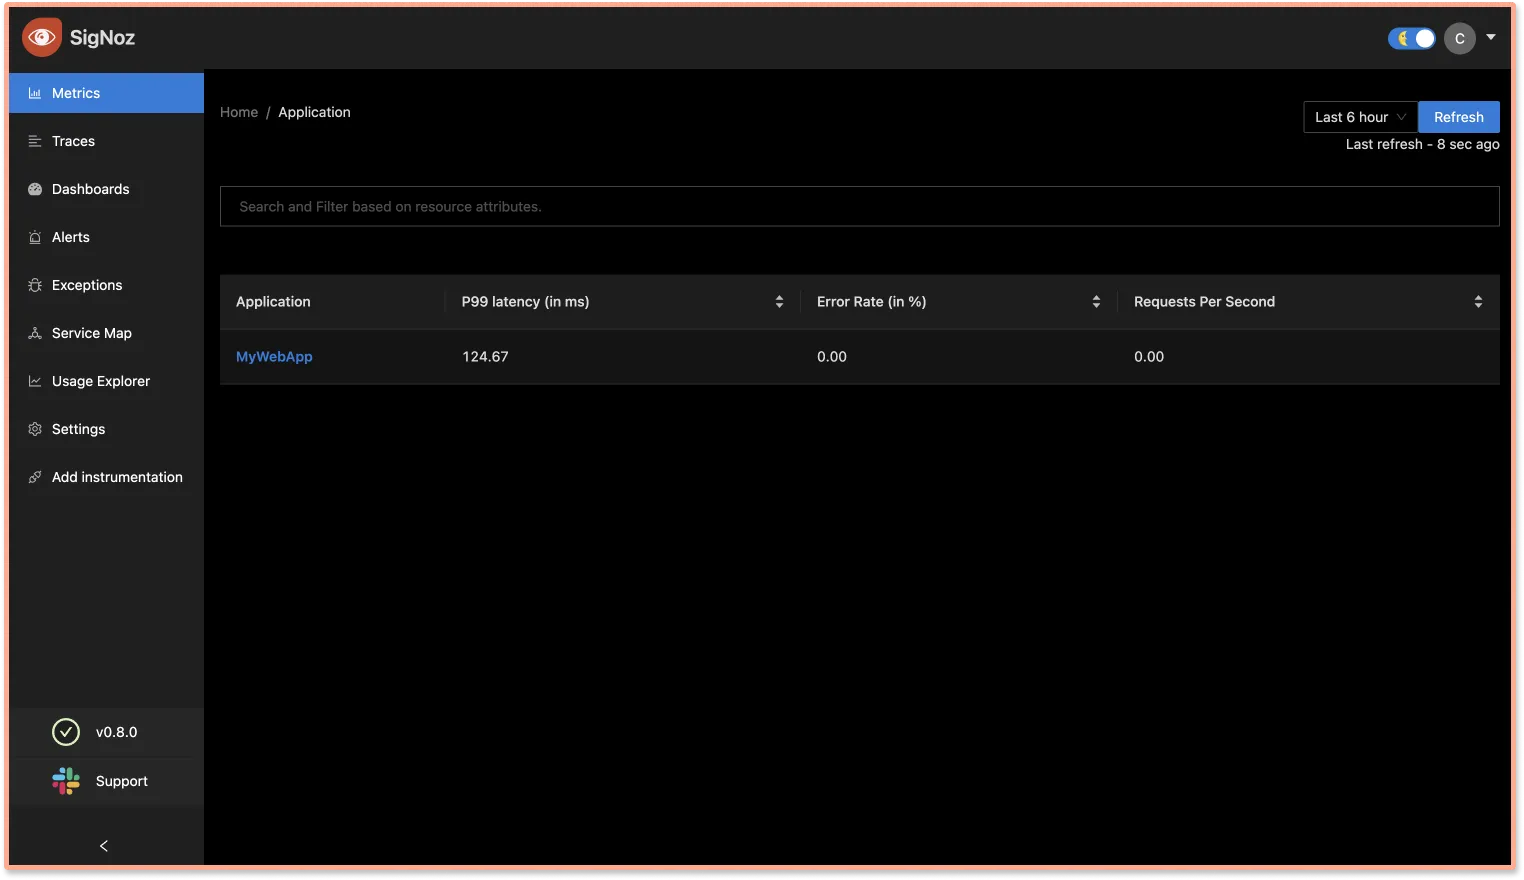
Visit application localhost:<port>/ and then visit SigNoz dashboard http://localhost:3301/application to see your .NET application being monitored on the SigNoz dashboard.
Please ensure that you have generated some dummy data by calling your application’s endpoints multiple times in order to see the application on SigNoz.
You can then visit the traces tab to see traces from your .NET application.
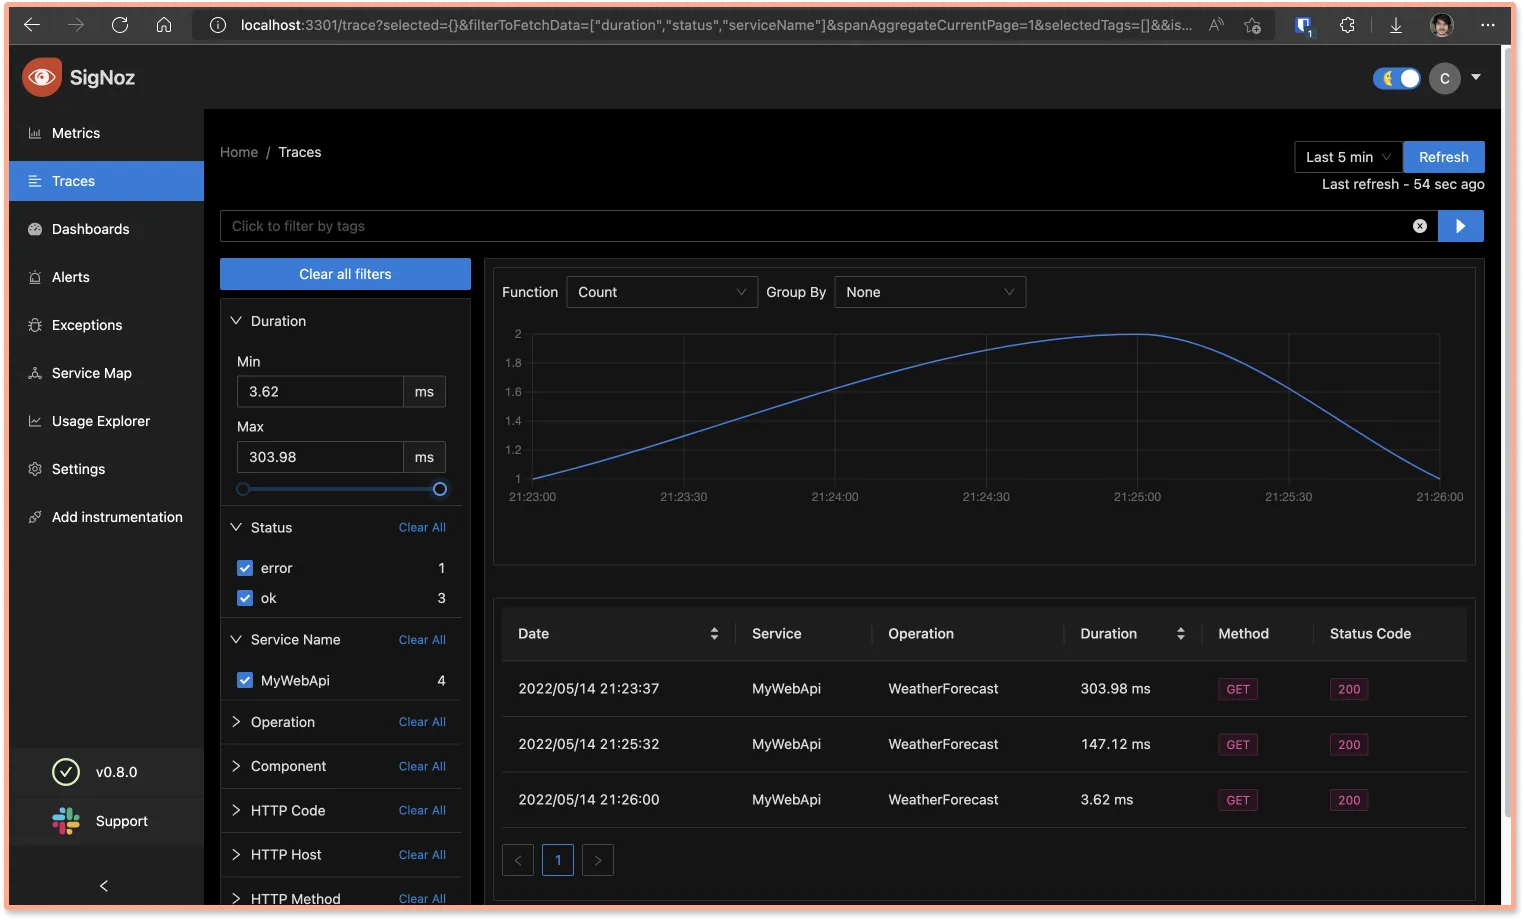
The traces tab of SigNoz lets you analyze your tracing data with filters and aggregates
OpenTelemetry .NET instrumentation for Metrics
Below are the few major types of metrics that are used commonly for application monitoring:
- Counter
Instrument non-negative increments, eg: no of bytes received, no of users created. - Histogram
Instrument arbitrary values that are likely to be statistically meaningful, eg: request duration, size of response payload. - Gauge
Instrument non-additive values with time, eg: room temperature, no of running tasks.
To illustrate how to collect metrics with OpenTelemetry, let’s create a timed background service.
Step: 1: Create worker app
dotnet new worker -n Org.Worker
cd Org.Worker
Step 2: Modify Worker.cs
using System.Diagnostics;
using System.Diagnostics.Metrics;
namespace Org.Worker;
public class Worker : IHostedService, IDisposable
{
    private readonly ILogger<Worker> _logger;
    private Timer? _timer = null;

    public Worker(ILogger<Worker> logger)
    {
        _logger = logger;
    }

    public Task StartAsync(CancellationToken stoppingToken)
    {
        _logger.LogInformation("Timed Hosted Service running.");

        _timer = new Timer(DoWork, null, TimeSpan.Zero,
            TimeSpan.FromSeconds(5));

        return Task.CompletedTask;
    }

    private void DoWork(object? state)
    {
        _logger.LogInformation("Timed Hosted Service is working.");
    }

    public Task StopAsync(CancellationToken stoppingToken)
    {
        _logger.LogInformation("Timed Hosted Service is stopping.");

        _timer?.Change(Timeout.Infinite, 0);

        return Task.CompletedTask;
    }

    public void Dispose()
    {
        _timer?.Dispose();
    }
}
Step 3: Install OpenTelemetry Packages
dotnet add package OpenTelemetry.Extensions.Hosting --prerelease
dotnet add package OpenTelemetry.Exporter.OpenTelemetryProtocol --prerelease
Step 4: Configure OpenTelemetry Metrics in Program.cs
using OpenTelemetry.Metrics;
using OpenTelemetry.Resources;
...
services.AddOpenTelemetryMetrics(options =>
{
    options
        .SetResourceBuilder(ResourceBuilder.CreateDefault()
            .AddService("Worker")
            .AddEnvironmentVariableDetector()
            .AddTelemetrySdk()
        )
        .AddOtlpExporter(options =>
        {
            options.Endpoint = new Uri("http://localhost:4317");
        });
});
...
Step 5: Create Meter & Counters
...
private static Counter<int> _noOfRunsCounter;
private static Histogram<float> _timeTakenHistogram;
private static readonly Meter _baseMeter = new("WorkerMeter", "22.05");
...
public Worker(ILogger<Worker> logger)
{
...
	_noOfRunsCounter = _baseMeter.CreateCounter<int>("NoOfRuns");
	_timeTakenHistogram = _baseMeter.CreateHistogram<float>("TimeTaken", "ms");
	_baseMeter.CreateObservableGauge("ThreadCount", () => ThreadPool.ThreadCount);
...
}
Step 6: Update Counters
private void DoWork(object? state)
{
		// Basic Counter metric increment
    _noOfRunsCounter.Add(1);

		// Sleeping for random seconds
    _timer.Change(Timeout.Infinite, Timeout.Infinite);
    var stopwatch = Stopwatch.StartNew();
    var randomValue = new Random().Next(2, 10);
    Thread.Sleep(TimeSpan.FromSeconds(randomValue));
    stopwatch.Stop();

		// Recording Historgram Counter
    _timeTakenHistogram.Record(stopwatch.ElapsedMilliseconds);

    _logger.LogInformation($"Timed Hosted Service sleeping for {randomValue} seconds");
    _timer.Change(TimeSpan.FromSeconds(1), TimeSpan.FromSeconds(1));
}
Step 7: Visit SigNoz dashboard http://localhost:3301/dashboard and click on new Dashboard
Set Name of the dashboard
For Counter: Click on Add
Valuewidget and enterNoOfRunsin PromQL query, and save the widgetFor Gauge: Now click on time-series widget, enter
ThreadCountin PromQL query, and save the widgetFor Histogram: Click on time-series widget, enter
TimeTaken_bucketin PromQL query, and save the widget. Other values which can be viewedTimeTaken_sumandTimeTaken_count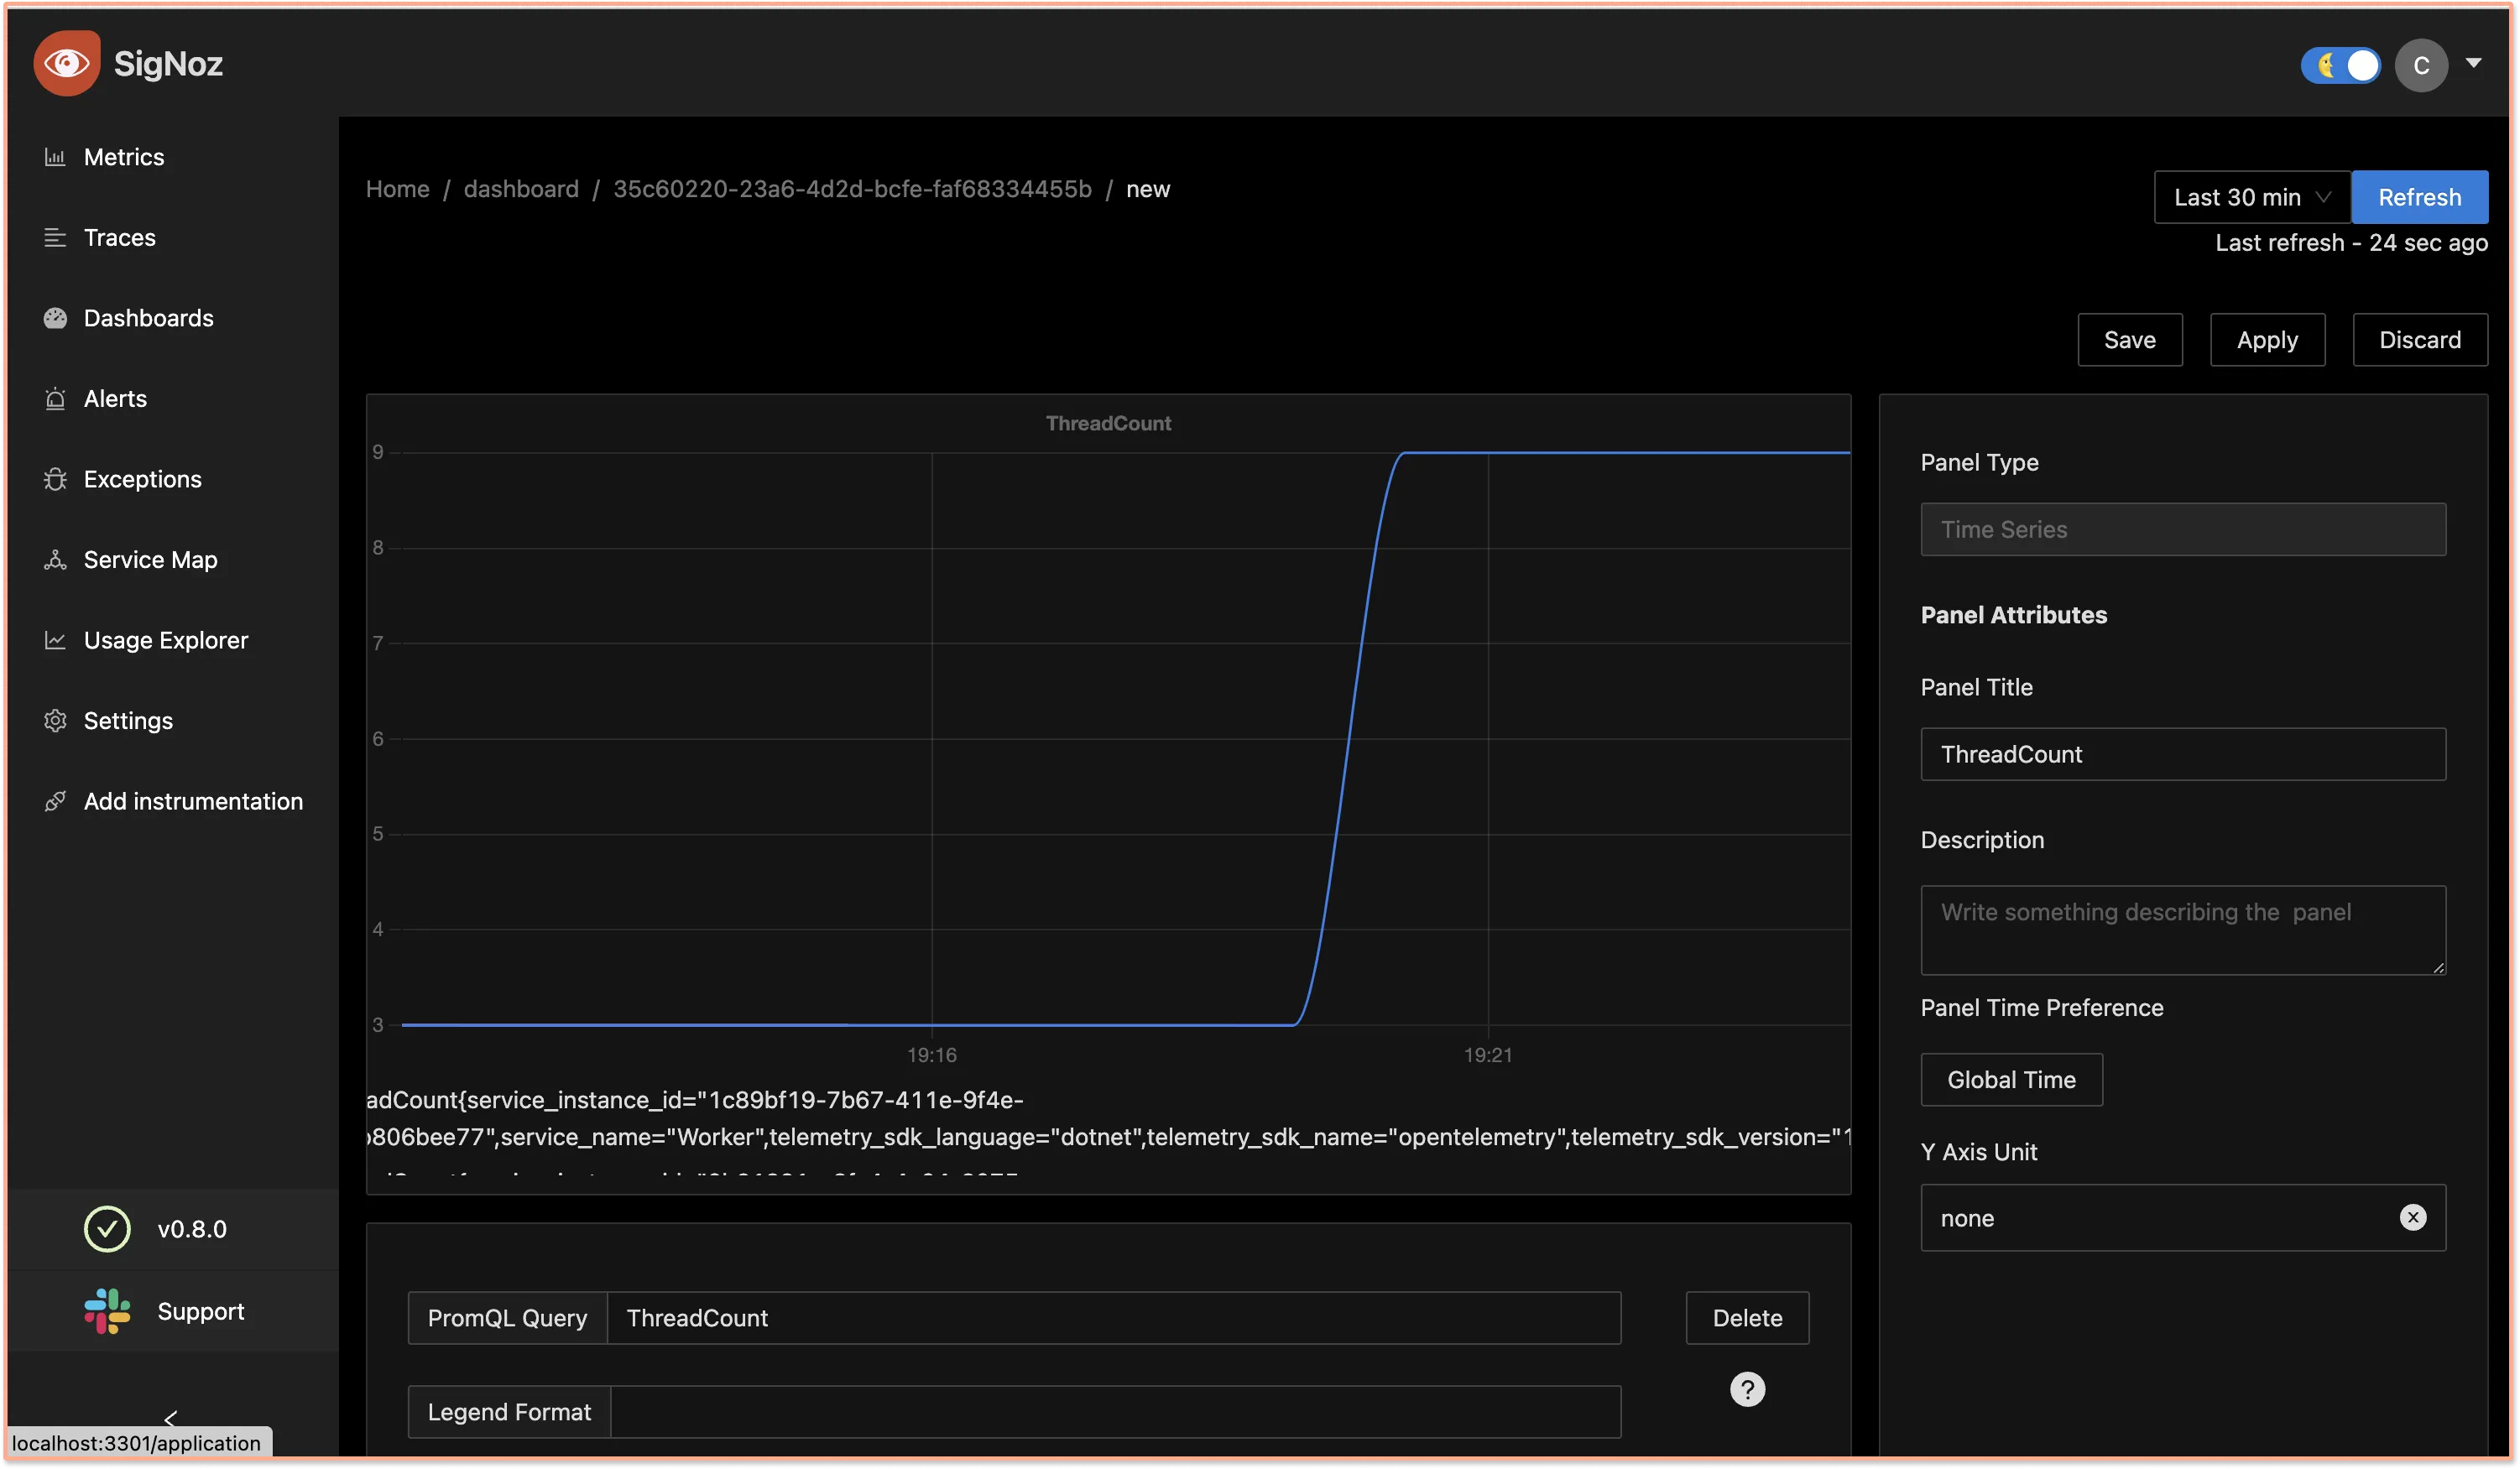
Sample Gauge metrics on SigNoz dashboard
OpenTelemetry .NET instrumentation for Logs
Step 1: Create .NET Core Web API
dotnet new webapi -n Org.WebAPI --no-https
cd Org.WebAPI
Step 2: Install OpenTelemetry Packages
dotnet add package OpenTelemetry.Extensions.Hosting --prerelease
dotnet add package OpenTelemetry.Instrumentation.AspNetCore --prerelease
dotnet add package OpenTelemetry.Exporter.OpenTelemetryProtocol --prerelease
Step 3: Configure Open Telemetry as Logging Provider
builder.Services.AddOpenTelemetryTracing(budiler =>
{
    budiler
        .AddAspNetCoreInstrumentation(opt =>
        {
            opt.RecordException = true;
        })
        .SetResourceBuilder(ResourceBuilder.CreateDefault()
            .AddService("Org.WebAPI")
            .AddTelemetrySdk()
        )
        .SetErrorStatusOnException(true)
        .AddOtlpExporter(options =>
        {
            options.Endpoint = new Uri("http://localhost:4317"); // Signoz Endpoint
        });
});
Step 4: Let’s create a custom error in Controllers/WeatherForcastController.cs
[HttpGet(Name = "GetWeatherForecast")]
public IEnumerable<WeatherForecast> Get()
{
		throw new Exception("Global Warming");
		...
}
Step 5: Visit http://localhost:3301/errors to view errors
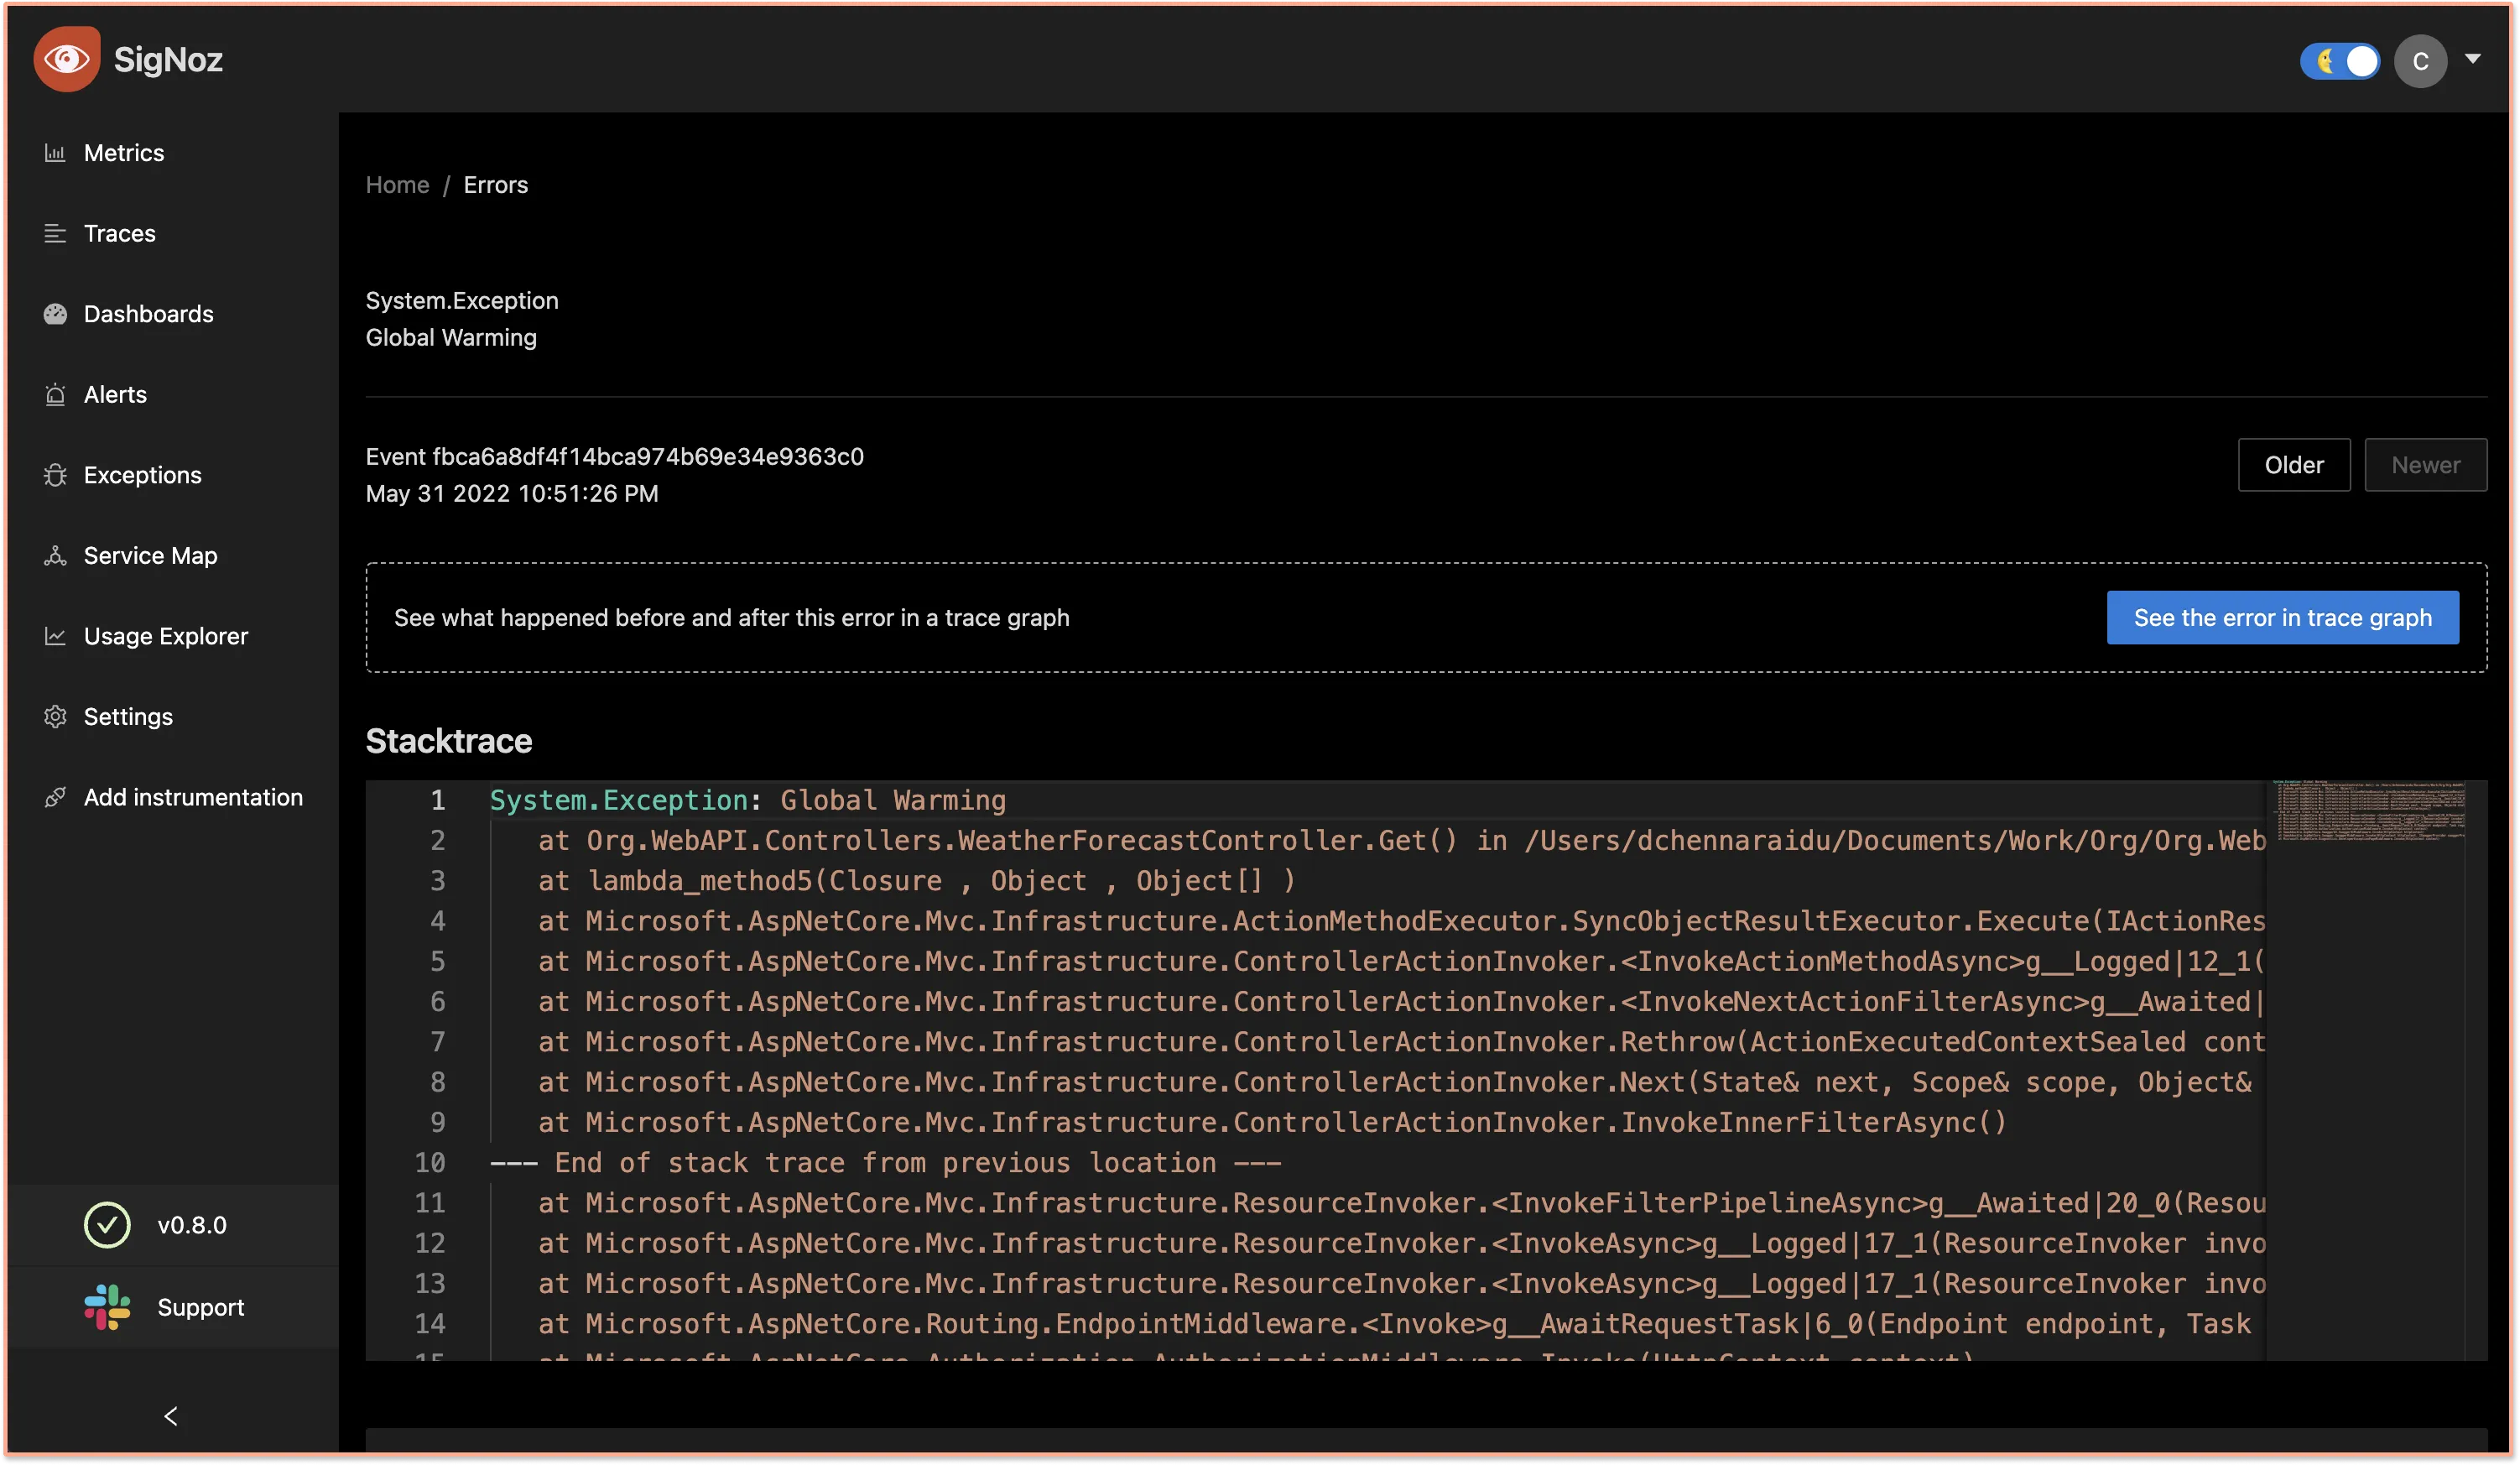
You can find the code sample used in the tutorial at this GitHub repo.
Conclusion
Using OpenTelemetry .NET client libraries, you can instrument your .NET applications for generating logs, metrics, and traces. You can then use an open-source APM tool like SigNoz to store and visualize the collected telemetry data.
OpenTelemetry is the future for setting up observability for cloud-native apps. It is backed by a huge community and covers a wide variety of technology and frameworks. Using OpenTelemetry, engineering teams can instrument polyglot and distributed applications with peace of mind.
SigNoz is an open-source observability tool that comes with a SaaS-like experience. You can try out SigNoz by visiting its GitHub repo 👇
If you are someone who understands more from video, then you can watch the below video tutorial on the same with SigNoz.
If you have any questions or need any help in setting things up, join our slack community and ping us in #support channel.

Further Reading
