Monitoring apps based on Falcon Web Framework with OpenTelemetry
Falcon is a minimalist Python web API framework for building robust applications and microservices. It also compliments many other Python frameworks by providing extra reliability, flexibility, and performance. Using OpenTelemetry, you can monitor your Falcon applications for performance by collecting telemetry signals like traces.

Instrumentation is the biggest challenge engineering teams face when starting out with monitoring their application performance. OpenTelemetry is the leading open-source standard that is solving the problem of instrumentation. It is currently an incubating project under the Cloud Native Computing Foundation.
It is a set of tools, APIs, and SDKs used to instrument applications to create and manage telemetry data(Logs, metrics, and traces). It aims to make telemetry data(logs, metrics, and traces) a built-in feature of cloud-native software applications.
One of the biggest advantages of using OpenTelemetry is that it is vendor-agnostic. It can export data in multiple formats which you can send to a backend of your choice.
In this article, we will use SigNoz as a backend. SigNoz is an open-source APM tool that can be used for both metrics and distributed tracing.
Let's get started and see how to use OpenTelemetry for a Falcon application.
Running a Falcon application with OpenTelemetry
OpenTelemetry is a great choice to instrument ASGI frameworks. As it is open-source and vendor-agnostic, the data can be sent to any backend of your choice.
Setting up SigNoz
You need a backend to which you can send the collected data for monitoring and visualization. SigNoz is an OpenTelemetry-native APM that is well-suited for visualizing OpenTelemetry data.
SigNoz cloud is the easiest way to run SigNoz. You can sign up here for a free account and get 30 days of unlimited access to all features.

You can also install and self-host SigNoz yourself. Check out the docs for installing self-host SigNoz.
Instrumenting a sample Falcon application with OpenTelemetry
Prerequisites
- Python 3.8 or newer
Download the latest version of Python.
- Redis
For Mac users
brew install redis
brew services start redis
For Ubuntu users
sudo apt install redis-server
You can also checkout Redis installation guide for installing Redis on different Operating Systems.
Step 1. Running sample Falcon app
We will be using the Falcon app at this Github repo. All the required OpenTelemetry packages are contained within the base.txt file under requirements folder in this sample app.
git clone https://github.com/SigNoz/python-falcon-template.git
cd python-falcon-template
It’s a good practice to create virtual environments for running Python apps, so we will be using a virtual python environment for this sample Falcon app.
Create a Virtual Environment
python3 -m venv .venv
source .venv/bin/activate
Step 2. Run instructions for sending data to SigNoz
The base.txt file contains all the necessary OpenTelemetry and Python packages needed for instrumentation. In order to install those packages, run the following command:
python -m pip install -r requirements/base.txt
The dependencies included are briefly explained below:
opentelemetry-distro - The distro provides a mechanism to automatically configure some of the more common options for users. It helps to get started with OpenTelemetry auto-instrumentation quickly.
opentelemetry-exporter-otlp - This library provides a way to install all OTLP exporters. You will need an exporter to send the data to SigNoz.
💡 The opentelemetry-exporter-otlp is a convenient wrapper package to install all OTLP exporters. Currently, it installs:
opentelemetry-exporter-otlp-proto-http
opentelemetry-exporter-otlp-proto-grpc
(soon) opentelemetry-exporter-otlp-json-http
The opentelemetry-exporter-otlp-proto-grpc package installs the gRPC exporter which depends on the grpcio package. The installation of grpcio may fail on some platforms for various reasons. If you run into such issues, or you don't want to use gRPC, you can install the HTTP exporter instead by installing the opentelemetry-exporter-otlp-proto-http package. You need to set the OTEL_EXPORTER_OTLP_PROTOCOL environment variable to http/protobuf to use the HTTP exporter.
Step 3. Install application specific packages
This step is required to install packages specific to the application. This command figures out which instrumentation packages the user might want to install and installs it for them:
opentelemetry-bootstrap --action=install
Please make sure that you have installed all the dependencies of your application before running the above command. The command will not install instrumentation for the dependencies which are not installed.
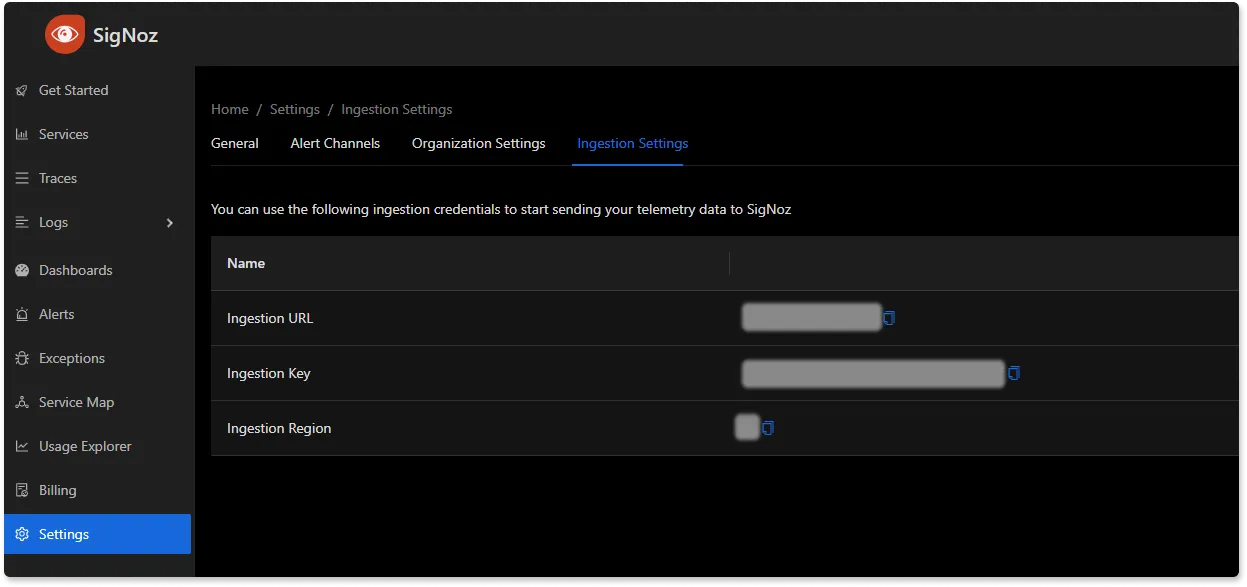
Step 4. Configure environment variables to run app and send data to SigNoz
You're almost done. In the last step, you just need to configure a few environment variables for your OTLP exporters. Environment variables that need to be configured:
OTEL_RESOURCE_ATTRIBUTES=service.name=<service_name> \
OTEL_EXPORTER_OTLP_ENDPOINT="https://ingest.{region}.signoz.cloud:443" \
OTEL_EXPORTER_OTLP_HEADERS="signoz-ingestion-key=SIGNOZ_INGESTION_KEY" \
OTEL_EXPORTER_OTLP_PROTOCOL=grpc \
opentelemetry-instrument <your_run_command>
<service_name>is the name of the service you want<your_run_command>can be python3 app.py or gunicorn -b 0.0.0.0:8001 --reload src.app- Replace SIGNOZ_INGESTION_KEY with the api token provided by SigNoz. You can find it in the email sent by SigNoz with your cloud account details.
Don’t run app in reloader/hot-reload mode as it breaks instrumentation. For example, if you use --reload or reload=True, it enables the reloader mode which breaks OpenTelemetry isntrumentation.
For our sample Falcon application, the run command will look like:
OTEL_RESOURCE_ATTRIBUTES=service.name=sample-falcon-app \
OTEL_EXPORTER_OTLP_ENDPOINT="https://ingest.{region}.signoz.cloud:443" \
OTEL_EXPORTER_OTLP_HEADERS="signoz-ingestion-key=SIGNOZ_INGESTION_KEY" \
OTEL_EXPORTER_OTLP_PROTOCOL=grpc \
opentelemetry-instrument gunicorn -b 0.0.0.0:8001 --reload src.app
And, congratulations! You have instrumented your sample Falcon app. You can check if your app is running or not by hitting the endpoint at http://localhost:8001/api/v1/test.
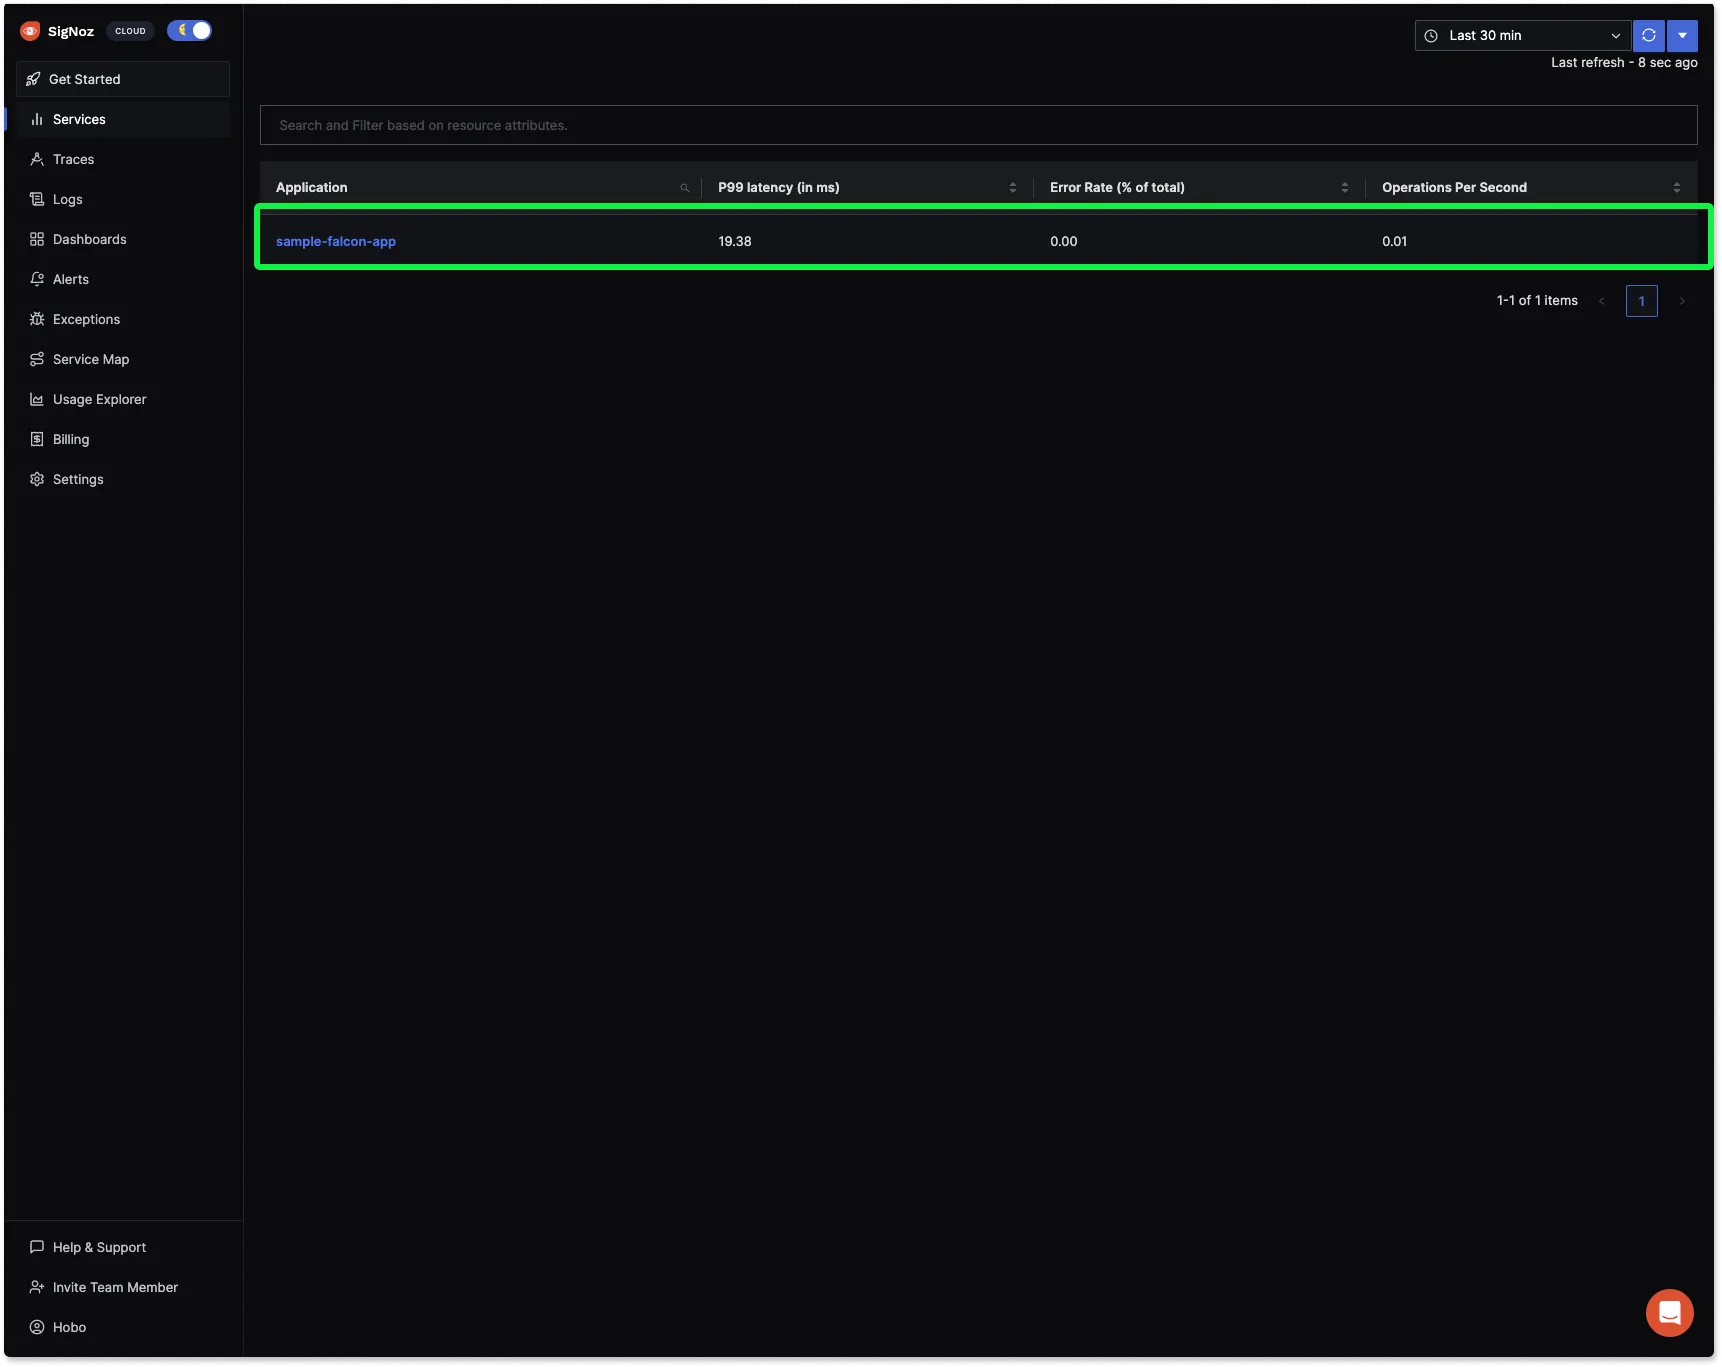
You need to interact with the endpoint to generate some monitoring data. Refresh the endpoint about 10-20 times and check SigNoz dashboard.
You will find sample-falcon-app in the list of sample applications being monitored by SigNoz.
Monitor Falcon application with SigNoz
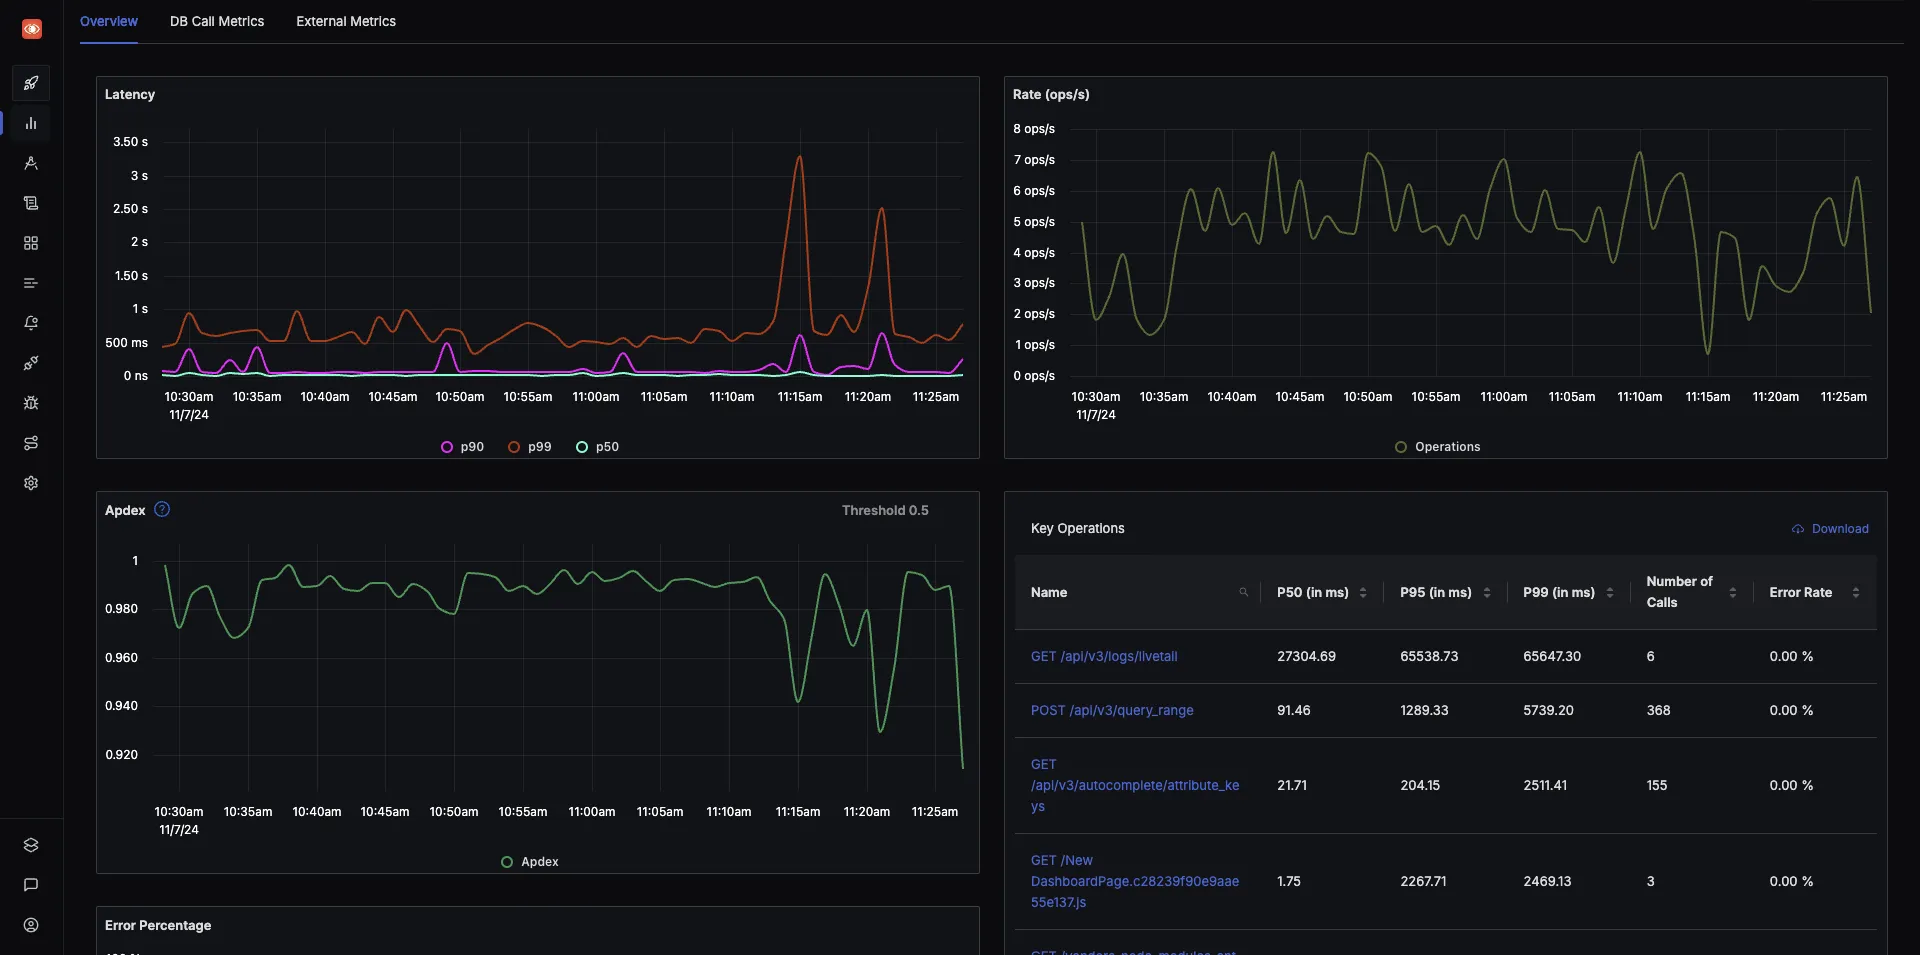
SigNoz makes it easy to visualize metrics and traces captured through OpenTelemetry instrumentation.
SigNoz comes with out of box RED metrics charts and visualization. RED metrics stands for:
- Rate of requests
- Error rate of requests
- Duration taken by requests
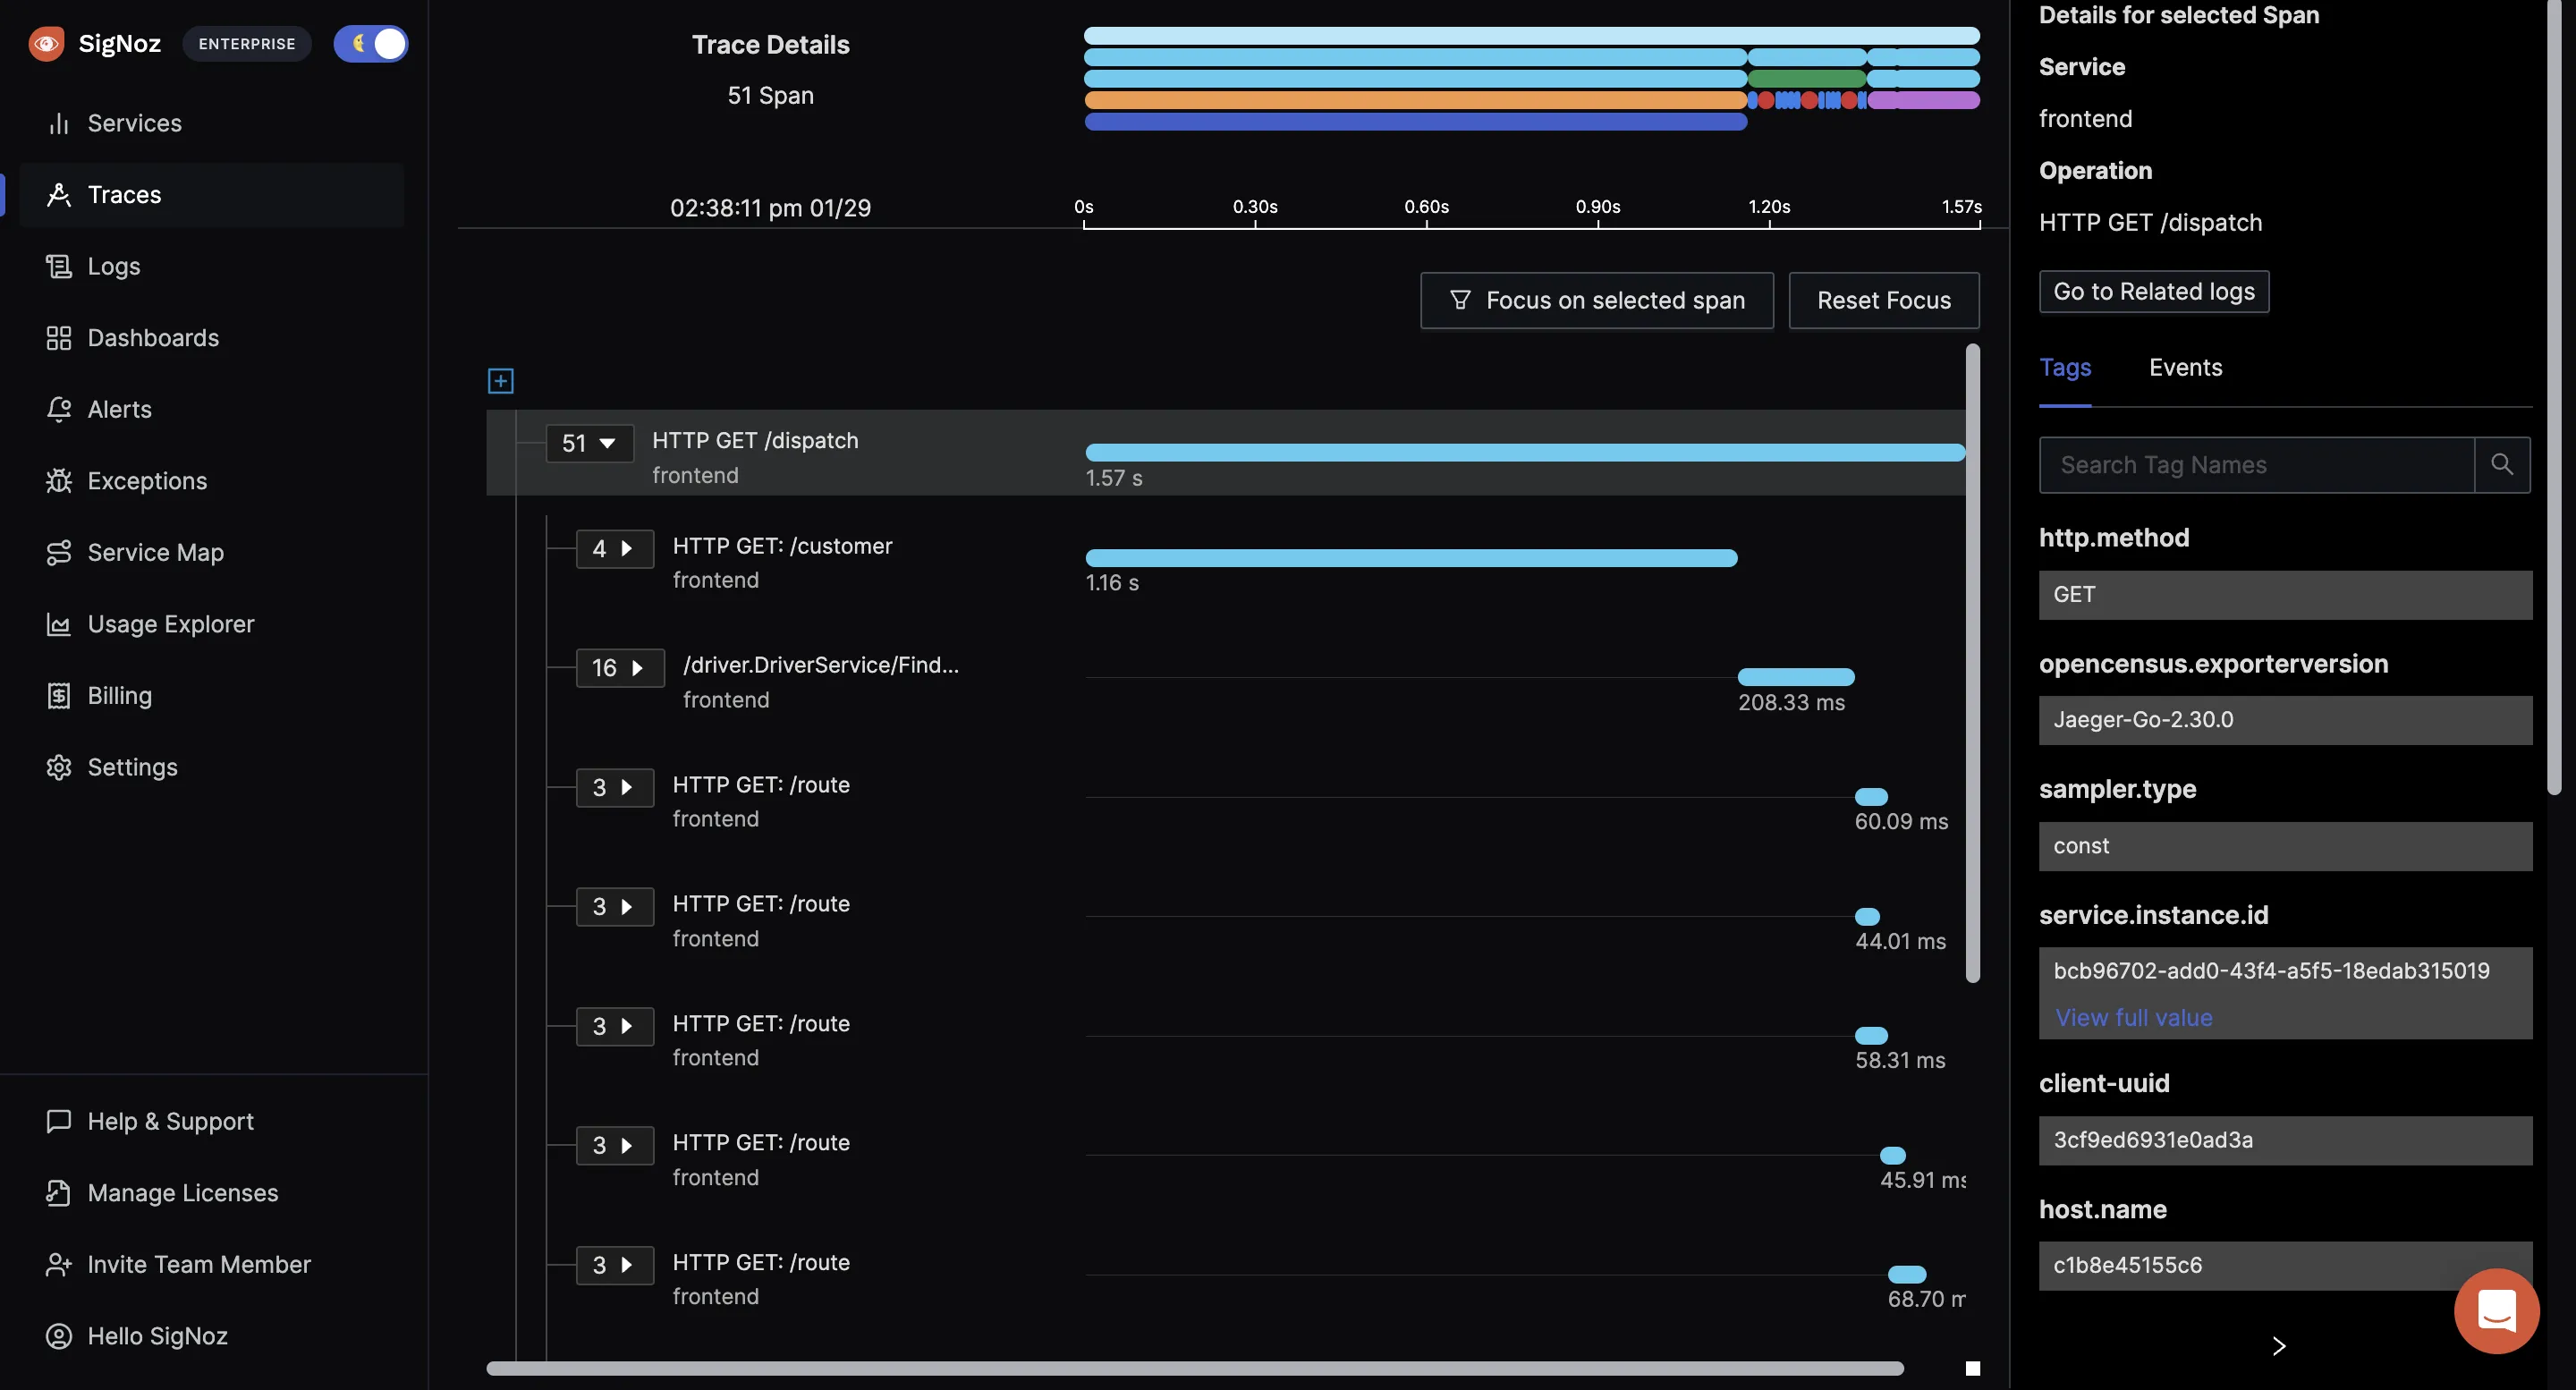
You can then choose a particular timestamp where latency is high to drill down to traces around that timestamp.
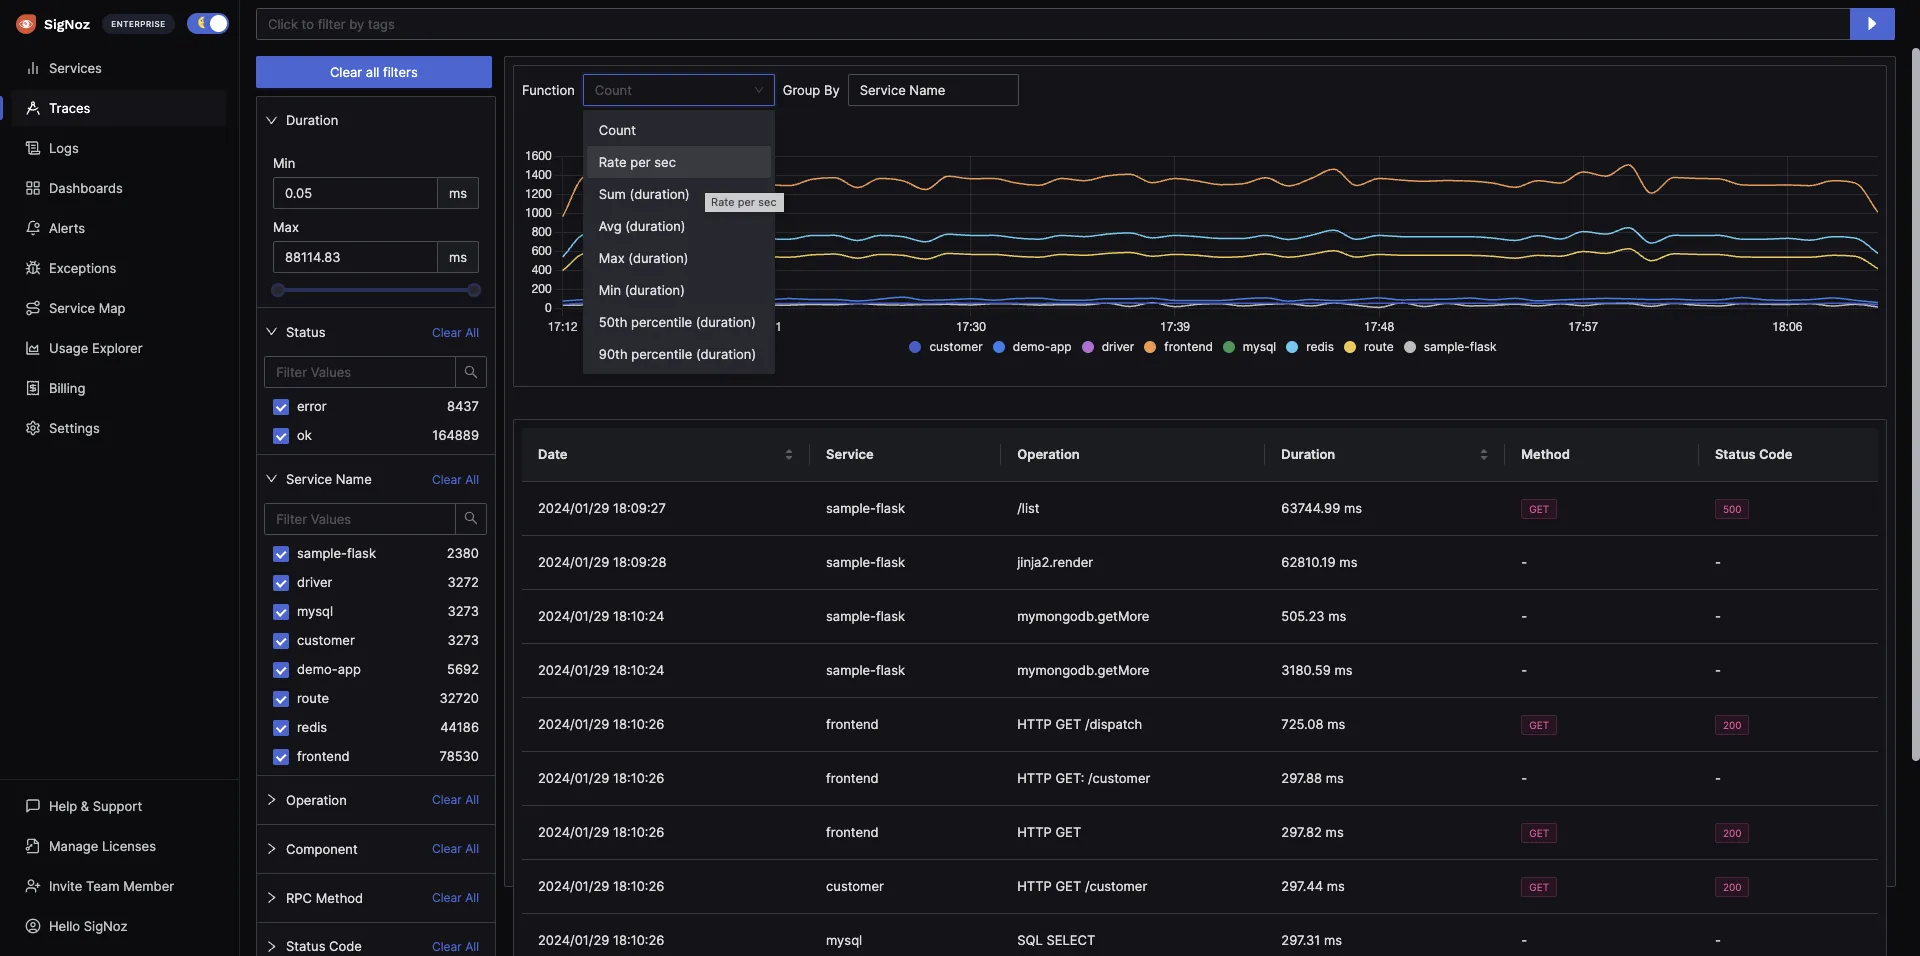
You can use flamegraphs to exactly identify the issue causing the latency.
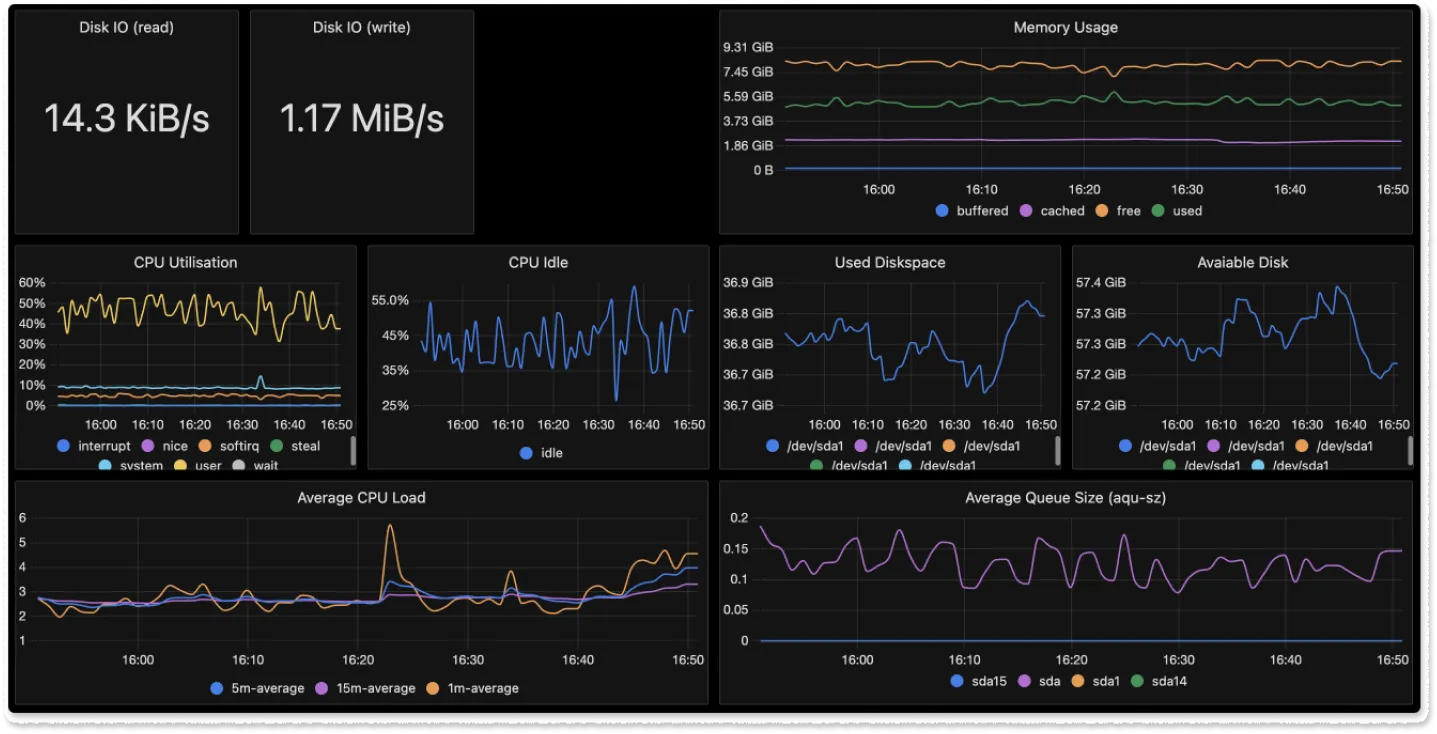
You can also build custom metrics dashboard for your infrastructure.
Conclusion
OpenTelemetry makes it very convenient to instrument your Falcon application. You can then use an open-source APM tool like SigNoz to analyze the performance of your app. SigNoz provides both metrics monitoring and distributed tracing so that you don't have to use multiple tools for your monitoring needs.
You can try out SigNoz by visiting its GitHub repo 👇 
If you have any questions or need any help in setting things up, join our slack community and ping us in #support channel.

If you want to read more about SigNoz 👇
