A Practical OpenTelemetry Django Auto-Instrumentation Guide
Most production-grade Django applications are composed of multiple interconnected components such as HTTP servers, WSGI/ASGI gateways, databases, caches, background workers, and more.
To manage your Django applications reliably, monitor their performance as they serve users, and debug issues as they arise, you need telemetry across those components and request paths. And that's where OpenTelemetry comes into the picture.
In this hands-on guide, we will set up OpenTelemetry Django auto-instrumentation on a sample Django application, run it via a Gunicorn web server, and export traces, metrics, and logs to SigNoz, an OpenTelemetry-native observability backend.
Finally, we'll verify that telemetry flows end to end, visualize your application's telemetry, and understand how it works under the hood.
What is OpenTelemetry Django?
Before we begin, note that the scope of this guide is limited to instrumenting Django with OpenTelemetry, auto-instrumentation, manual spans and metrics, and exporting telemetry.
For what to monitor once data is flowing (the Django metrics that matter, dashboards, and alerts), the dedicated Django monitoring guide covers that side.
OpenTelemetry instrumentation with Django enables the generation and management of telemetry data (logs, metrics, and traces) from your Django application. This data is then used to observe the application and gain insights into its performance and behavior.
OpenTelemetry provides an open-source standard with a consistent data format and collection mechanism. As application owners, you will always have the freedom to choose different vendors to visualize the collected telemetry data, and can consume this data in a variety of formats.
Instrumentation is the biggest challenge engineering teams face when starting out with monitoring their application performance. OpenTelemetry is the leading open-source standard solving the problem of instrumentation. It is currently an incubating project under the Cloud Native Computing Foundation and aims to make telemetry data a built-in feature of cloud-native software applications.
Implementing OpenTelemetry in Django Applications
Let's go through the steps of setting up and instrumenting a Django application with OpenTelemetry to emit traces and metrics. We will primarily cover OpenTelemetry Django auto-instrumentation as it is easy to set up and covers most observability needs in the beginning (traces and metrics).
In this guide, we are going to send the emitted telemetry to SigNoz.
Prerequisites for Application Instrumentation
There are the main prerequisites to getting started:
-
Python 3.10 or later (download the latest version here)
-
for Django, you must define
DJANGO_SETTINGS_MODULEcorrectly. Since our project is calledmysite, we set the value as following:export DJANGO_SETTINGS_MODULE=mysite.settings
Step 1: Setting Up SigNoz
As discussed previously, we will send the application's emitted telemetry to SigNoz. SigNoz is an OpenTelemetry-native APM that is built from the ground to process OpenTelemetry data.
SigNoz Cloud is the easiest way to run SigNoz. Sign up for a free account and get 30 days of unlimited access to all features.

You can also install and self-host SigNoz yourself since it is open-source. With 24,000+ GitHub stars, open-source SigNoz is loved by developers. Find the instructions to self-host SigNoz.
Step 2: Preparing the Sample Django Application
We have prepared a sample Django application to speed up the setup process. We'll be using the Django admin panel to create and interact with polls.
Clone the GitHub repository locally by running:
git clone git@github.com:SigNoz/examples.git
cd examples/python/opentelemetry-django-demo
Next, we will create and activate a Python virtual environment. Setting up virtual environments is a recommended practice to avoid dependency conflicts between different Python projects on your system.
# create a virtual environment with `.venv` folder name
python3 -m venv .venv
# activate the virtual environment
source .venv/bin/activate

# install all required dependencies
python -m pip install -r requirements.txt
Below is a brief explanation of the OpenTelemetry packages included in the requirements.txt:
opentelemetry-distro - The distro provides a mechanism to automatically configure some of the more common options for users. It helps to get started with OpenTelemetry auto-instrumentation quickly.
opentelemetry-exporter-otlp - This library provides a way to install all OTLP exporters. You will need an exporter to send the data to SigNoz.
The opentelemetry-exporter-otlp is a convenient wrapper package to install all currently supported OTLP exporters:
opentelemetry-exporter-otlp-proto-httpopentelemetry-exporter-otlp-proto-grpc
The opentelemetry-exporter-otlp-proto-grpc package installs the gRPC exporter which depends on the grpcio package. The installation of grpcio may fail on some platforms for various reasons. If you run into such issues, or you don't want to use gRPC, you can install the HTTP exporter instead by installing the opentelemetry-exporter-otlp-proto-http package. You need to set the OTEL_EXPORTER_OTLP_PROTOCOL environment variable to http/protobuf to use the HTTP exporter.
Step 3: Installing OpenTelemetry Instrumentation Packages
Now, we need to install the required OTel instrumentation libraries to generate telemetry from our application.
The opentelemetry-bootstrap command installs the corresponding instrumentation packages for libraries present in the current environment. For this project, it detects Django and installs opentelemetry-instrumentation-django, the OpenTelemetry package that traces requests in Django applications, along with other matching instrumentation packages.
opentelemetry-bootstrap --action=install
Step 4: Prepare your Django Application
Django applications require some setup operations, database migrations, superuser creation and so on, before we can execute them, and the same is true here.
You need to run the following commands to prepare the Django application for usage:
a. This command is used to perform the initial database migration. You will only need to run this the very first time you deploy your app.
python3 manage.py migrate
b. This command is used to collect static files from multiple apps into a single path.
python3 manage.py collectstatic
c. The following command creates a user who can log in to the admin site. You will be asked to create a username and a password. You will need the username and password to login to the admin portal later.
python3 manage.py createsuperuser
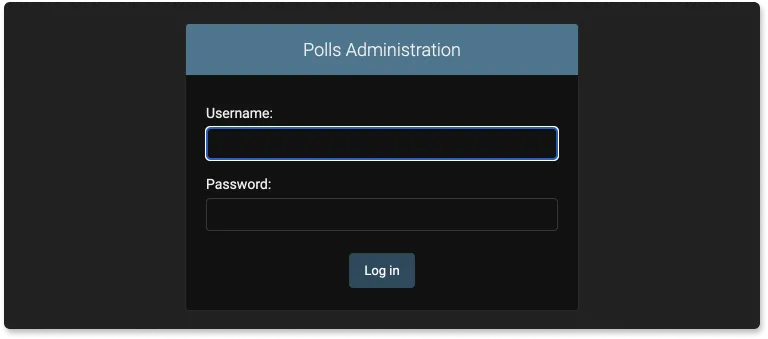
After running createsuperuser, you'll be able to log in to the admin panel as shown below.
Step 5: Running OpenTelemetry Django Application with Gunicorn
We're almost done. In the last step, we'll configure a few environment variables for the OTLP exporters and run the Django app server using Gunicorn. The sample includes a gunicorn.config.py file with a post_fork hook that creates a gunicorn-config-init span and adds an event when each worker starts. This is a validation step to confirm telemetry is flowing from individual Gunicorn workers.
The run command will look like:
OTEL_RESOURCE_ATTRIBUTES=service.name=sample-django-app \
OTEL_EXPORTER_OTLP_ENDPOINT="https://ingest.{region}.signoz.cloud:443" \
OTEL_EXPORTER_OTLP_HEADERS="signoz-ingestion-key=<SIGNOZ_INGESTION_KEY>" \
OTEL_EXPORTER_OTLP_PROTOCOL=grpc \
opentelemetry-instrument gunicorn mysite.wsgi -c gunicorn.config.py --workers 2 --threads 2
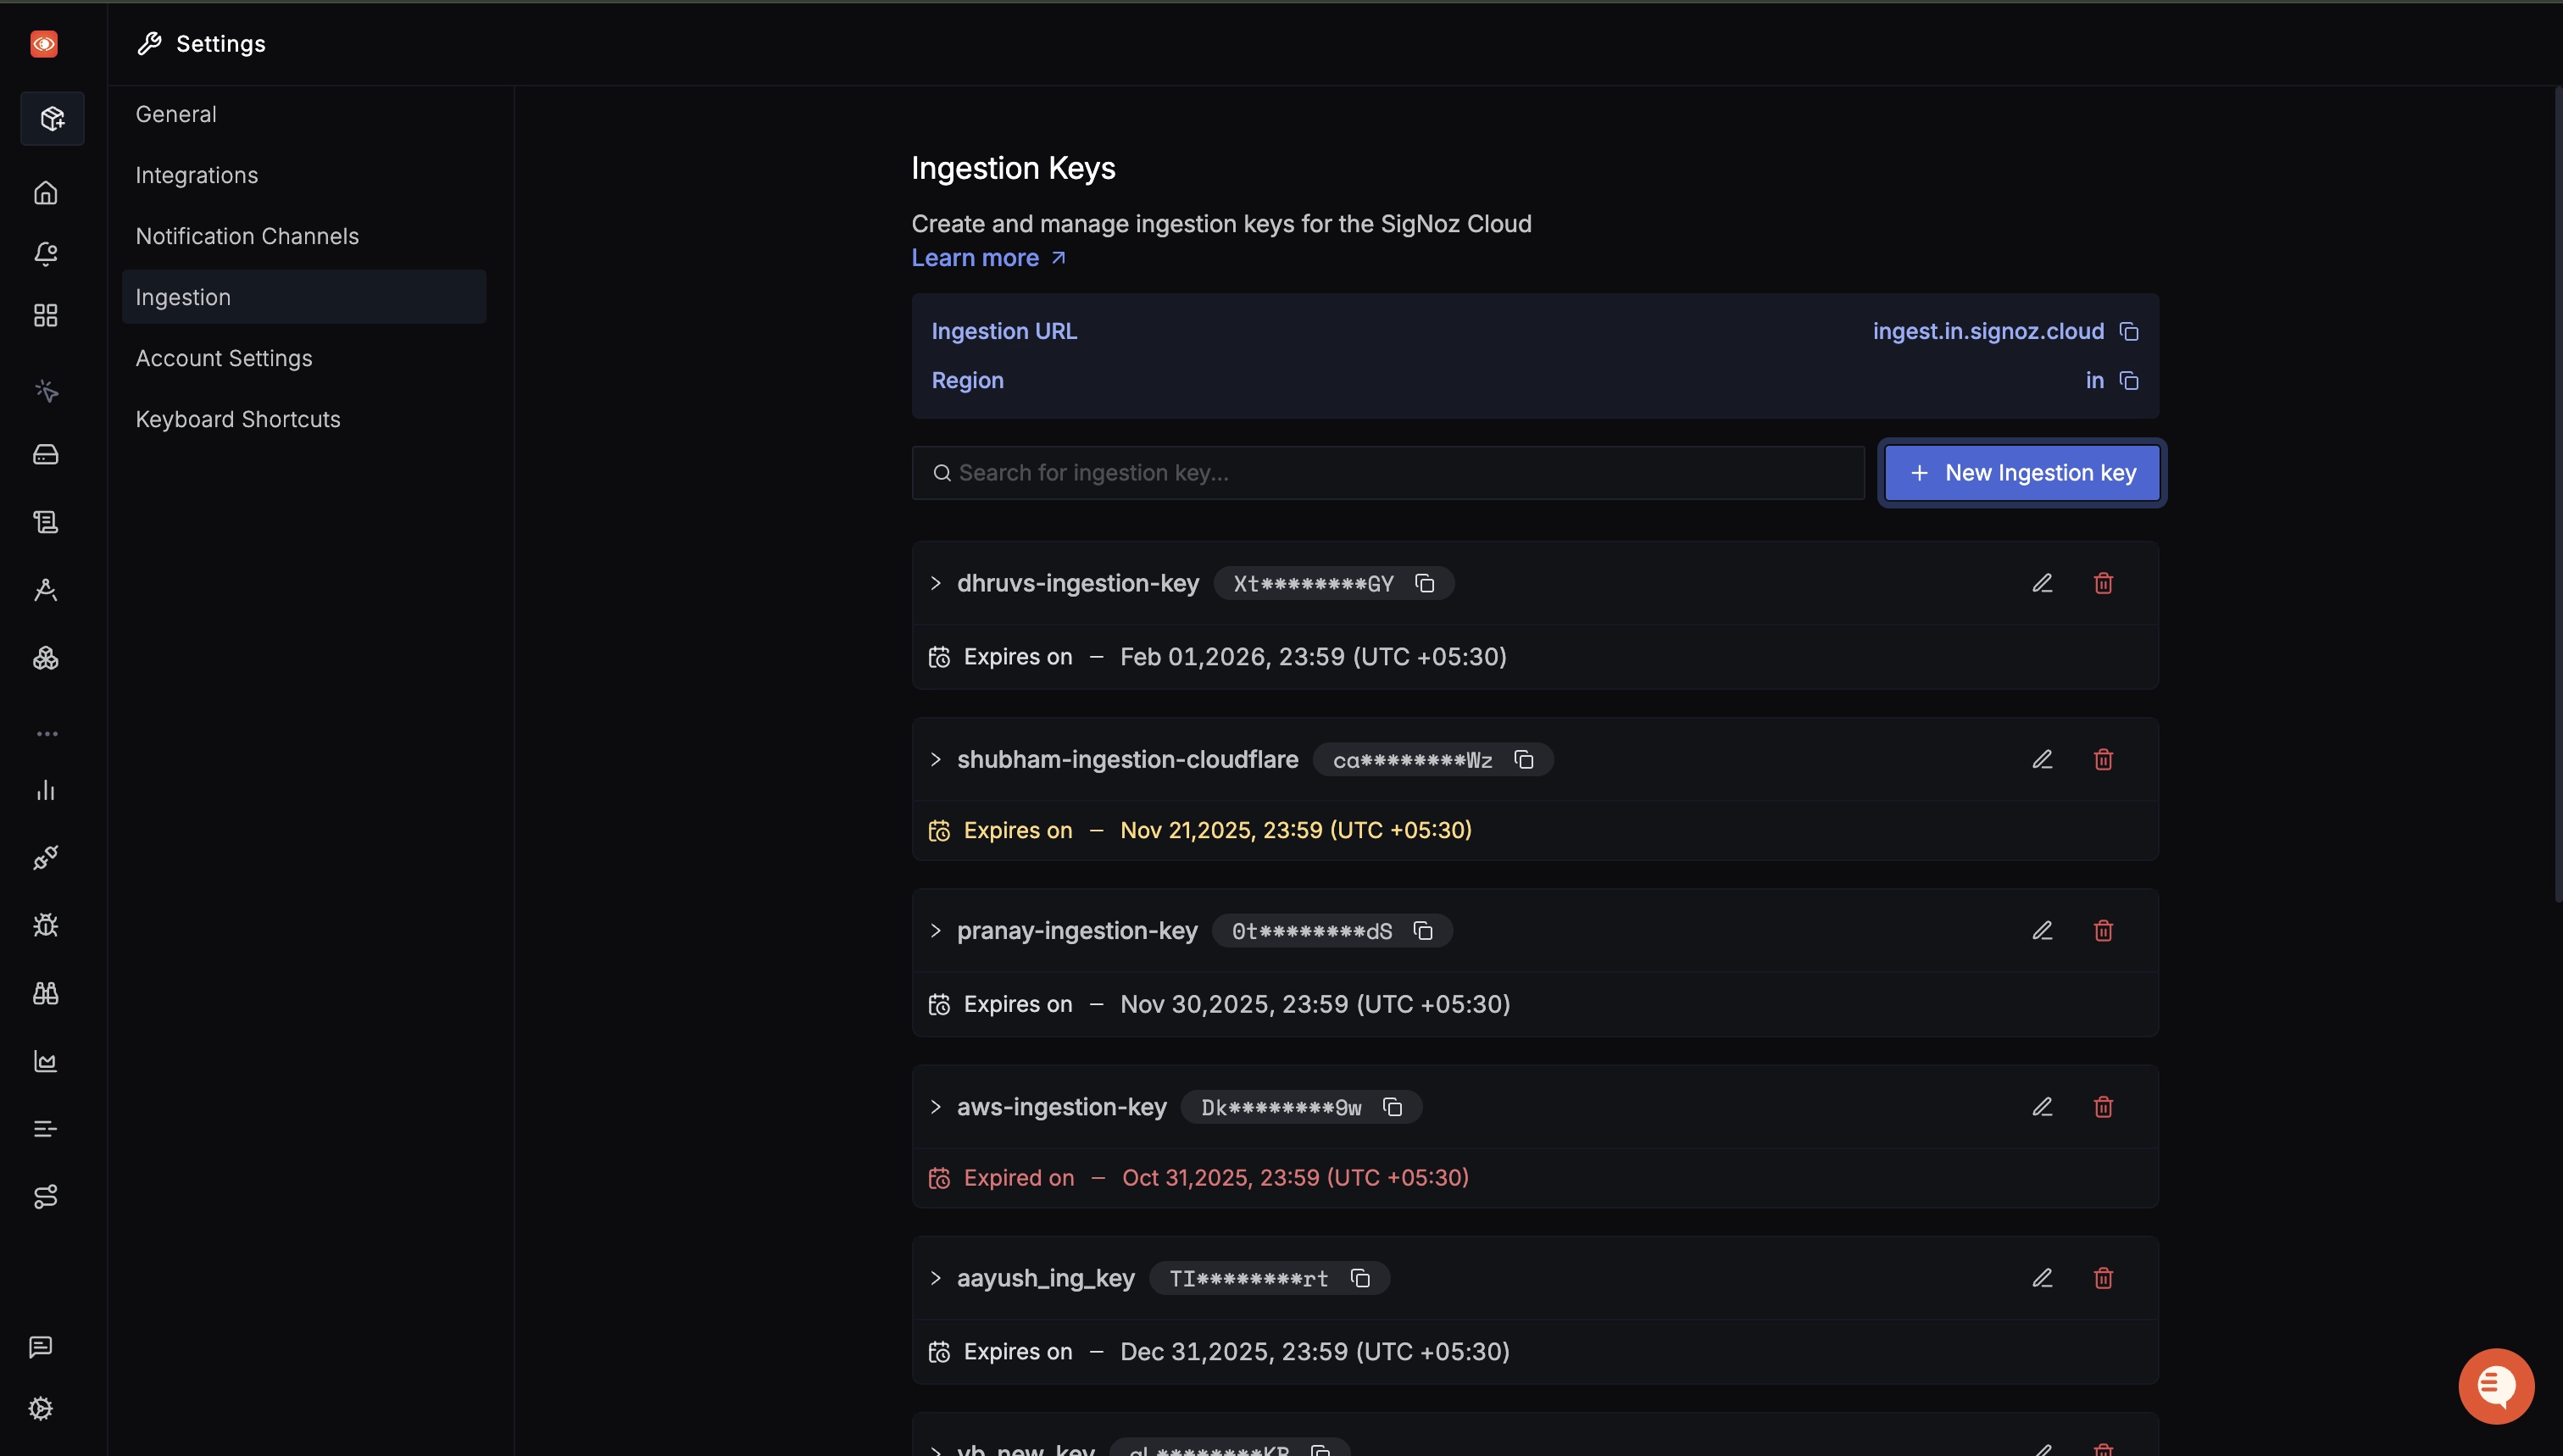
You can get your SigNoz ingestion key and region from your SigNoz Cloud account from Settings --> Ingestion.
If you are running SigNoz in self-hosted mode, use the localhost endpoint:
OTEL_EXPORTER_OTLP_INSECURE=true \
OTEL_EXPORTER_OTLP_ENDPOINT="http://localhost:4317" \
After running the command, visit http://localhost:8000/admin to open the admin panel and validate your app is running. Generate some telemetry to be captured by adding a few questions through the app interface.
The following video guides you on how the exported application data flows through and is visualized by SigNoz:
Troubleshooting
Application hot-reload can cause inconsistent data generation by breaking OTel instrumentation. Ensure you run the Gunicorn web server without the --reload flag.
Instrument Django Application Using Docker
If you want to run the application with a Docker image, refer to the following instructions.
Step 1: Build Docker Image
Build the application Docker image by running:
docker build -t sample-django-app .
Step 2: Configure Environment Variables
As previously discussed, to send the collected data to SigNoz, you need to set some environment variables while running the application with OpenTelemetry. The following command will set the requisite values and start the container:
docker run -d --name django-container \
-e DJANGO_SETTINGS_MODULE=mysite.settings \
-e OTEL_RESOURCE_ATTRIBUTES='service.name=sample-django-app' \
-e OTEL_EXPORTER_OTLP_ENDPOINT="https://ingest.{region}.signoz.cloud:443" \
-e OTEL_EXPORTER_OTLP_HEADERS="signoz-ingestion-key=<SIGNOZ_INGESTION_KEY>" \
-e OTEL_EXPORTER_OTLP_PROTOCOL=grpc \
-p 8000:8000 sample-django-app
If you are running SigNoz with its self-hosted Docker Compose setup on the same host, attach the Django container to the SigNoz Docker network and send telemetry to the local collector:
# If needed, run `docker network ls` and confirm the SigNoz network name.

docker run -d --name django-container \
--network signoz-net \
-e DJANGO_SETTINGS_MODULE=mysite.settings \
-e OTEL_RESOURCE_ATTRIBUTES='service.name=sample-django-app' \
-e OTEL_EXPORTER_OTLP_ENDPOINT="http://signoz-otel-collector:4317" \
-e OTEL_EXPORTER_OTLP_PROTOCOL=grpc \
-e OTEL_EXPORTER_OTLP_INSECURE=true \
-p 8000:8000 sample-django-app
Exporting Django Logs to an OpenTelemetry Backend
The fragmented and somewhat complex nature of logging system in Python, in large part due to logging having the longest legacy as a monitoring mechanism, means that logging takes more effort to setup compared to other forms of telemetry. We must manually instrument our application, and create a "bridge" between the OpenTelemetry logging framework and Python's logging library.
The manual setup below is intended for the commands shown in this guide, where OTEL_LOGS_EXPORTER is not set. If you choose the OpenTelemetry Python log auto-instrumentation path instead, do not also add this manual otel_config.py setup, because using both paths can create duplicate exported log records.
Copy-paste the following code into a new file called otel_config.py:
import logging

from opentelemetry.instrumentation.logging import LoggingInstrumentor
from opentelemetry.sdk.resources import Resource
from opentelemetry._logs import set_logger_provider
from opentelemetry.sdk._logs import LoggerProvider, LoggingHandler
from opentelemetry.sdk._logs.export import BatchLogRecordProcessor
from opentelemetry.exporter.otlp.proto.grpc._log_exporter import OTLPLogExporter

def setup_opentelemetry():
    logger = logging.getLogger()

    # add resource metadata to logs
    resource = Resource.create(attributes={
        "service.name": "sample-django-app"
    })
    logger_provider = LoggerProvider(resource=resource)
    set_logger_provider(logger_provider)

    # define the exporter to send logs to the observability backend
    log_exporter = OTLPLogExporter()
    # register it with the global provider
    logger_provider.add_log_record_processor(
        BatchLogRecordProcessor(log_exporter)
    )

    # configure the python logging module to support OTel by registering the handler
    handler = LoggingHandler(level="INFO", logger_provider=logger_provider)
    logger.addHandler(handler)
    logger.setLevel(logging.INFO)

    # inject trace context into logs
    LoggingInstrumentor().instrument(set_logging_format=True)

    logger.info("OpenTelemetry logging is configured.")
Once done, open the wsgi.py file, given we're using Gunicorn to run the application server, and add the import and invocation statement just after the import statements:
from otel_config import setup_opentelemetry

setup_opentelemetry()
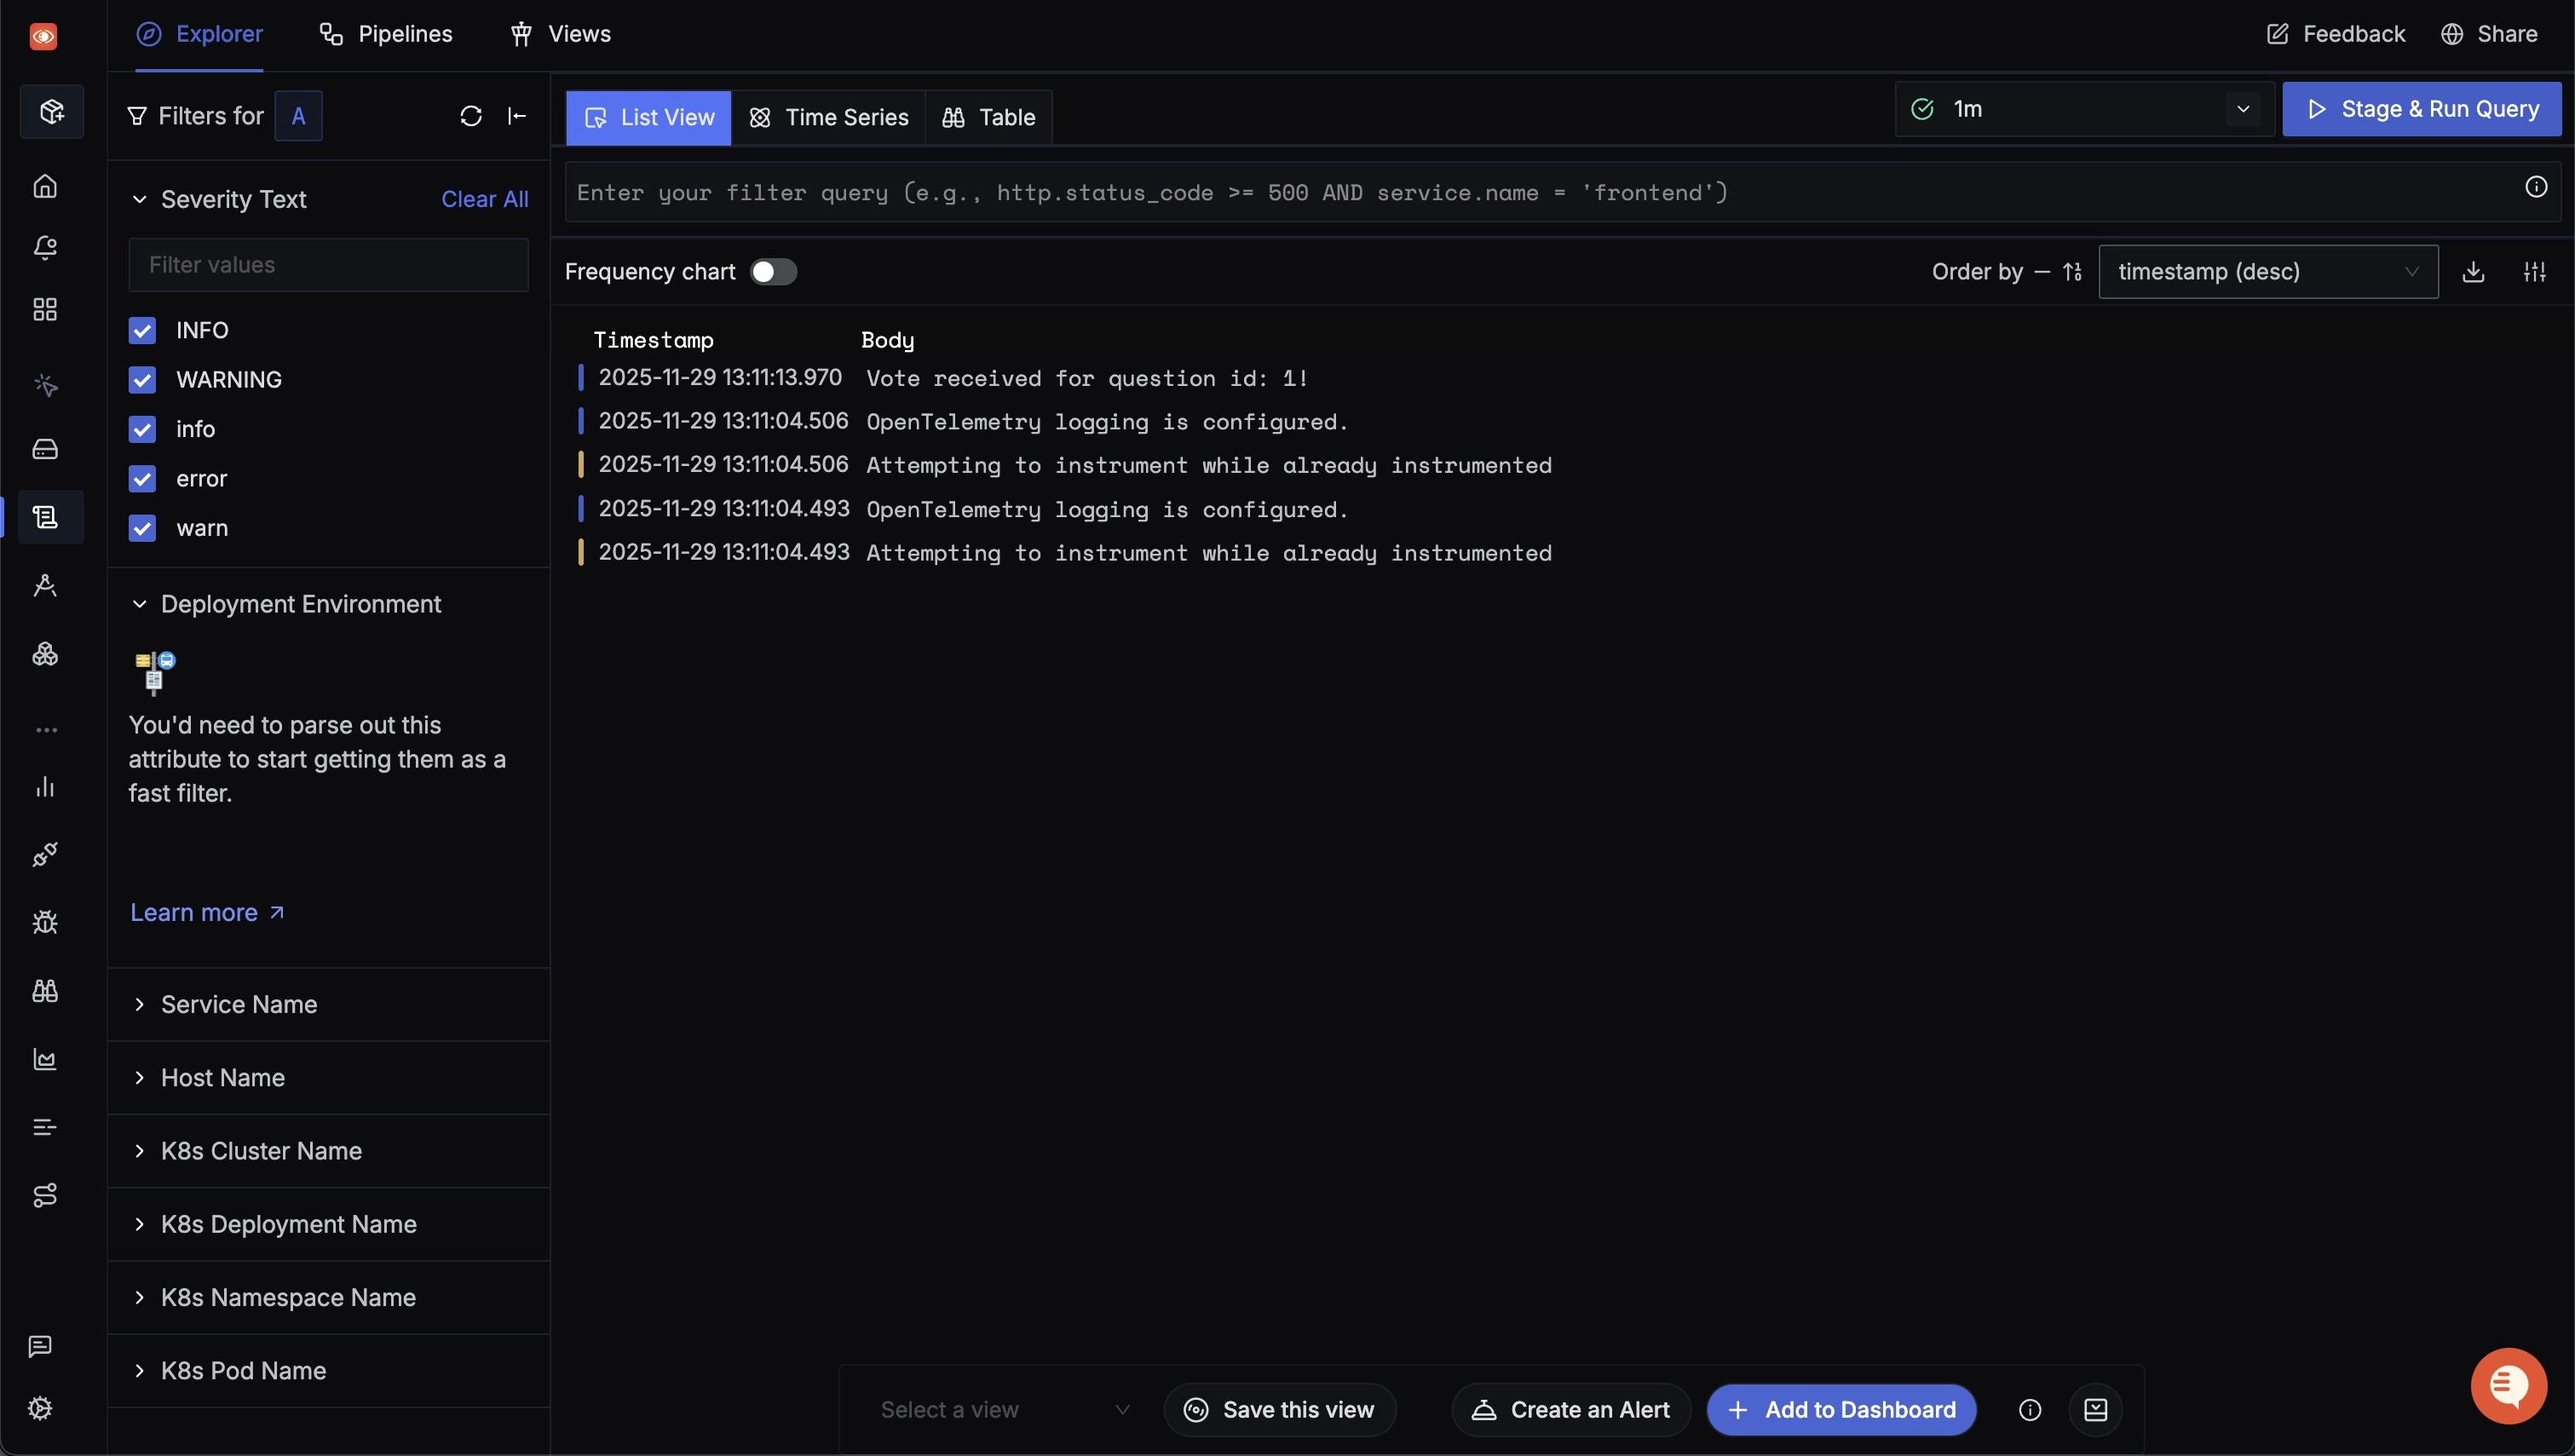
This will ensure the function is invoked when Gunicorn starts, and will configure log records to be transformed into and forwarded to our defined OTLP endpoint. Try it out by adding some log statements in the views, then checking the Logs panel.
Logging in Django is a vast topic, and there is much nuance to it. We have a deep-dive on this topic available here.
Implementing Custom Traces and Metrics
Observability is a practice that should evolve alongside your applications, and part of the process is manually instrumenting key areas of the codebase that are otherwise unobserved. Having custom traces and metrics will help you capture details that matter to your application systems, deliver business value, and recognize and resolve complex issues faster.
You can find more information on manual instrumentation in Python in this section of our OTel Python blog.
OpenTelemetry vs Other Django Monitoring Solutions
When it comes to observability for Django applications, OpenTelemetry offers several advantages over other solutions. Let's compare OpenTelemetry with some popular alternatives:
1. OpenTelemetry vs Django Debug Toolbar
Django Debug Toolbar:
- Pros: Easy to set up, provides detailed information about queries, templates, and HTTP headers.
- Cons: Only works in development, not suitable for production monitoring.
OpenTelemetry:
- Pros: Works in both development and production, provides distributed tracing, more comprehensive data collection.
- Cons: Requires more initial setup.
2. OpenTelemetry vs New Relic
- Pros: Comprehensive APM solution, easy to set up with Django.
- Cons: Proprietary solution, can be expensive for large-scale applications.
OpenTelemetry:
- Pros: Open-source, vendor-agnostic, more flexible and customizable.
- Cons: Requires more configuration and a separate backend for data storage and visualization.
3. OpenTelemetry vs Sentry
- Pros: Excellent for error tracking and crash reporting.
- Cons: Limited in terms of performance monitoring and distributed tracing.
OpenTelemetry:
- Pros: Provides both error tracking and performance monitoring, supports distributed tracing.
- Cons: May require additional setup for error tracking features.
4. OpenTelemetry vs Datadog
Datadog:
- Pros: Comprehensive monitoring solution with wide integration support.
- Cons: Can be expensive, proprietary solution.
OpenTelemetry:
- Pros: Open-source, more cost-effective for large-scale deployments, vendor-agnostic.
- Cons: Requires more initial setup and configuration.
Key Advantages of OpenTelemetry:
-
Vendor Agnostic: OpenTelemetry allows you to switch between different backends without changing your instrumentation code.
-
Comprehensive Data Collection: Collects traces, metrics, and logs in a standardized format.
-
Community-Driven: Being open-source, it benefits from community contributions and rapid improvements.
-
Future-Proof: As an emerging standard backed by major tech companies, it's likely to have long-term support and development.
-
Flexibility: Can be used with various languages and frameworks beyond Django.
-
Cost-Effective: Open-source nature makes it more cost-effective for large-scale deployments.
While OpenTelemetry requires more initial setup compared to some out-of-the-box solutions, its flexibility, comprehensive data collection, and vendor-agnostic nature make it an excellent choice for Django applications, especially those looking for a scalable, future-proof observability solution.
Conclusion
OpenTelemetry makes it very convenient to instrument your Django application. You can then use an open-source APM tool like SigNoz to analyze the performance of your app. As SigNoz covers the three pillars of observability — traces, metrics, and logs — under one pane, you avoid the contextual overhead of maintaining separate tools.
SigNoz Cloud enables first-class OpenTelemetry support with guided installation steps for instrumenting all parts of your tech stack, including infrastructure, and supports 50+ data sources. Sign up today for a 30-day free trial.
Investigate Django Telemetry from Your IDE
With your Django application sending traces, metrics, and logs to SigNoz, you can also investigate that telemetry directly from your coding workflow. As an optional next step, connect the SigNoz MCP Server and ask about slow ORM queries, Gunicorn worker errors, or exception patterns in natural language without leaving your IDE. For a broader overview, see Agent Native Observability.
FAQs
What is OpenTelemetry Django?
OpenTelemetry Django instrumentation enables the generation of telemetry data from your Django application. This data is then used to monitor the performance of Django applications. OpenTelemetry provides an open-source standard with a consistent collection mechanism and data format.
Why should I use OpenTelemetry for monitoring my Django application?
OpenTelemetry is vendor-agnostic and provides a standardized way to instrument your Django application. It allows you to collect telemetry data (logs, metrics, and traces) which can be exported to various backends. This flexibility ensures that you're not locked into a specific monitoring solution.
How do I set up OpenTelemetry instrumentation for my Django application?
To set up OpenTelemetry instrumentation for Django:
- Install necessary packages (opentelemetry-distro, opentelemetry-exporter-otlp)
- Configure environment variables for the OTLP exporter
- Use the
opentelemetry-instrumentcommand to run your Django application - Choose a backend (like SigNoz) to visualize and analyze the collected data
Can I use OpenTelemetry with Docker for my Django application?
Yes, you can use OpenTelemetry with Docker for your Django application. You'll need to build a Docker image of your app, set the necessary environment variables for OpenTelemetry, and run the container with these variables. The article provides specific instructions for this setup.
What kind of metrics can I monitor with OpenTelemetry for Django?
With OpenTelemetry, you can monitor various metrics for your Django application, including:
- Request rate
- Error rate
- Request duration (latency)
- Database query performance
- External service calls
- Custom metrics specific to your application logic
How does OpenTelemetry Django instrumentation affect my application's performance?
OpenTelemetry is designed to have minimal impact on application performance. However, as with any instrumentation, there may be a slight overhead. The benefits of comprehensive monitoring and troubleshooting capabilities usually outweigh this minimal performance impact.
Why am I getting no traces from Django even though I started with opentelemetry-instrument?
The most common causes are: the OTLP exporter endpoint/protocol isn't reachable, required environment variables aren't set, or the server's reload/fork model prevents exporter threads from starting correctly. Start by disabling Django autoreload (via --noreload flag) or by removing Gunicorn --reload flag, and verifying endpoint/protocol values. Then check the Gunicorn worker logs and OTLP console exporter (OTEL_TRACES_EXPORTER=console) to confirm spans are being created and exported.
Do I need manual instrumentation if I already have automatic instrumentation?
Automatic instrumentation is the best "quick win" for broad trace coverage (requests, framework hooks, common libraries). Manual instrumentation becomes valuable when you need domain-level spans/attributes (e.g., "checkout", "payment authorization"), or to capture flows not covered by automatic libraries.
Does OpenTelemetry use Django middleware?
OpenTelemetry Django instrumentation is not something you usually add to Django's MIDDLEWARE list. The opentelemetry-instrumentation-django package instruments Django's request/response lifecycle and creates spans for incoming requests. If you need to capture attributes added by your Django middleware, use a response hook so the middleware stack has already run before those span attributes are attached.
Check out the OpenTelemetry Django documentation for more concrete examples and API definitions.
How do I prevent tracing health checks or noisy endpoints in Django?
Use OpenTelemetry Python configuration to exclude URLs. OpenTelemetry provides Python-specific environment variables for exclusions. You can set a global excluded URL pattern (OTEL_PYTHON_EXCLUDED_URLS) list, or set Django-specific excluded URL patterns (OTEL_PYTHON_DJANGO_EXCLUDED_URLS). This is a common best practice to reduce noise and cost while keeping high-value traces.
Further reading
To go deeper once Django telemetry is flowing, the Python performance monitoring guide and broader Python application monitoring guide help you turn that data into actionable insights.
To understand the concepts behind the traces you're collecting, see our primer on distributed tracing and how it fits into the wider landscape of APM tools.
And if you want to know when to reach for the instrumentation API versus the SDK, our breakdown of the OpenTelemetry API vs SDK clarifies the distinction.
