Monitor HAProxy Metrics and Logs with OpenTelemetry [Step By Step Guide]
For extremely high throughput web applications, it is important to load balance the traffic across multiple servers. However, load balancing the traffic alone is not enough at times. The reverse proxy server that handles the workload needs to be performant, too. In our previous article, we discussed the NGINX reverse proxy server and understood how to monitor it. In this article, we set up monitoring for an even more performant reverse proxy server - HAProxy.

In this tutorial, we cover:
- A Brief Overview of HAProxy
- A Brief Overview of OpenTelemetry
- How does OpenTelemetry Collector collect data?
- Pre-requisites
- Setting up OpenTelemetry Collector
- Monitoring with SigNoz Dashboard
- Reference: HAProxy metrics collected by OpenTelemetry Collector
- Conclusion
If you want to jump straight into implementation, start with this prerequisites section.
A Brief Overview of HAProxy
HAProxy proudly calls itself a reliable and highly performant load-balancer. It does just one job - and does it very well. It is an open-source server available as a load balancer for TCP and HTTP traffic. It is, in particular, used for high-traffic websites due to its performant algorithms for load-balancing requests. A single HAProxy server has been proven to serve over 2M requests per second with SSL enabled. A server this performant requires excellent monitoring, too. It does come with an inbuilt dashboard for showing its metrics, but it isn’t as intuitive as it should be. In this article, we talk about how to achieve good monitoring capabilities around HAProxy, including metrics and logs using OpenTelemetry and Signoz.
A Brief Overview of OpenTelemetry
OpenTelemetry is a set of APIs, SDKs, libraries, and integrations aiming to standardize the generation, collection, and management of telemetry data(logs, metrics, and traces). It is backed by the Cloud Native Computing Foundation and is the leading open-source project in the observability domain.
The data you collect with OpenTelemetry is vendor-agnostic and can be exported in many formats. Telemetry data has become critical in observing the state of distributed systems. With microservices and polyglot architectures, there was a need to have a global standard. OpenTelemetry aims to fill that space and is doing a great job at it thus far.
In this tutorial, you will use OpenTelemetry Collector to collect HAProxy metrics and logs for monitoring.
What is OpenTelemetry Collector?
OpenTelemetry Collector is a stand-alone service provided by OpenTelemetry. It can be used as a telemetry-processing system with a lot of flexible configurations to collect and manage telemetry data.
It can understand different data formats and send it to different backends, making it a versatile tool for building observability solutions.
Read our complete guide on OpenTelemetry Collector
How does OpenTelemetry Collector collect data?
A receiver is how data gets into the OpenTelemetry Collector. Receivers are configured via YAML under the top-level receivers tag. There must be at least one enabled receiver for a configuration to be considered valid.
Here’s an example of an otlp receiver:
receivers:
  otlp:
    protocols:
      grpc:
      http:
An OTLP receiver can receive data via gRPC or HTTP using the OTLP format. There are advanced configurations that you can enable via the YAML file.
Here’s a sample configuration for an otlp receiver.
receivers:
  otlp:
    protocols:
      http:
        endpoint: "localhost:4318"
        cors:
          allowed_origins:
            - http://test.com
            # Origins can have wildcards with *, use * by itself to match any origin.
            - https://*.example.com
          allowed_headers:
            - Example-Header
          max_age: 7200
You can find more details on advanced configurations here.
After configuring a receiver, you must enable it. Receivers are enabled via pipelines within the service section. A pipeline consists of a set of receivers, processors, and exporters.
The following is an example pipeline configuration:
service:
  pipelines:
    metrics:
      receivers: [otlp, prometheus]
      exporters: [otlp, prometheus]
    traces:
      receivers: [otlp, jaeger]
      processors: [batch]
      exporters: [otlp, zipkin]
Pre-requisites
This tutorial assumes that you have the OpenTelemetry collector installed on the same host as your HAProxy if you plan to monitor a local HAProxy setup. In case you are looking to monitor a remote HAProxy setup, you would need to open up the network port to allow the OpenTelemetry collector to access the metrics.
Logs, however, would require an OpenTelemetry collector to run locally to access the files.
Preparing HAProxy
HAProxy comes pre-installed for most popular Linux distributions. However, in case you do not have it installed, you can download it from here or install it by following the below instructions.
Installing HAProxy on MacOS
You can easily install HAProxy on MacOS using HomeBrew.
brew update && brew install haproxy
Installing HAProxy on Ubuntu
You can install HAProxy on Ubuntu using apt
sudo apt install --no-install-recommends software-properties-common

sudo add-apt-repository ppa:vbernat/haproxy-2.4 -y

sudo apt update && sudo apt install haproxy -y
Installing HAProxy on other Linux distros using yum
yum update && yum install haproxy
Once installed, we can configure HAProxy to contain an endpoint showing the server statistics. In order to do so, modify /etc/haproxy/haproxy.conf file as shown below.
We are intentionally binding the frontend to 8000 proxy to avoid conflict with any other server running on port 80.
You would also require a backend server running behind the scenes to allow HAProxy to forward the traffic.
The status URL configured is http://localhost:8000/haproxy?stats.
global
log /dev/log  local0
---

---

---
frontend haproxy-main
bind *:8000
option forwardfor
stats uri /haproxy?stats
default_backend node_webservers
backend node_webservers
balance roundrobin
server local <your-local-webserver-url> check
Next, for logs, modify the file /etc/rsyslog.d/49-haproxy.conf (file name may differ) and add the below lines.
$AddUnixListenSocket /var/lib/haproxy/dev/log
# Send HAProxy messages to a dedicated logfile
:programname, startswith, "haproxy" {
  /var/log/haproxy.log
  stop
}
Your HAProxy server is ready to serve the metrics and logs now.
For the purpose of this tutorial, we will assume the following:
- HAProxy is installed on the same host when you are setting up OpenTelemetry collector
- Logs for HAProxy will be enabled and stored on the path
/var/log/haproxy.log
Once configured, run the below commands:
sudo service rsyslog restart
sudo service haproxy restart
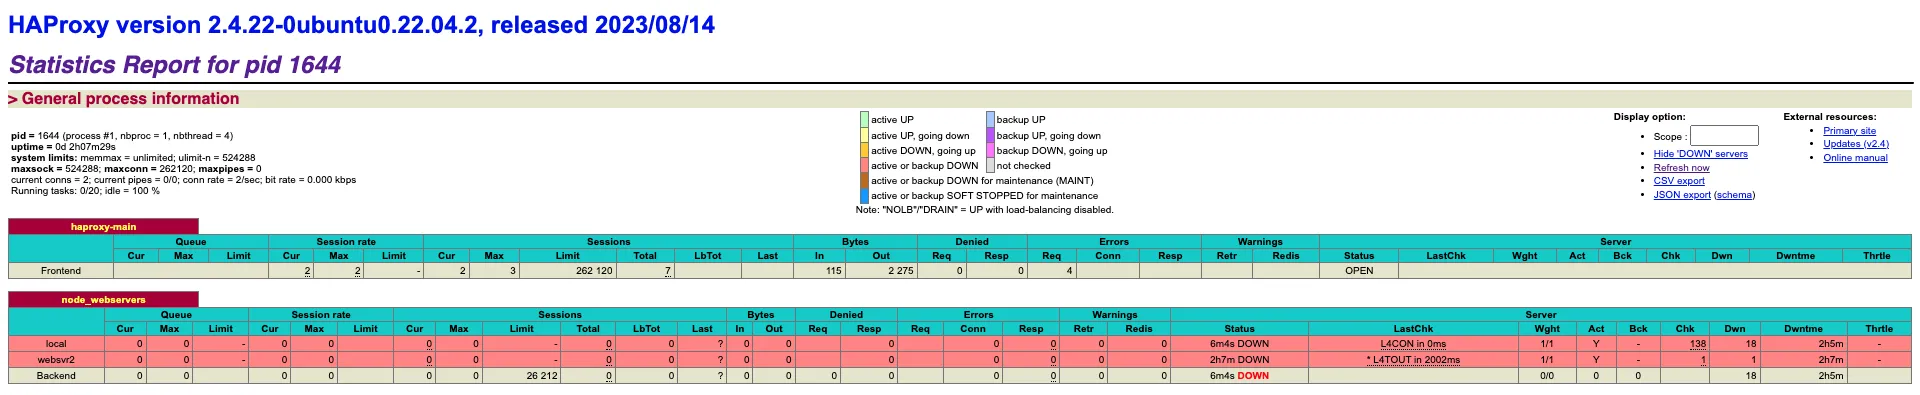
You should start seeing stats on http://localhost:8000/haproxy?stats as shown below.
Setting up OpenTelemetry Collector
Step 1 - Downloading OpenTelemetry Collector
Download the appropriate binary package for your Linux or macOS distribution from the OpenTelemetry Collector releases page. We are using the latest version available at the time of writing this tutorial.
For MACOS (arm64):
curl --proto '=https' --tlsv1.2 -fOL https://github.com/open-telemetry/opentelemetry-collector-releases/releases/download/v0.90.0/otelcol-contrib_0.90.0_darwin_arm64.tar.gz
Step 2 - Extracting the package
Create a new directory named otelcol-contrib and then extract the contents of the archive into this newly created directory with the following command:
mkdir otelcol-contrib && tar xvzf otelcol-contrib_0.90.0_darwin_arm64.tar.gz -C otelcol-contrib
Step 3 - Setting up the configuration file
In this tutorial, we would not just be monitoring the metrics of HAProxy but also visualizing its access and error logs. Let’s create a config.yaml in the otelcol-contrib folder. This will configure the collector with the HAProxy receiver for metrics and File Log receiver for logs.
The configuration file should be created in the same directory where you unpack the otel-collector-contrib binary. If you have globally installed the binary, it is okay to create on any path.
receivers:
  otlp:
    protocols:
      grpc:
        endpoint: localhost:4317
      http:
        endpoint: localhost:4318
  haproxy:
    endpoint: http://127.0.0.1:8000/haproxy?stats
    metrics:
  filelog:
    include:
      - /var/log/haproxy.log

processors:
  batch:
    send_batch_size: 1000
    timeout: 10s
  attributes:
    actions:
      - key: app
        value: haproxy
        action: insert
exporters:
  otlp:
    endpoint: "ingest.{region}.signoz.cloud:443" # replace {region} with your region
    tls:
      insecure: false
    headers:
      "signoz-ingestion-key": "{your-signoz-token}" # Obtain from https://{your-signoz-url}/settings/ingestion-settings
  logging:
    verbosity: detailed
service:
  telemetry:
    metrics:
      address: localhost:8888
  pipelines:
    metrics:
      receivers: [otlp, haproxy]
      processors: [batch]
      exporters: [otlp]
    logs:
      receivers: [filelog]
      processors: [attributes]
      exporters: [otlp]
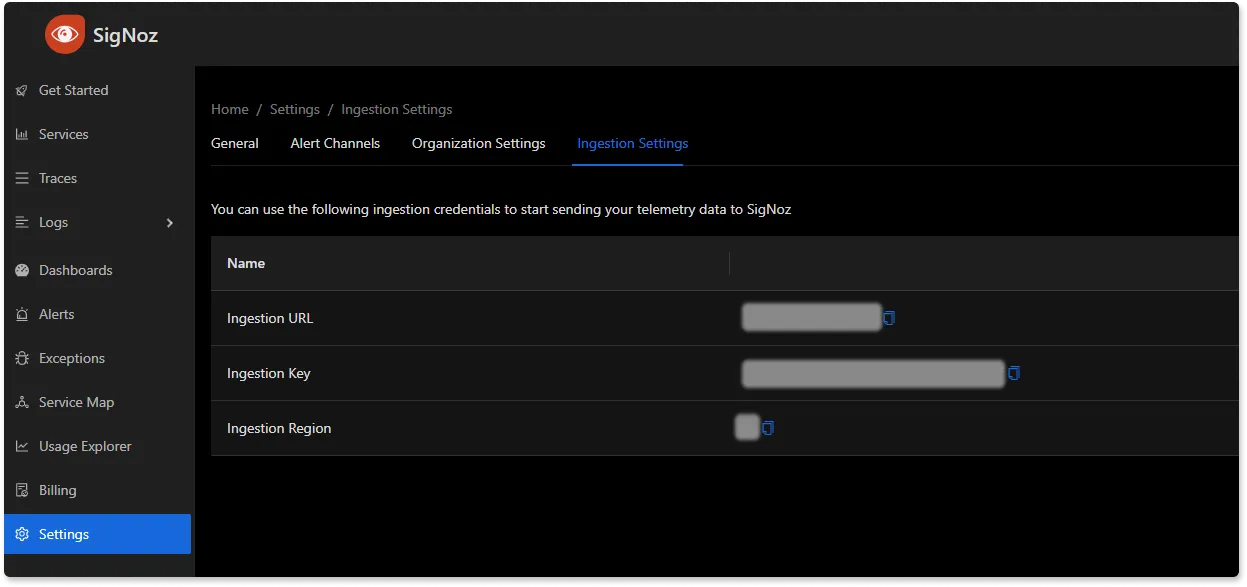
You would need to replace region and signoz-token in the above file with the region of your choice (for Signoz Cloud) and token obtained from Signoz Cloud → Settings → Integration Settings.
The above configuration is quite simple - We utilize the local HAProxy setup exposing statistics on http://localhost:8000/haproxy?stats URL. You can also monitor multiple HAproxy servers by adding multiple receivers, as shown below:
receivers:
  otlp:
    protocols:
      grpc:
        endpoint: localhost:4317
      http:
        endpoint: localhost:4318
  haproxy:
    endpoint: http://127.0.0.1:8000/haproxy?stats
    metrics:
  haproxy/2:
    endpoint: http://<remote-url>/haproxy?stats
    metrics:
  filelog:
    include:
      - /var/log/haproxy.log

processors:
  batch:
    send_batch_size: 1000
    timeout: 10s
  attributes:
    actions:
      - key: app
        value: haproxy
        action: insert
exporters:
  otlp:
    endpoint: "ingest.{region}.signoz.cloud:443" # replace {region} with your region
    tls:
      insecure: false
    headers:
      "signoz-ingestion-key": "{your-signoz-token}" # Obtain from https://{your-signoz-url}/settings/ingestion-settings
  logging:
    verbosity: detailed
service:
  telemetry:
    metrics:
      address: localhost:8888
  pipelines:
    metrics:
      receivers: [otlp, haproxy, haproxy/2]
      processors: [batch]
      exporters: [otlp]
    logs:
      receivers: [filelog]
      processors: [attributes]
      exporters: [otlp]
Step 4 - Running the collector service
Every Collector release includes an otelcol executable that you can run. Since we’re done with configurations, we can run the collector service with the following command.
From the otelcol-contrib, run the following command:
./otelcol-contrib --config ./config.yaml
If you want to run it in the background -
./otelcol-contrib --config ./config.yaml &> otelcol-output.log & echo "$\!" > otel-pid
Step 5 - Debugging the output
If you want to see the output of the logs, you may look it up with:
tail -f -n 50 otelcol-output.log
tail 50 will give the last 50 lines from the file otelcol-output.log
You can stop the collector service with the following command:
kill "$(< otel-pid)"
You should start seeing the metrics on your Signoz Cloud UI in about 30 seconds.
Monitoring with SigNoz Dashboard
You can import this dashboard JSON into your SigNoz environment quite easily to monitor your HAproxy instance.
Once the above setup is done, you will be able to access the metrics in the SigNoz dashboard. You can go to the Dashboards tab and try adding a new panel. You can learn how to create dashboards in SigNoz here.
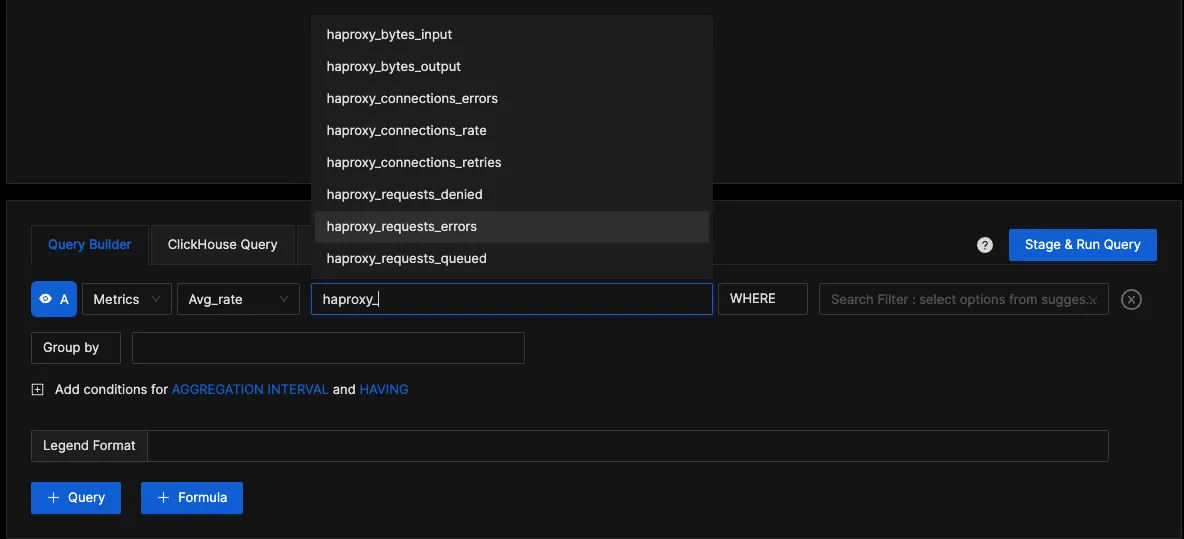
You can easily create charts with query builder in SigNoz. Here are the steps to add a new panel to the dashboard.
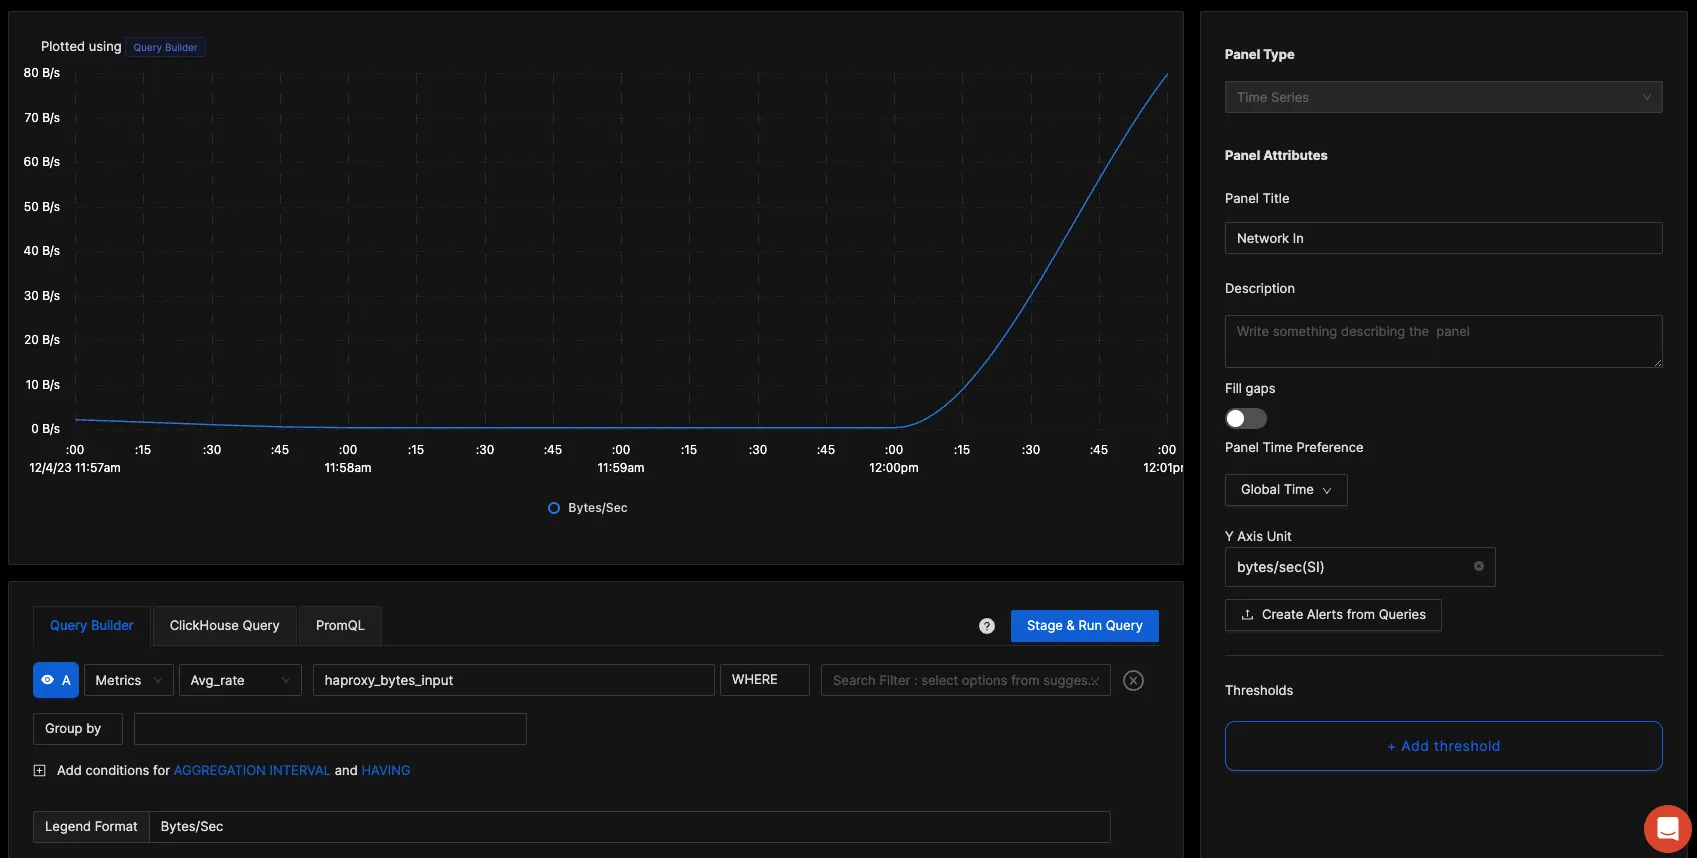
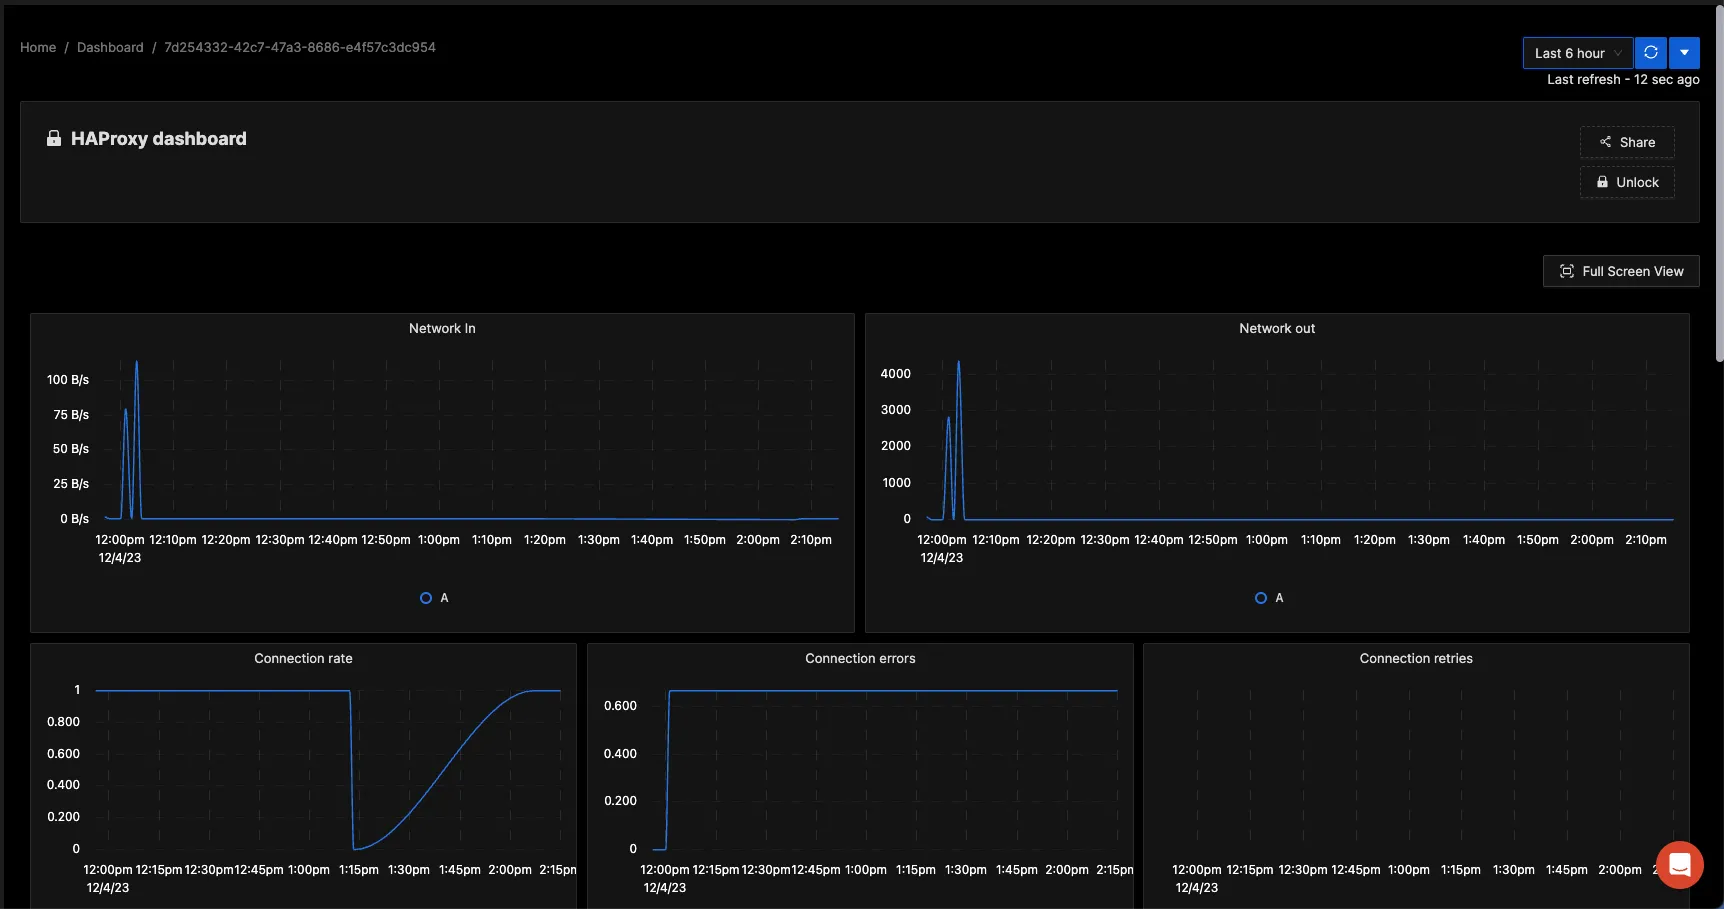
You can build a complete dashboard around various metrics emitted. Here’s a look at a sample dashboard we built out using the metrics collected.
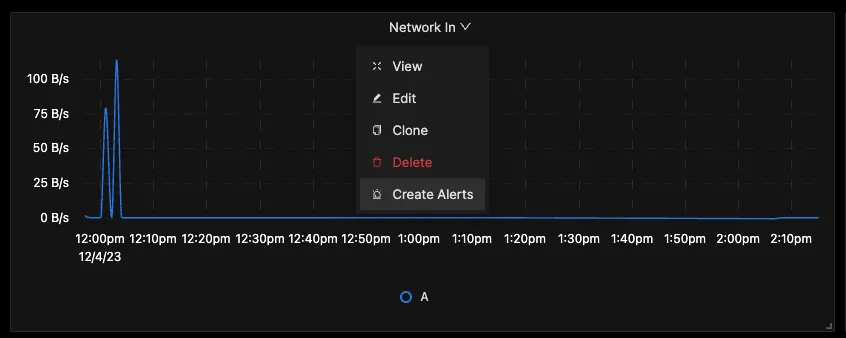
You can also create alerts on any metric. Learn how to create alerts here.
Visualizing HAProxy logs
In order to visualize the logs sent by OpenTelemetry collector, head over to Signoz → Logs → Logs Explorer. In the logs explorer, you can filter your logs using the tag app=haproxy, as shown in the image below:
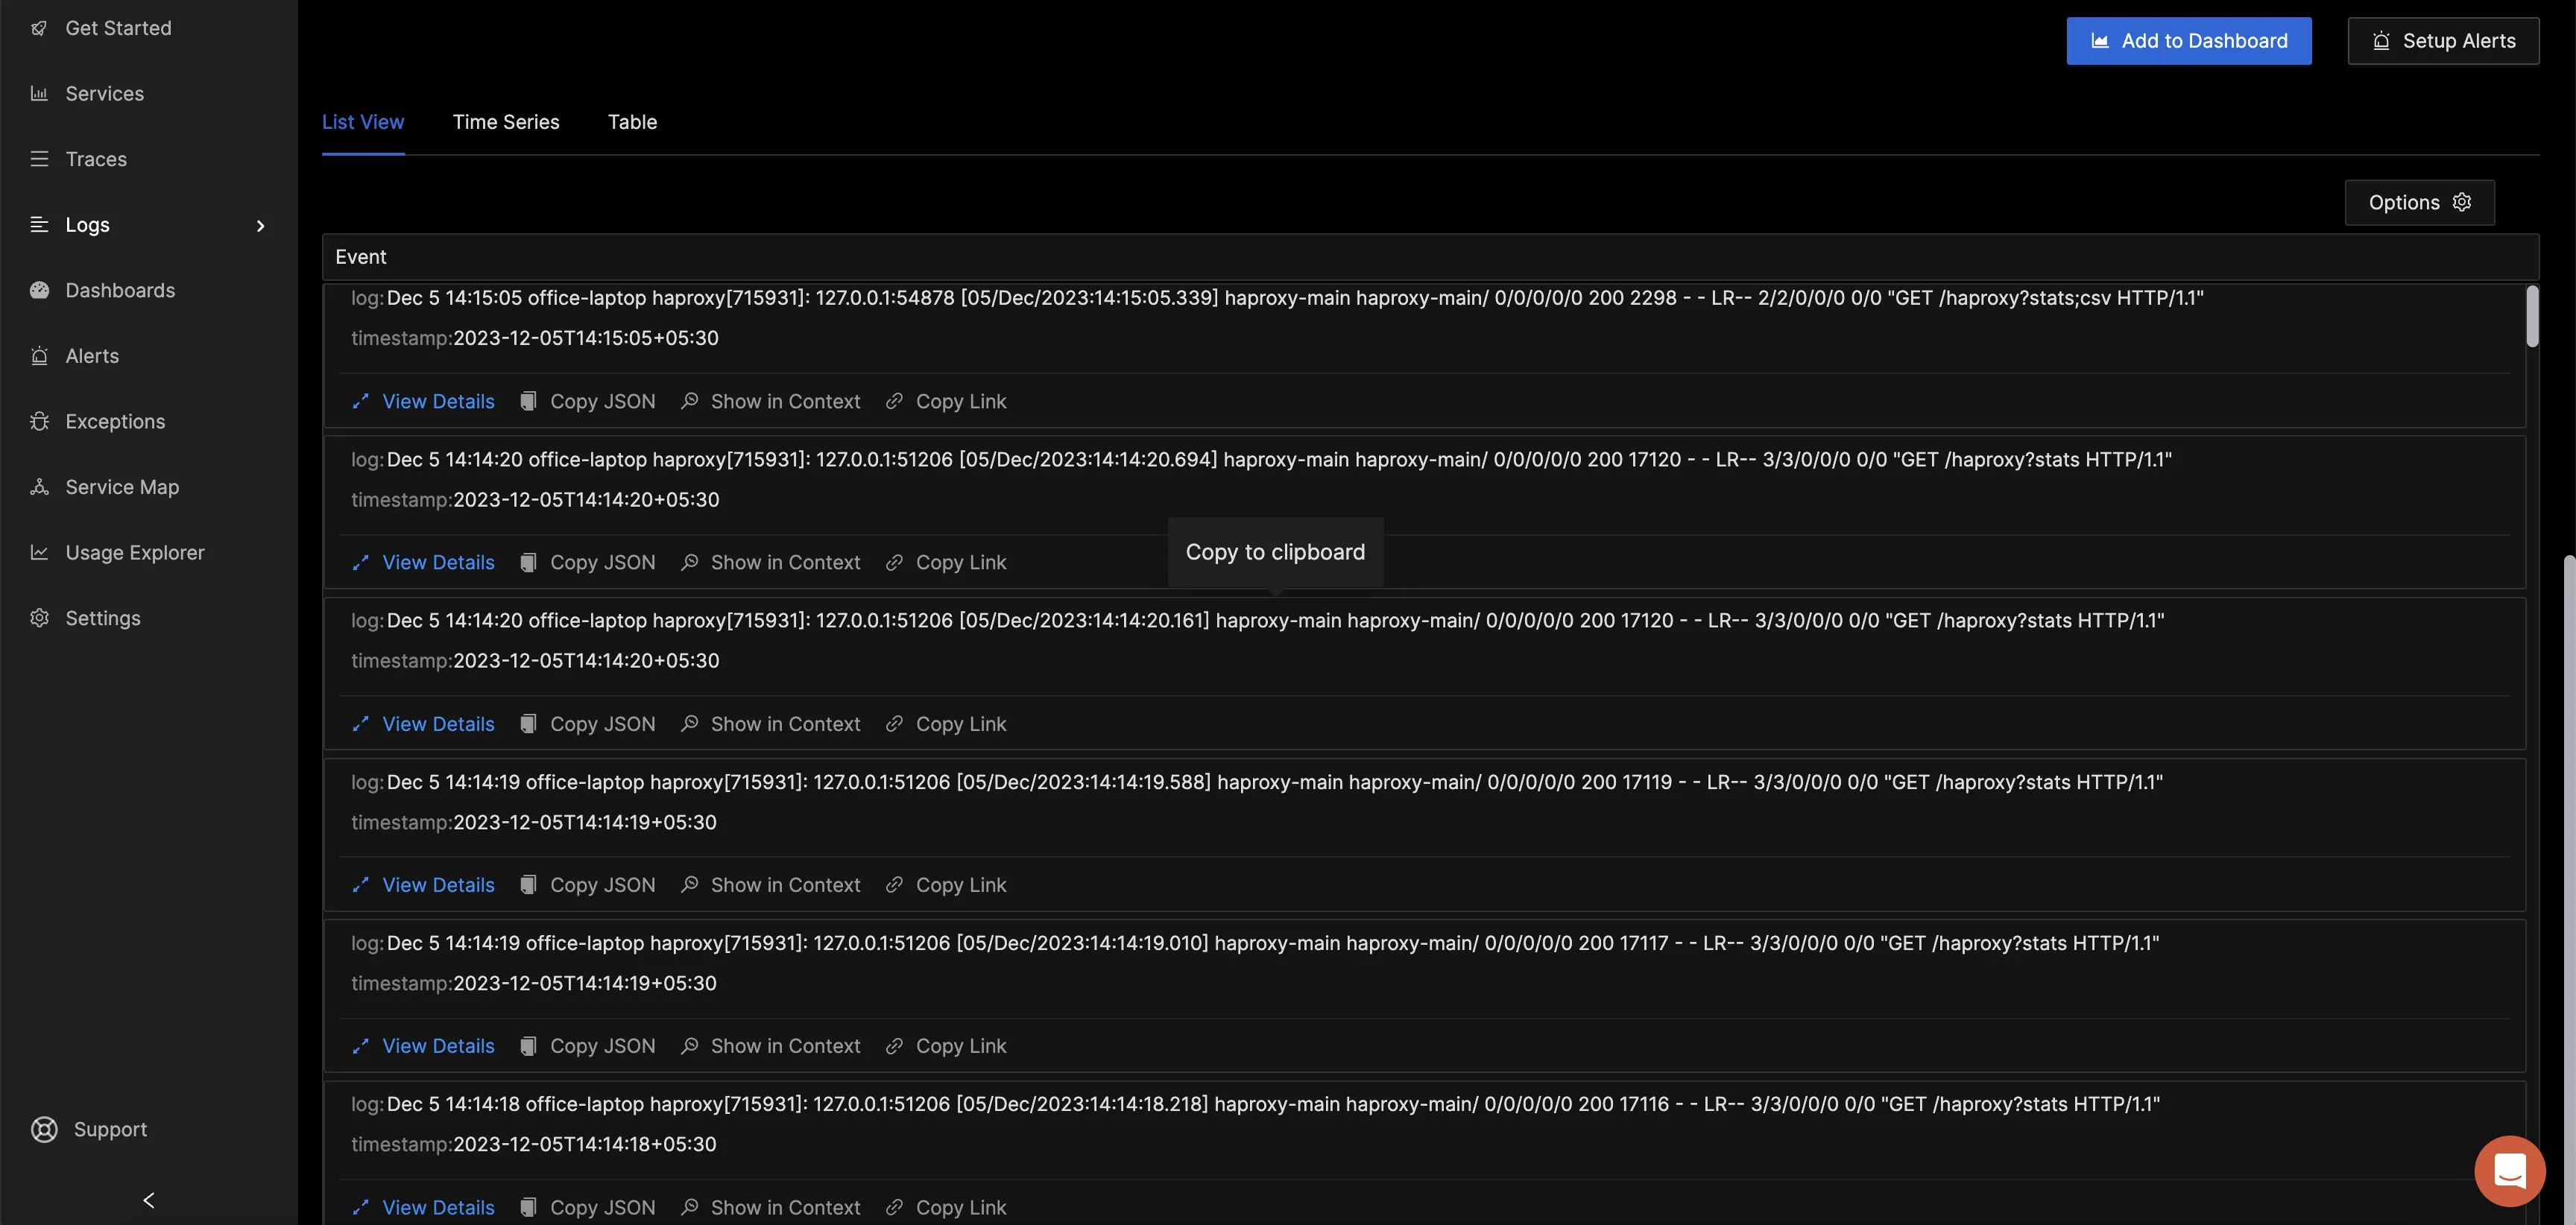
You can visualize the volume of logs as well as the actual log lines easily in this UI.
Reference: HAProxy metrics collected by OpenTelemetry Collector
Below HAProxy metics are enabled by default to be collected by OpenTelemetry Collector:
| Metric | Description | Type |
|---|---|---|
| haproxy_bytes_input | Incoming Network traffic | Sum |
| haproxy_bytes_output | Outgoing Network traffic | Sum |
| haproxy_connections_errors | Total Connection errors | Sum |
| haproxy_connections_rate | Rate of connections | Gauge |
| haproxy_connections_retries | Total connection retries | Sum |
| haproxy_requests_denied | Total requests denied | Sum |
| haproxy_requests_errors | Total request errors | Sum |
| haproxy_requests_queued | Total requests in queue | Sum |
| haproxy_requests_rate | Net request rate | Gauge |
| haproxy_requests_redispatched | Total requests redispatched | Sum |
| haproxy_requests_total | Total number of requests handled | Sum |
| haproxy_responses_denied | Total number of responses denied | Sum |
| haproxy_responses_errors | Total errors in responses | Sum |
| haproxy_server_selected_total | Number of times server was selected when redispatching the request | Sum |
| haproxy_sessions_average | Average session time | Gauge |
| haproxy_sessions_count | Total active sessions | Gauge |
| haproxy_sessions_rate | Number of sessions per second | Gauge |
The below metrics need to be explicitly enabled for haproxyreceiver:
| Metric | Description | Type |
|---|---|---|
| haproxy_clients_canceled | Number of data transfers aborted by the client | Sum |
| haproxy_compression_bypass | Number of bytes bypassing the compression engine | Sum |
| haproxy_compression_count | Number of HTTP responses that got compressed | Sum |
| haproxy_compression_input | Total bytes fed into the compressor | Sum |
| haproxy_compression_output | Total bytes emitted out by compressor | Sum |
| haproxy_connections_total | Total connections to the frontend | Sum |
| haproxy_downtime | Backend downtime | Sum |
| haproxy_failed_checks | Total failed backend checks | Sum |
| haproxy_sessions_total | Total HAProxy sessions created during the lifetime | Sum |
Attributes
All the above metrics have the below three attributes associated:
| Name | Description | Values | Enabled |
|---|---|---|---|
| haproxy_addr | address:port or "unix". IPv6 has brackets around the address. | Any Str | true |
| haproxy_proxy_name | Proxy name | Any Str | true |
| haproxy_service_name | Service name (FRONTEND for frontend, BACKEND for backend, any name for server/listener) | Any Str | true |
Conclusion
In this tutorial, you installed an OpenTelemetry Collector to collect HAProxy metrics and logs and sent the collected data to SigNoz for monitoring and alerts.
Visit our complete guide on OpenTelemetry Collector to learn more about it. OpenTelemetry is quietly becoming the world standard for open-source observability, and by using it, you can have advantages like a single standard for all telemetry signals, no vendor lock-in, etc.
SigNoz is an open-source OpenTelemetry-native APM that can be used as a single backend for all your observability needs.
Further Reading
