Observing LlamaIndex Apps with OpenTelemetry + SigNoz
LlamaIndex has become a popular choice for building Retrieval-Augmented Generation (RAG) applications, helping developers seamlessly connect large language models with private or domain-specific data. But RAG workflows can be complex with slow retrieval times, irrelevant or inconsistent responses, and silent failures in the data pipeline can all degrade the user experience.
That’s why observability is essential. By instrumenting your LlamaIndex-based RAG app with OpenTelemetry and sending the telemetry data to SigNoz, you can track retrieval and generation performance, pinpoint bottlenecks, catch errors early, and gain actionable insights into how your app behaves in production with minimal setup.
Why Observability Matters for LlamaIndex RAG Apps
RAG applications built with LlamaIndex are like well-orchestrated conversations between multiple moving parts. You’ve got a retriever pulling the most relevant documents, a vector database storing embeddings, and an LLM generating the final answer, all stitched together by your application logic. When it works, it feels magical. But when something slows down or breaks, it can be a nightmare to figure out why.
Maybe your retriever is taking too long because the vector store is under heavy load. Maybe the LLM is producing off-target answers because the retrieval stage returned poor results. Or maybe a third-party API silently failed, causing gaps in the data pipeline. Without observability, you’re left guessing.
This is where tools like OpenTelemetry and SigNoz shine. With proper instrumentation, you can see exactly how long each step of your RAG workflow takes, spot bottlenecks before they impact users, and understand errors in their full context. Instead of sifting through logs blindly, you get a clear, connected view of your entire app’s behaviour, so you can keep your LlamaIndex-powered RAG app running smoothly.
How OpenTelemetry + SigNoz can help
What is OpenTelemetry?
OpenTelemetry (OTel) is an open-source observability framework that provides a unified way to collect telemetry data: traces, metrics, and logs from across your application stack. It’s a CNCF project with support for multiple programming languages and a wide range of integrations. The beauty of OTel is that you instrument your code once, and you can send that data to any observability backend you choose without any vendor lock-in. For LlamaIndex-based RAG apps, this means you can capture detailed performance and error data from each stage of the retrieval and generation process without reinventing the wheel.
What is SigNoz?
SigNoz is an all-in-one observability platform built on top of OpenTelemetry. It provides a rich UI to visualise traces, monitor performance metrics, and set alerts, all in real time. With SigNoz, you can drill into slow retrieval calls, spot bottlenecks in LLM responses, or trace a user request end-to-end across your RAG pipeline. By pairing OpenTelemetry’s standardised data collection with SigNoz’s powerful analysis tools, you get a complete observability stack tailored for modern, distributed, and AI-driven applications.
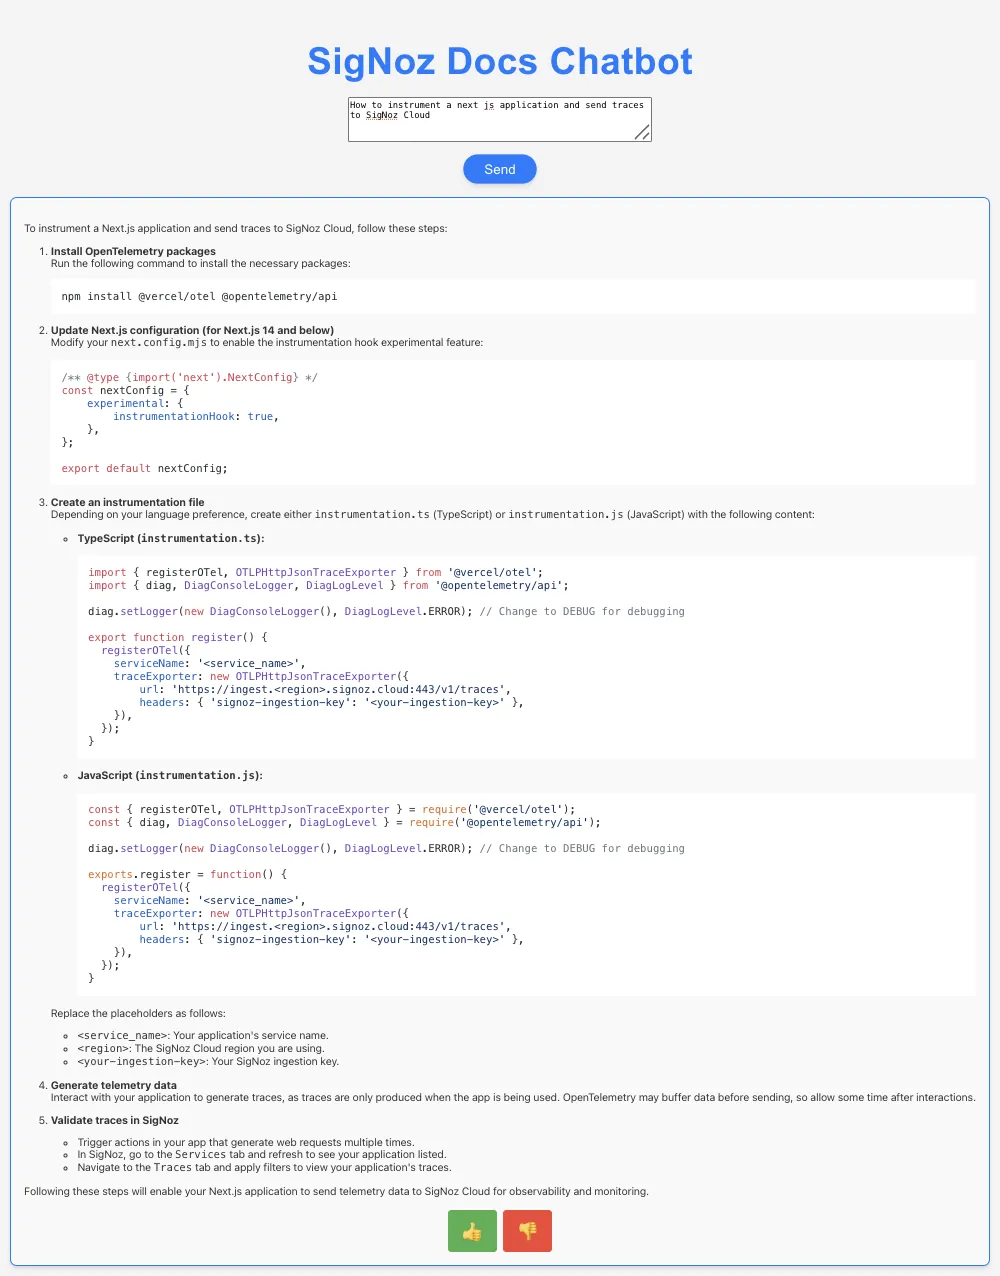
To demonstrate how OpenTelemetry and SigNoz work together in a real-world LlamaIndex RAG scenario, we created a small demo app that utilises the SigNoz developer documentation to generate an AI-powered chatbot.
Building the Example App: A SigNoz Docs RAG Chatbot
To make this guide more concrete, we’ve built a RAG chatbot powered by LlamaIndex, OpenTelemetry, and SigNoz. The idea is simple: the LLM has ingested all of the SigNoz developer documentation, so you can ask it any question about SigNoz—how to set up tracing, configure dashboards, or troubleshoot common issues—and it will pull the answer directly from the docs.
Under the hood, the app uses LlamaIndex to structure and query the ingested documentation, a vector store to handle semantic search, and an LLM to generate user-friendly answers. With OpenTelemetry instrumentation baked in, every retrieval, embedding generation, and LLM call is traced and sent to SigNoz, giving a full picture of the app’s performance and behaviour.
To make it more interactive, the chatbot also lets users give feedback on the retrieved answer, whether it was helpful or not. This feedback loop can be logged and analysed in SigNoz, helping identify where the retrieval or generation steps might need improvement.
Try the SigNoz Docs RAG Chatbot Yourself
Want to explore the RAG chatbot in action? Clone the repo, install dependencies, and follow the setup steps in the README to start sending traces and logs from your local app to SigNoz.
git clone https://github.com/SigNoz/llamaindex-rag-opentelemetry-demo.git
After cloning the repo and getting set up, you can run the chatbot locally and start exploring SigNoz through your queries. If you’d rather instrument your own LlamaIndex app, continue to the next section for detailed instructions on integrating OpenTelemetry and SigNoz.
Instrument your LlamaIndex RAG app
Prerequisites
- A Python application using Python 3.8+
- LlamaIndex integrated into your app, with document ingestion and query interfaces set up
- Basic understanding of RAG (Retrieval-Augmented Generation) workflows
- A SigNoz Cloud account with an active ingestion key
pipinstalled for managing Python packages- Internet access to send telemetry data to SigNoz Cloud
- (Optional but recommended) A Python virtual environment to isolate dependencies
Instrumenting LlamaIndex and Exporting to SigNoz
To capture detailed telemetry from LlamaIndex without modifying your core application logic, we use OpenInference, a community-driven standard that provides pre-built instrumentation for popular AI frameworks like LlamaIndex, built on top of OpenTelemetry. This allows you to trace your LlamaIndex application with minimal configuration.
Check out detailed instructions on how to set up OpenInference instrumentation in your LlamaIndex application over here.
Step 1: Install OpenInference and OpenTelemetry-related packages
pip install openinference-instrumentation-llama-index \
opentelemetry-exporter-otlp \
opentelemetry-sdk
Step 2: Import the necessary modules in your Python application
from opentelemetry.exporter.otlp.proto.http.trace_exporter import OTLPSpanExporter
from opentelemetry.sdk.trace import TracerProvider
from opentelemetry.sdk.trace.export import BatchSpanProcessor
from opentelemetry.sdk.resources import Resource
from openinference.instrumentation.llama_index import LlamaIndexInstrumentor
Step 3: Set up the OpenTelemetry Tracer Provider to send traces directly to SigNoz Cloud
resource = Resource.create({"service.name": "<service_name>"})
provider = TracerProvider(resource=resource)
span_exporter = OTLPSpanExporter(
    endpoint="https://ingest.<region>.signoz.cloud:443/v1/traces",
    headers={"signoz-ingestion-key": "<your-ingestion-key>"},
)
provider.add_span_processor(BatchSpanProcessor(span_exporter))
<service_name>is the name of your service- Set the
<region>to match your SigNoz Cloud region - Replace
<your-ingestion-key>with your SigNoz ingestion key
Step 4: Instrument LlamaIndex using OpenInference and the configured Tracer Provider
Use the LlamaIndexInstrumentor from OpenInference to automatically trace LlamaIndex operations with your OpenTelemetry setup:
LlamaIndexInstrumentor().instrument(tracer_provider=provider)
📌 Important: Place this code at the start of your application logic — before any LlamaIndex functions are called or used — to ensure telemetry is correctly captured.
Your LlamaIndex commands should now automatically emit traces, spans, and attributes.
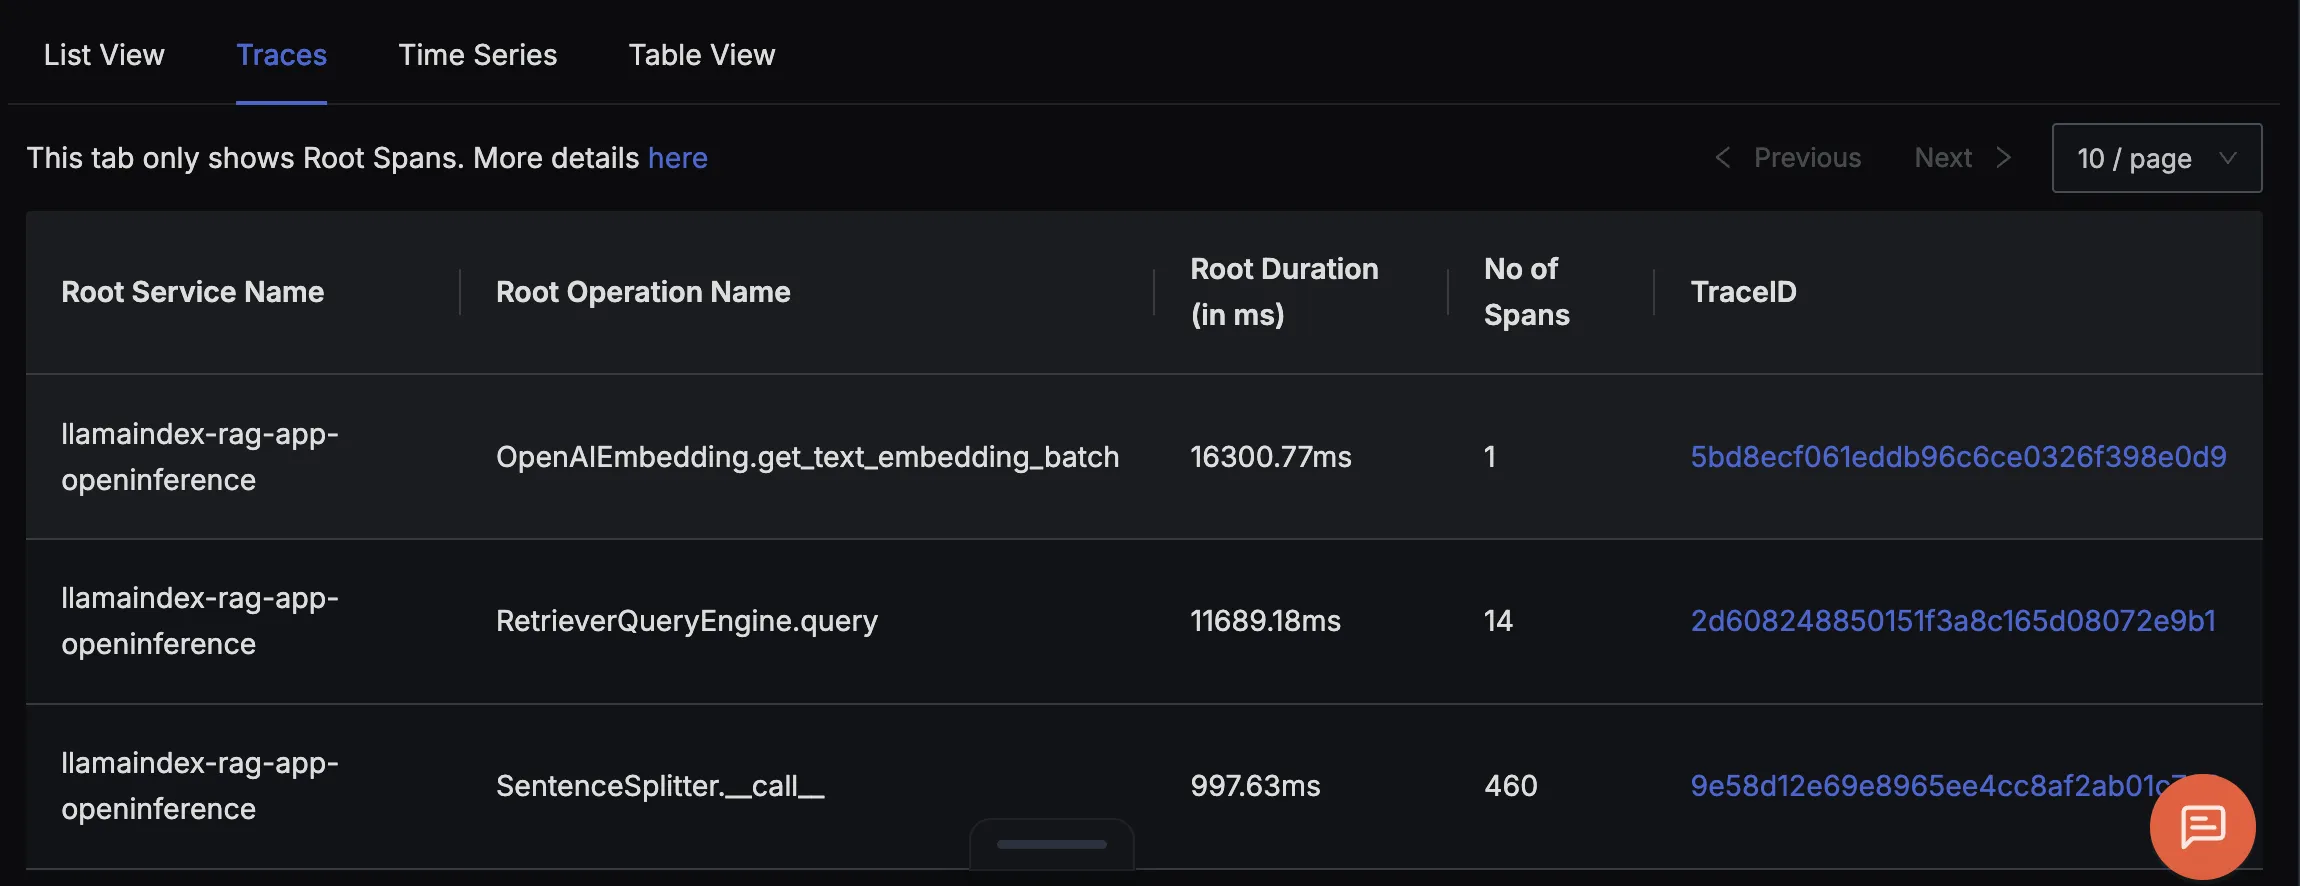
Finally, you should be able to view this data in Signoz Cloud under the traces tab:
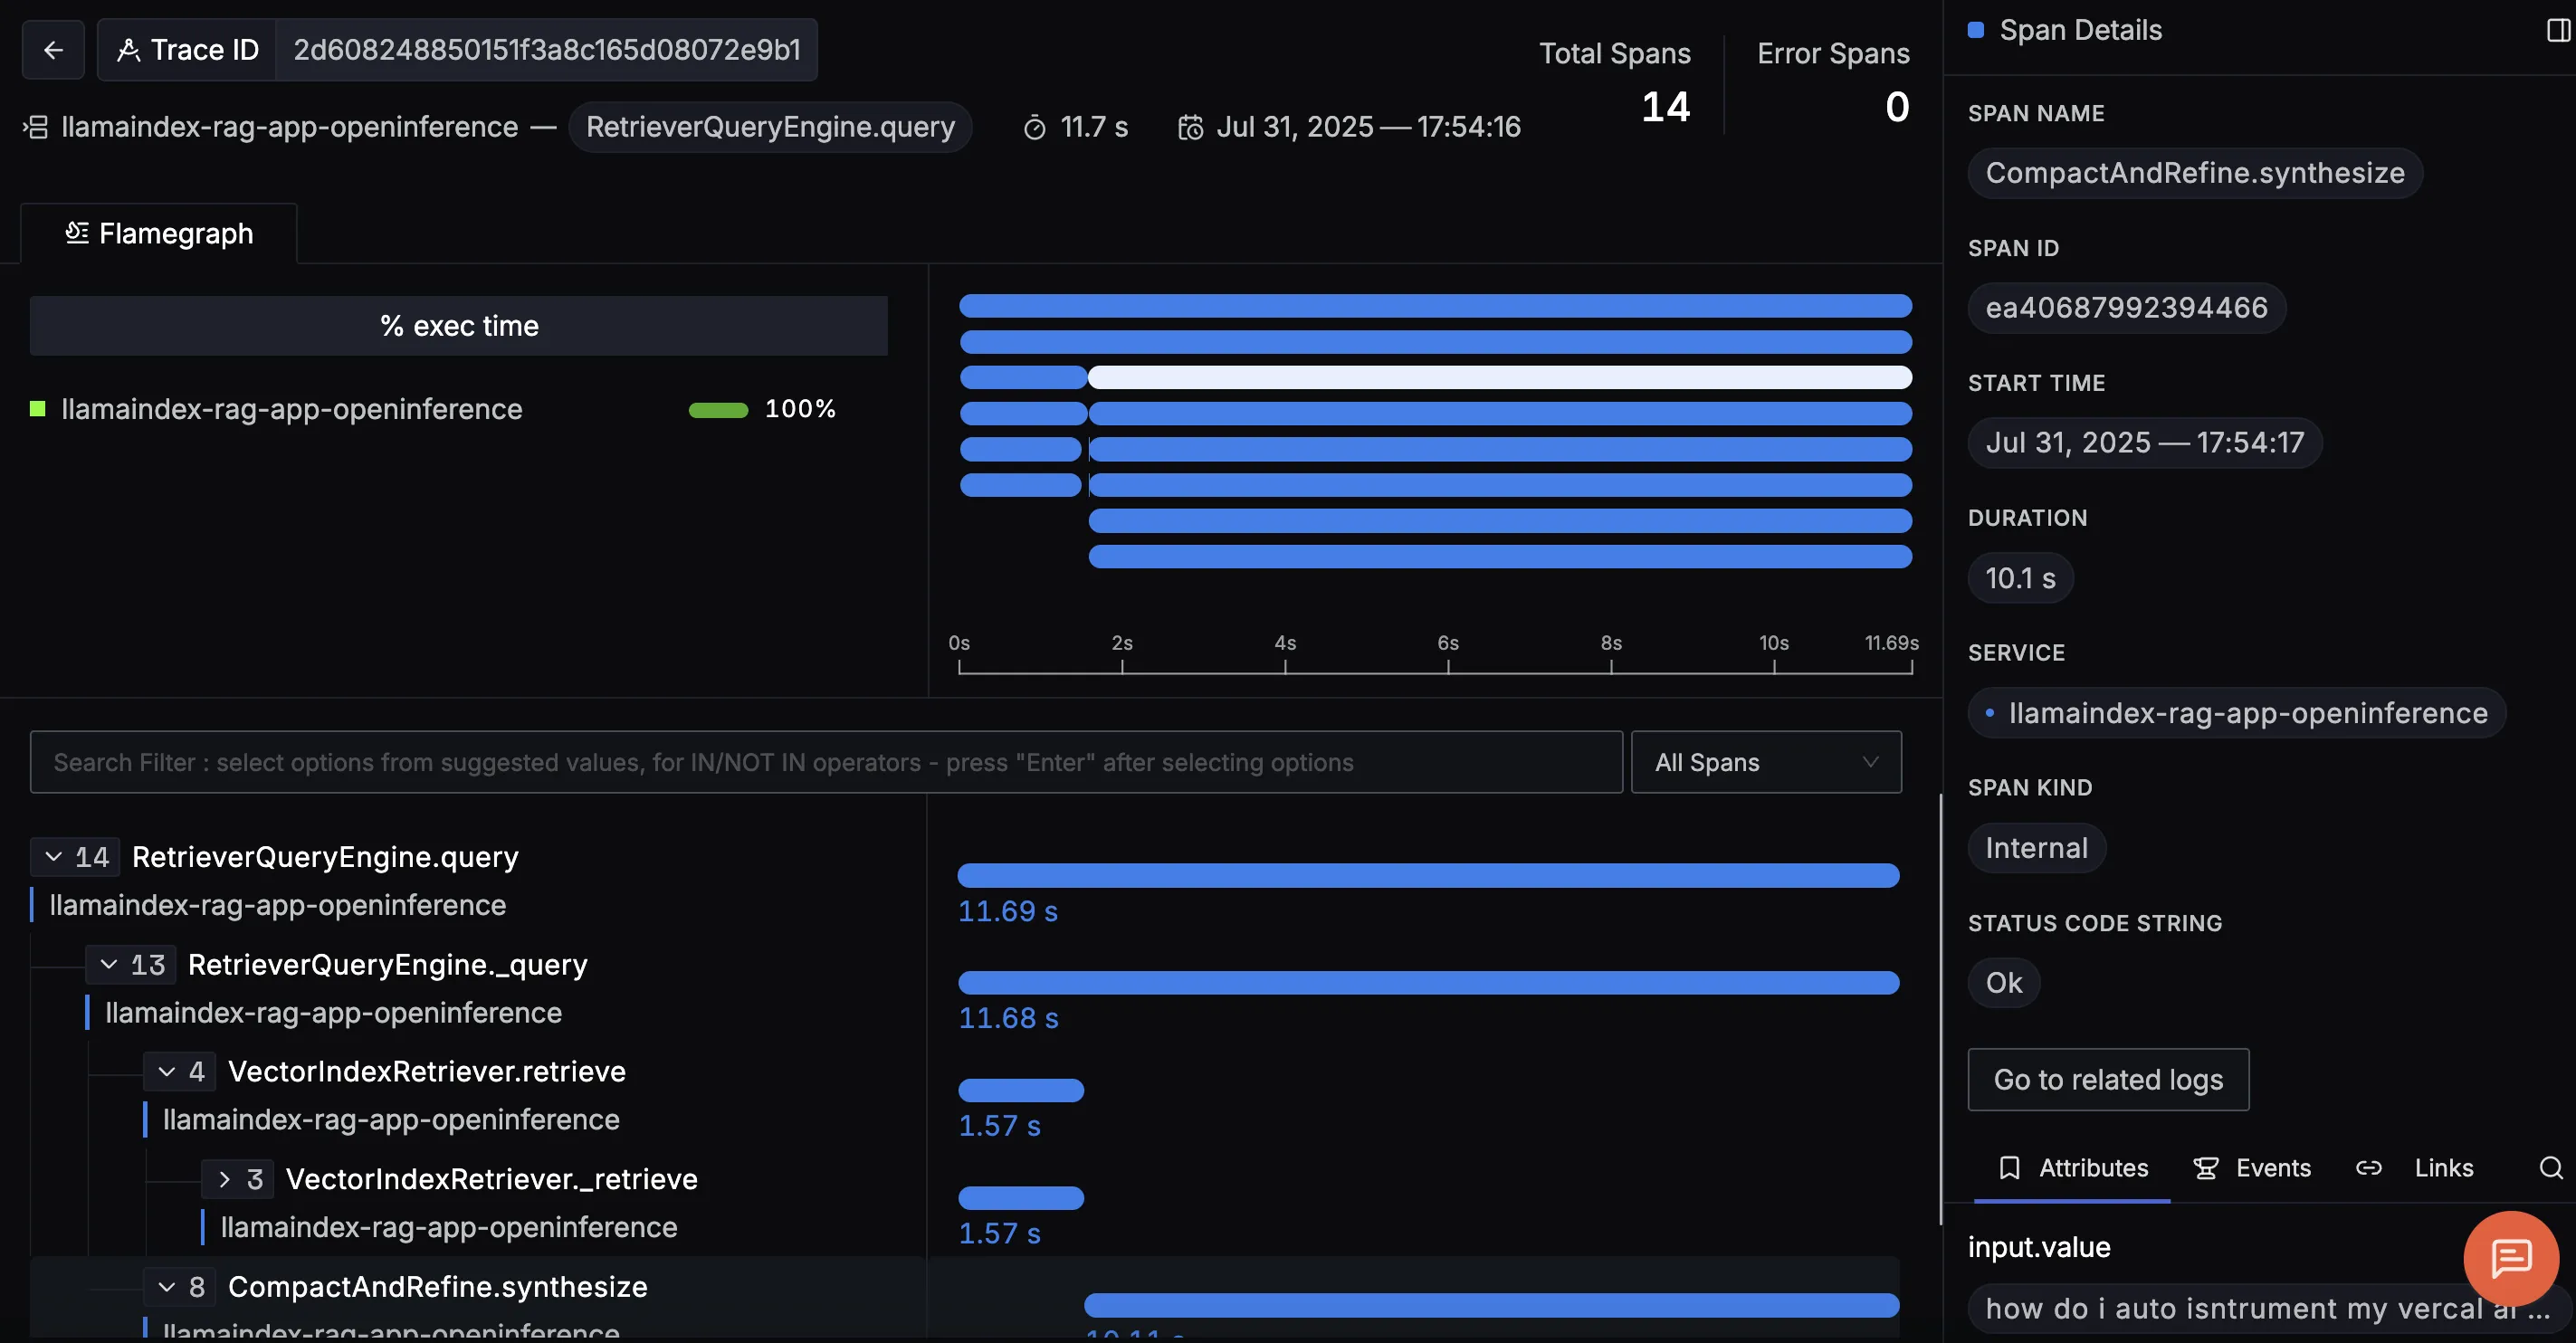
When you click on a trace ID in SigNoz, you'll see a detailed view of the trace, including all associated spans, along with their events and attributes.
Adding Logging to Your App
In addition to traces and metrics, you can also emit logs from your LlamaIndex app to capture valuable runtime information. For example, you might log the number of document chunks embedded into vectors, the number of most relevant documents retrieved during a query, or the feedback provided by users on the generated answers. These logs, when correlated with traces in SigNoz, give you richer context for debugging issues and improving your RAG pipeline.
Step 1. Install OpenTelemetry packages for logging
pip install opentelemetry-api
pip install opentelemetry-sdk
pip install opentelemetry-exporter-otlp
Step 2. Create telemetry.py file
from opentelemetry.sdk._logs import LoggerProvider, LoggingHandler
from opentelemetry.sdk._logs.export import BatchLogRecordProcessor
from opentelemetry.exporter.otlp.proto.grpc._log_exporter import OTLPLogExporter

resource = Resource(attributes={
        SERVICE_NAME: "<service_name>"
    })

def configure_logging():
    load_dotenv()
    signoz_key = os.getenv("SIGNOZ_INGESTION_KEY")


    logger_provider = LoggerProvider(resource=resource)
    otlp_log_exporter = OTLPLogExporter(
        endpoint="ingest.<region>.signoz.cloud:443",
        headers=(("signoz-ingestion-key", "<your-ingestion-key>"),),
        insecure=False
    )
    logger_provider.add_log_record_processor(BatchLogRecordProcessor(otlp_log_exporter))

    # Attach OpenTelemetry logging handler
    logging.setLoggerClass(logging.getLoggerClass())
    logging.basicConfig(level=logging.INFO)
    handler = LoggingHandler(level=logging.INFO, logger_provider=logger_provider)
    logging.getLogger().addHandler(handler)
<service_name>is the name of your service- Set the
<region>to match your SigNoz Cloud region - Replace
<your-ingestion-key>with your SigNoz ingestion key
Step 3. Import and call configure_logging() in your LlamaIndex app
from telemetry import configure_logging
configure_logging()
Step 4. Initialize your logger object and emit logs
logger = logging.getLogger(__name__)
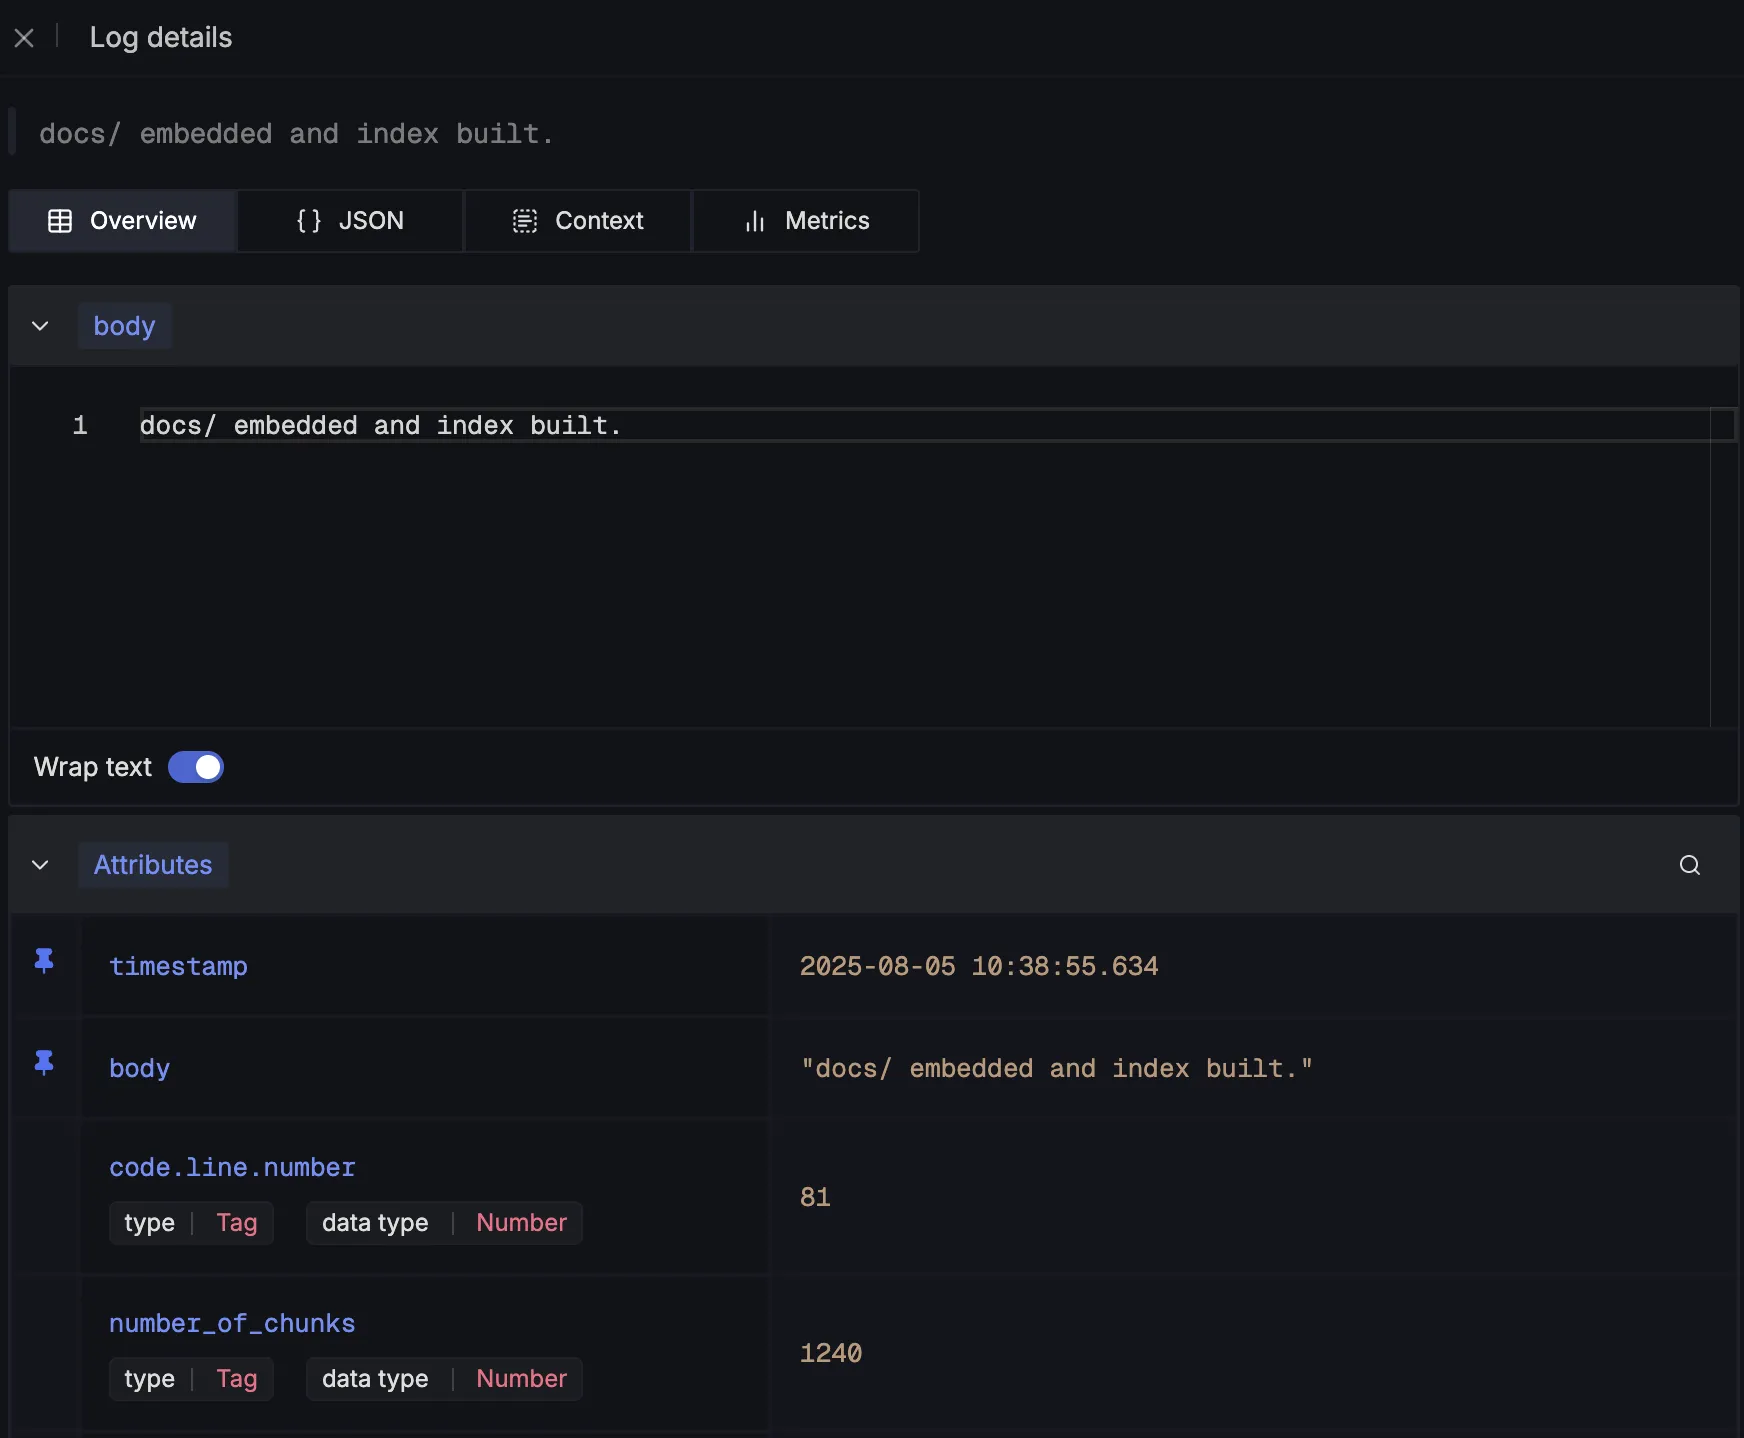
First, we log the number of embedded chunks generated from the ingested documents:
logger.info(
  "docs/ embedded and index built.",
  extra={
      "number_of_chunks": len(all_nodes),
  }
)
After being emitted, we can see these log details in SigNoz:
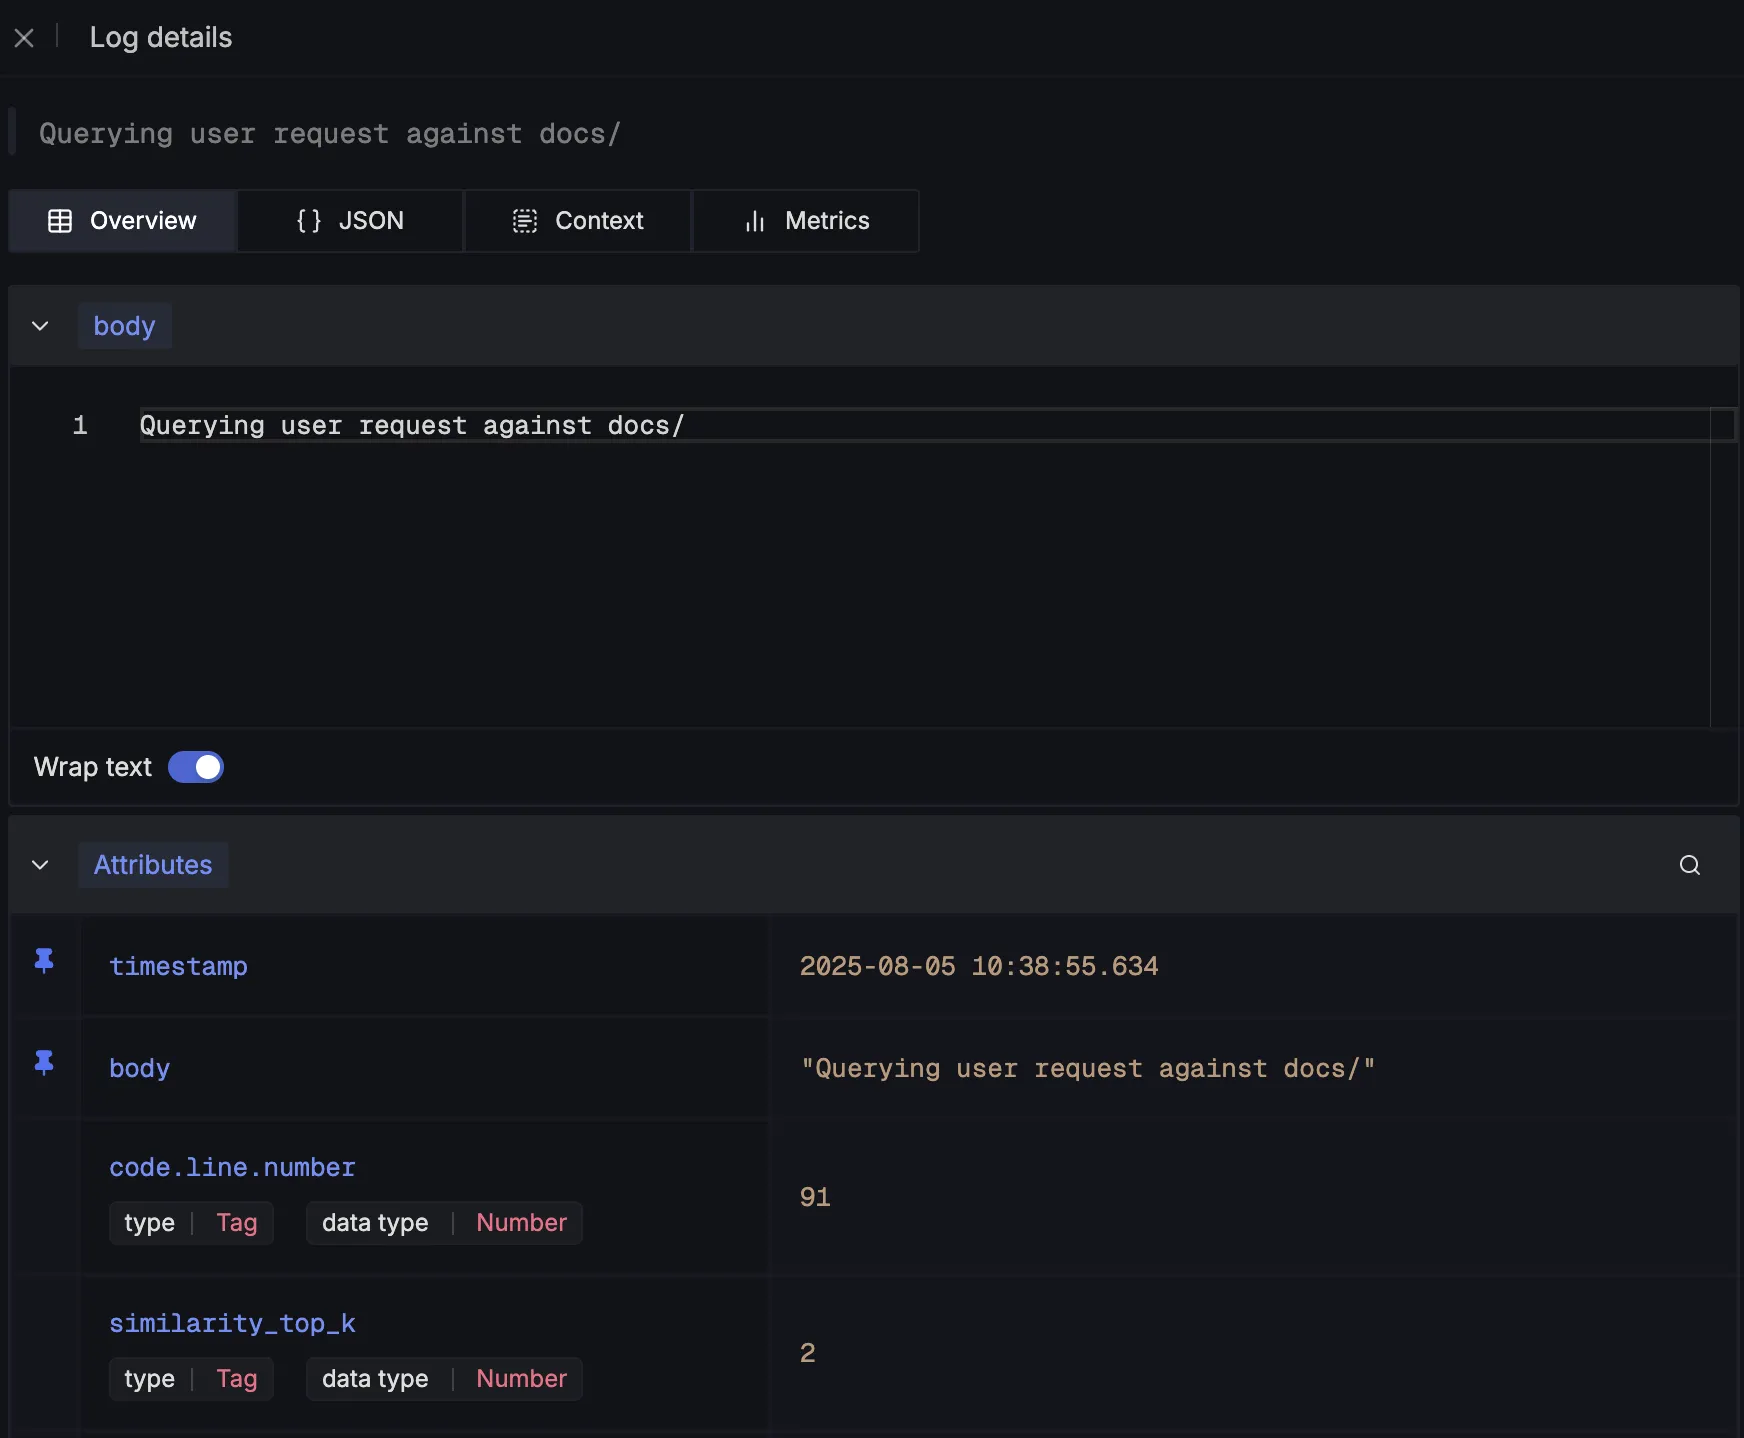
Next, we capture details about the retrieval step by logging the number of top relevant documents fetched for a query:
logger.info(
  "Querying user request against docs/",
  extra={
      "similarity_top_k": SIMILARITY_TOP_K,
  }
)
These are what the log details would look like:
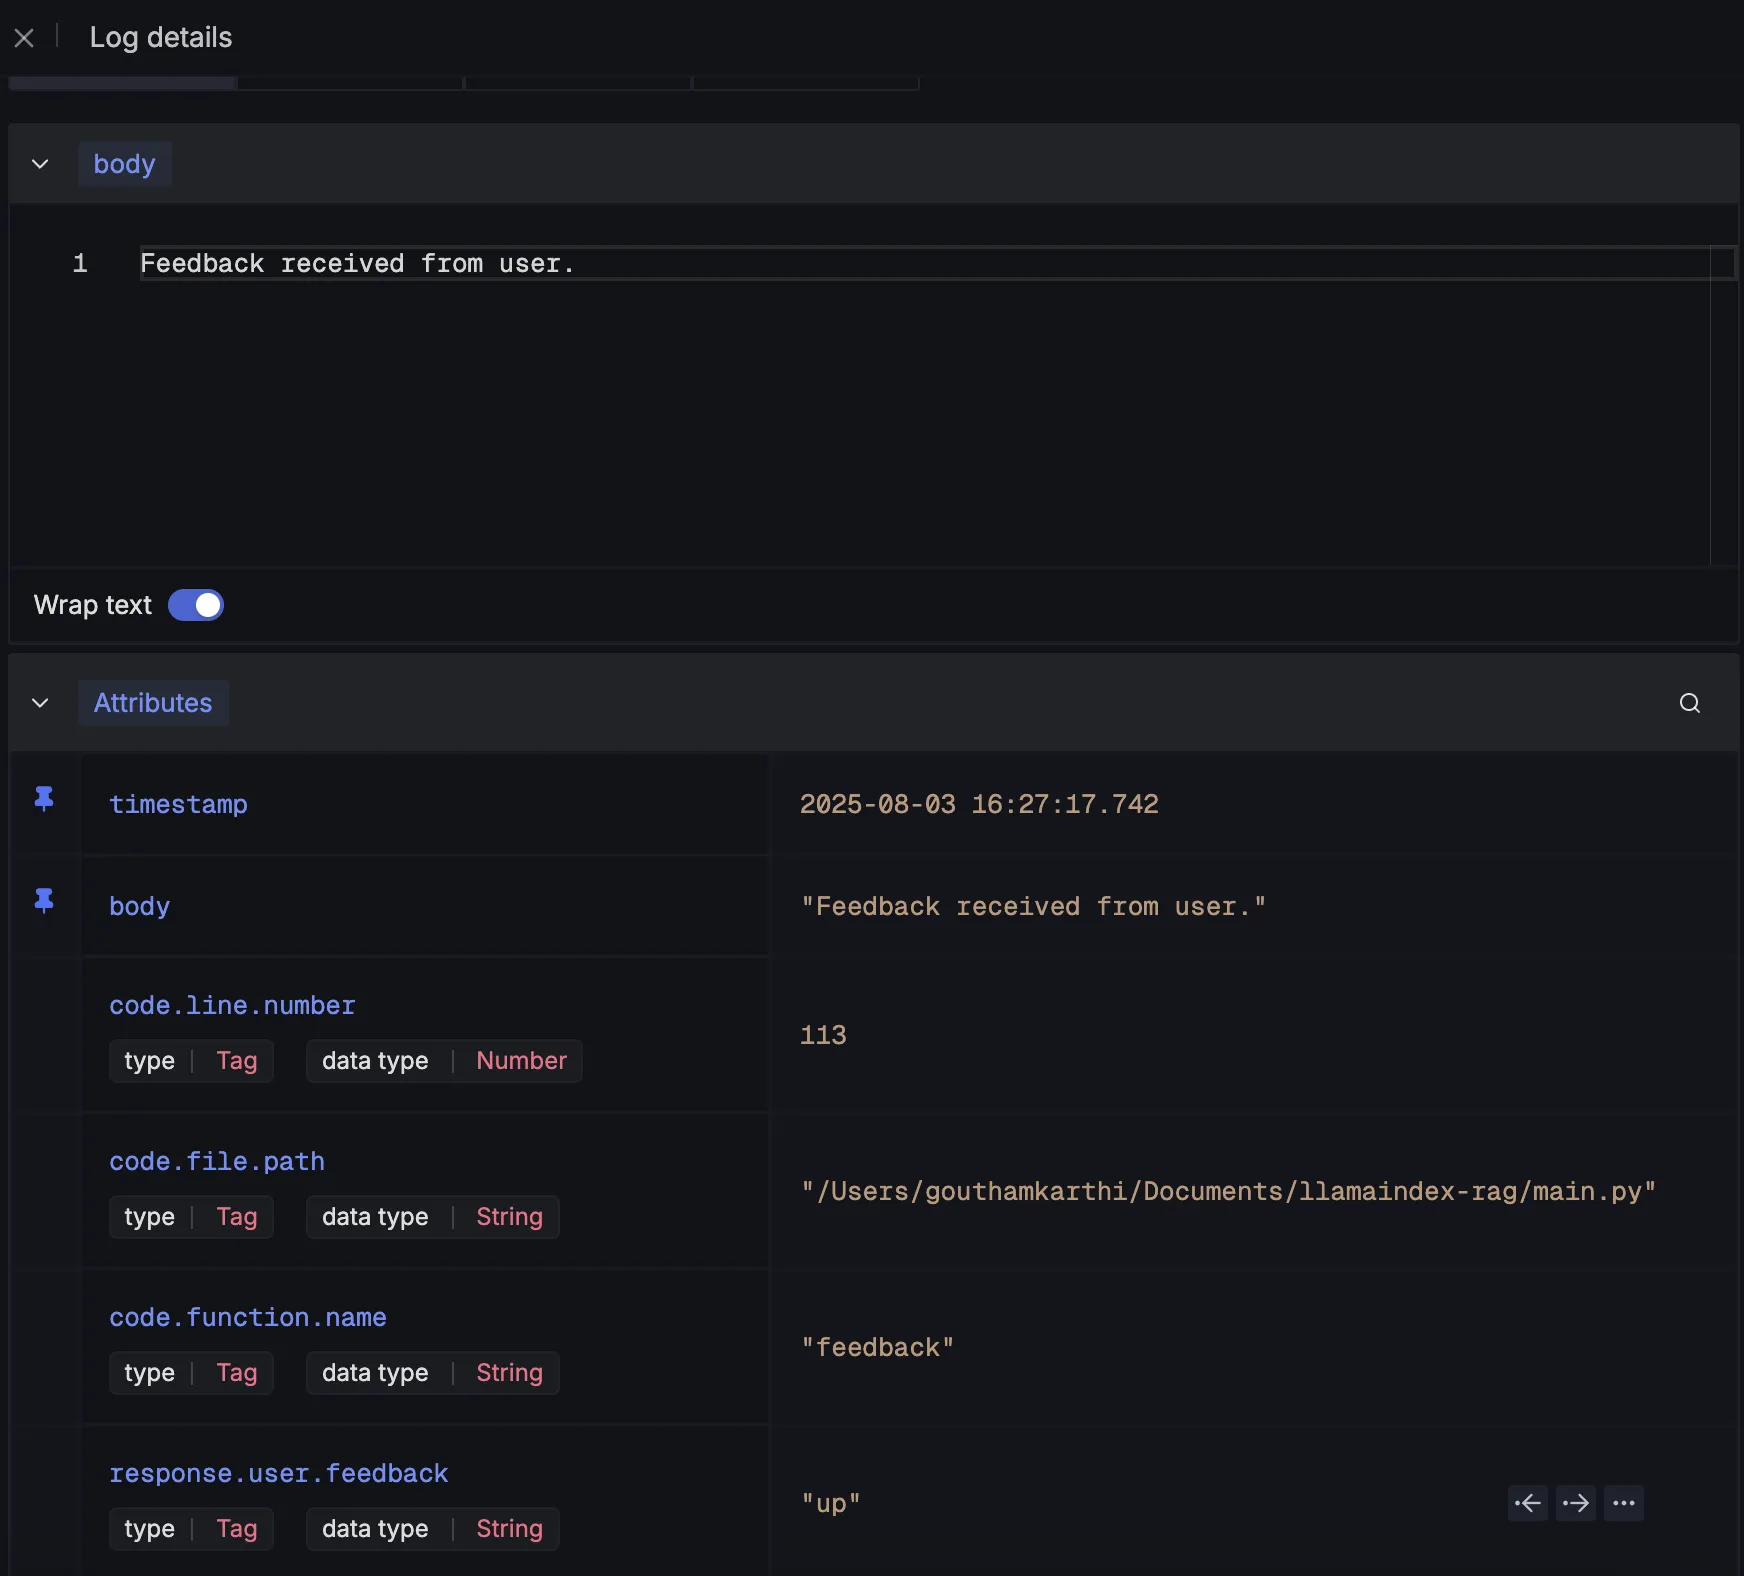
Finally, we log user feedback on chatbot responses to track how well the system is performing from the end-user’s perspective:
logger.info(
  "Feedback received from user.",
  extra={
      "response.user.feedback": user_feedback,
  }
)
And it would look like this:
Making Sense of Your Telemetry Data
Once telemetry is enabled in our LlamaIndex RAG app, we start seeing detailed traces for each major step in the workflow. You can see examples of three types of traces our LlamaIndex app emits:
SentenceSplitter.call
Shows how long it took to split ingested documents into individual sentences or chunks before embedding. This is useful for spotting preprocessing bottlenecks, especially with large documentation sets.
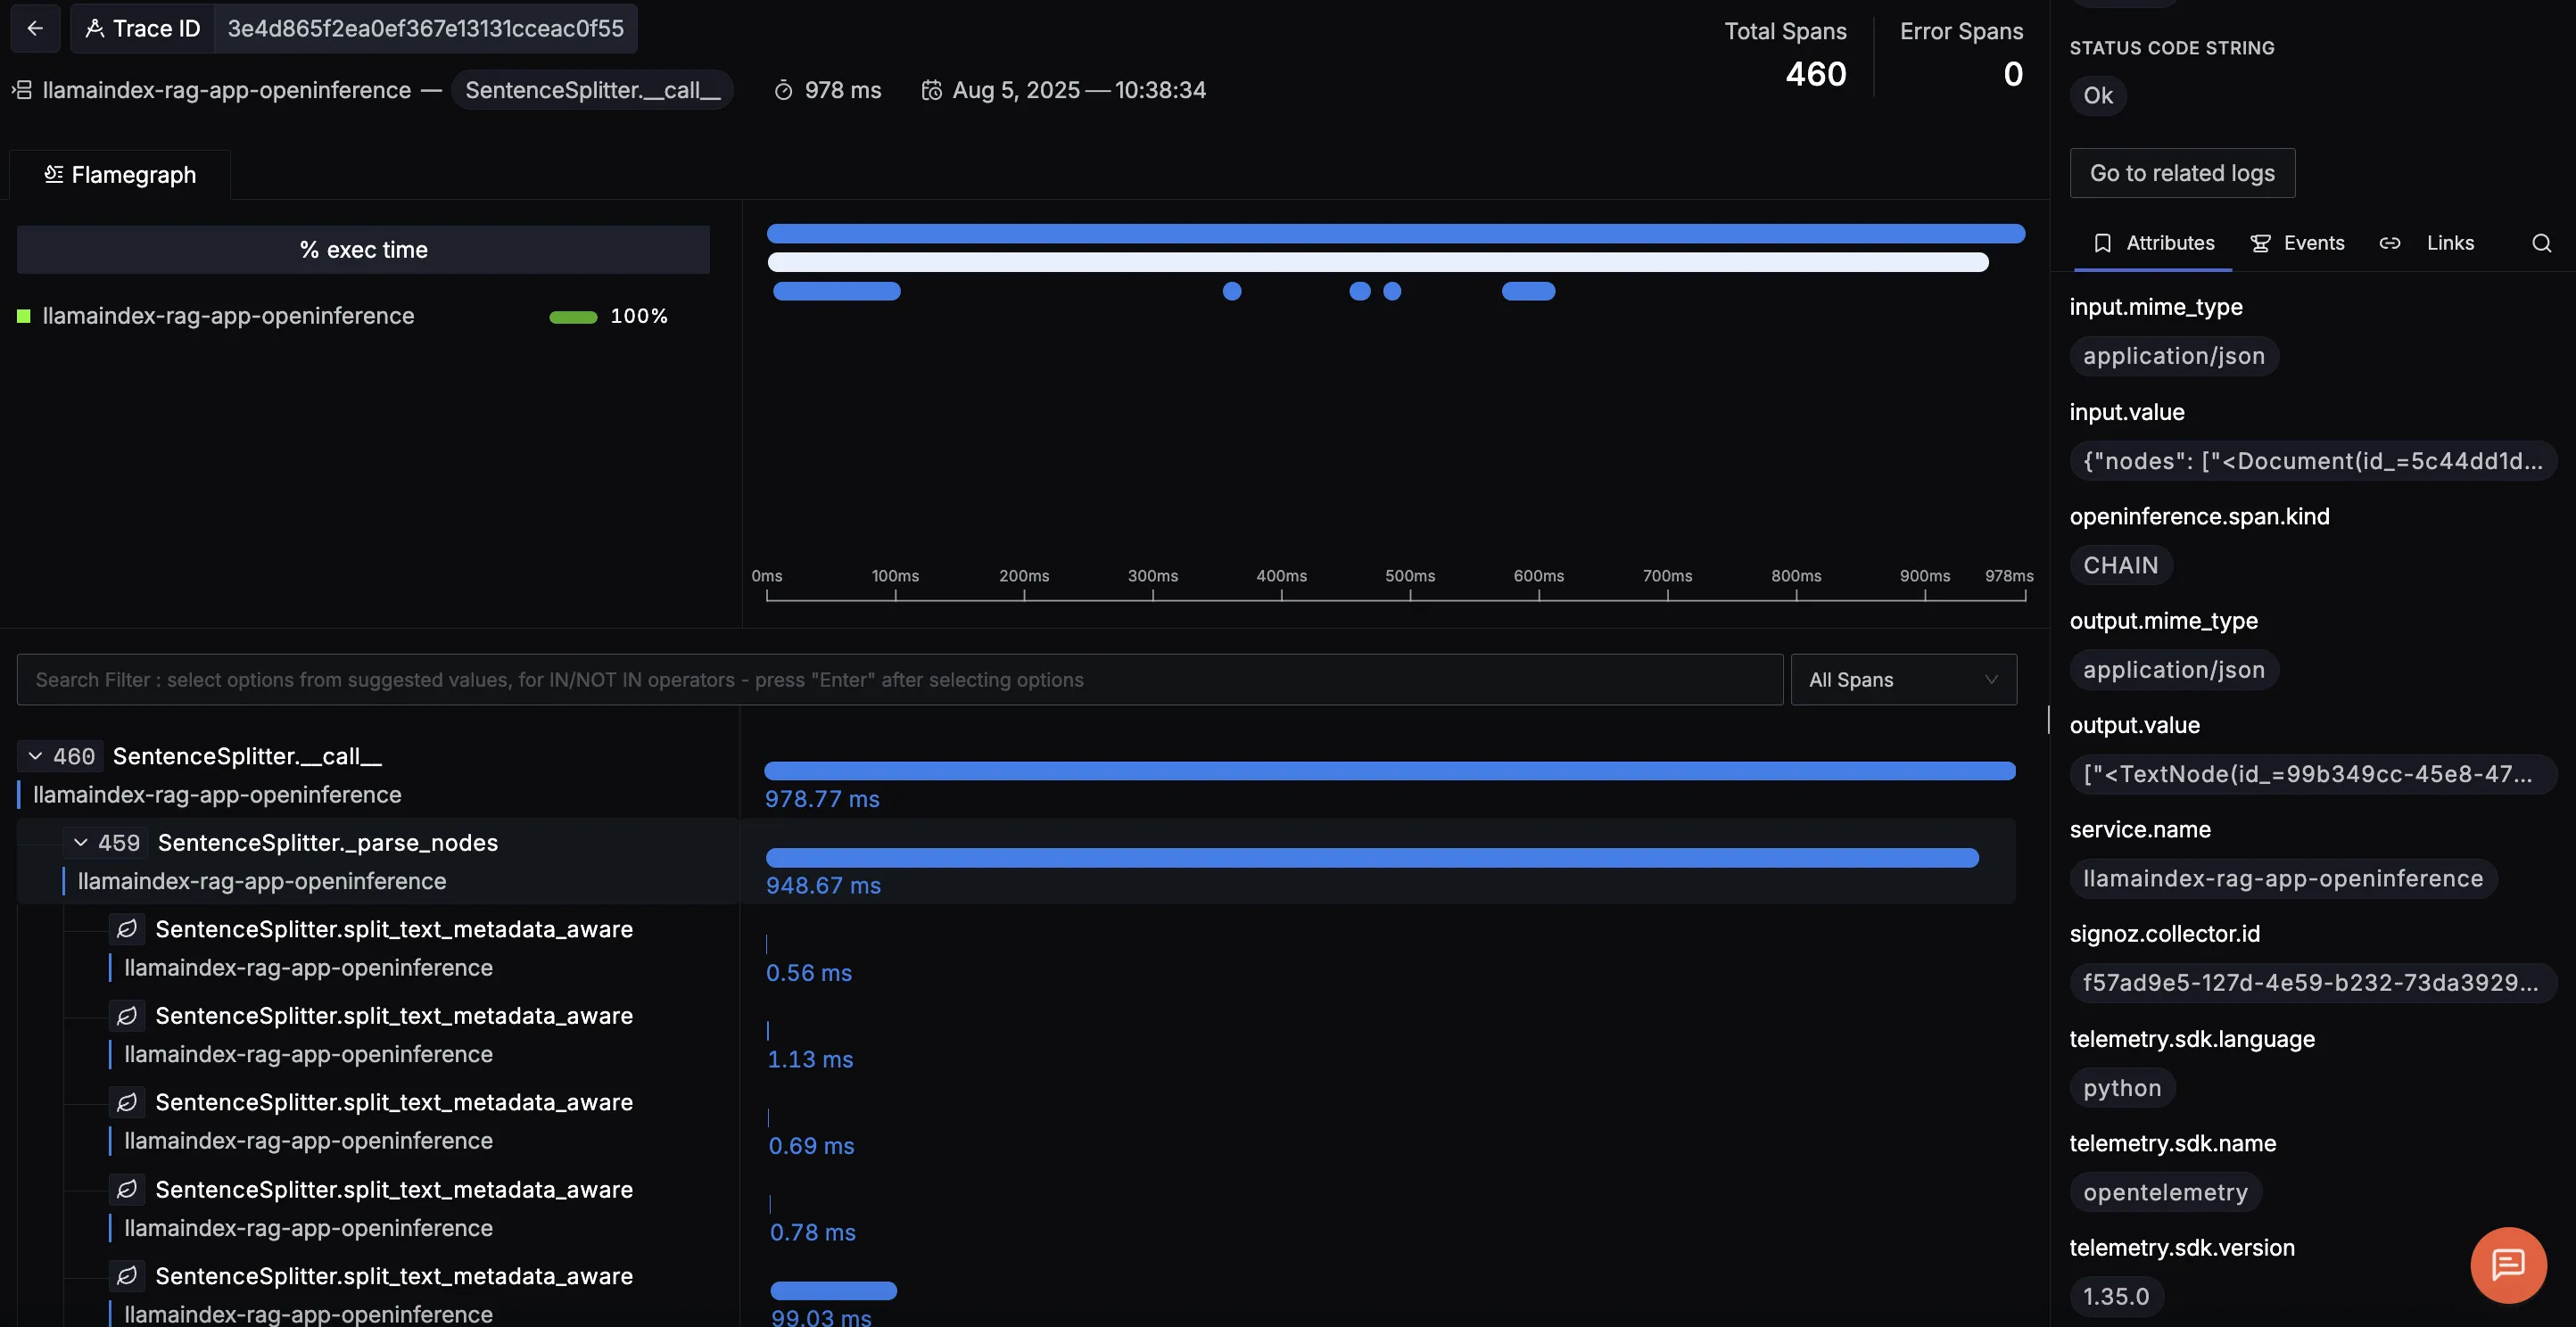
The trace view shows the SentenceSplitter.__call__ operation handling document chunking, with each split_text_metadata_aware span efficiently splitting a document while preserving metadata which is key for accurate retrieval in RAG apps. The right panel displays the input and output texts, confirming fast and effective chunking.
OpenAIEmbedding.get_text_embedding_batch
Captures the duration of embedding operations when converting text chunks into vector representations. Long times here could point to slow API responses or oversized batch processing.
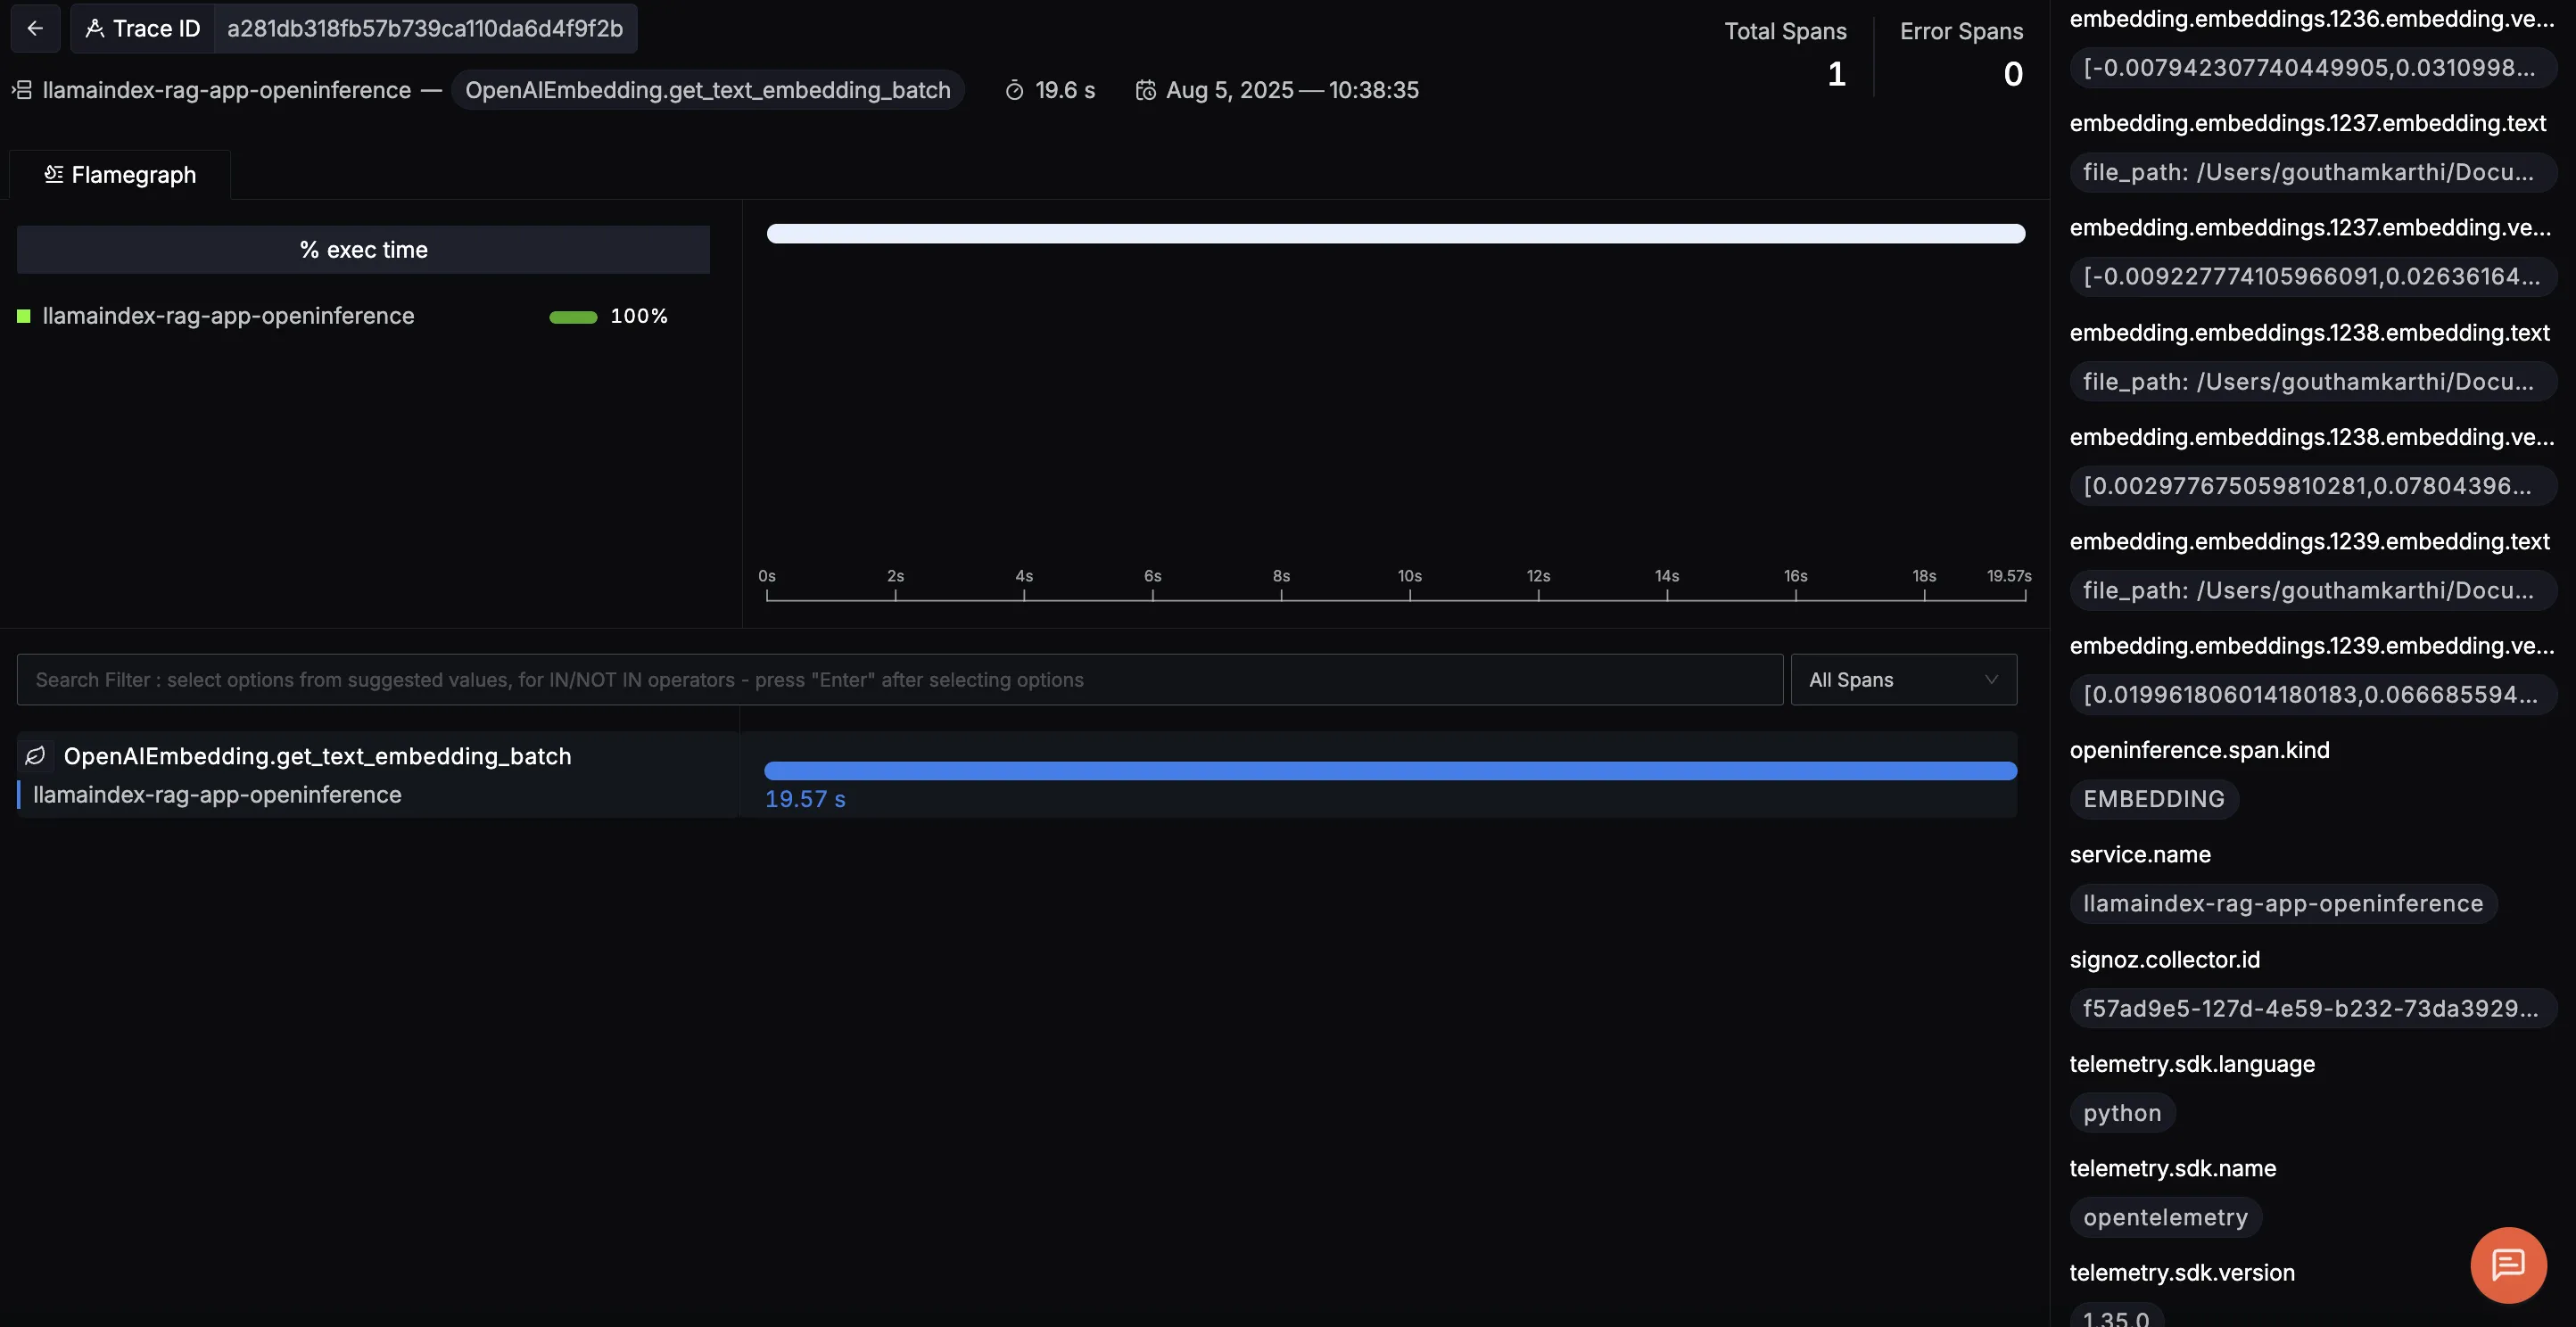
This trace highlights the OpenAIEmbedding.get_text_embedding_batch operation, which handles embedding chunks of text in a single batch via the OpenAI API. On the right, you can easily explore each input chunk and its resulting vector, giving a clear view into how text is transformed for semantic search.
RetrieverQueryEngine.query
Represents the retrieval phase, where the app queries the vector store to find the top‑k relevant documents. Tracking this helps identify if slow lookups are hurting your RAG latency.
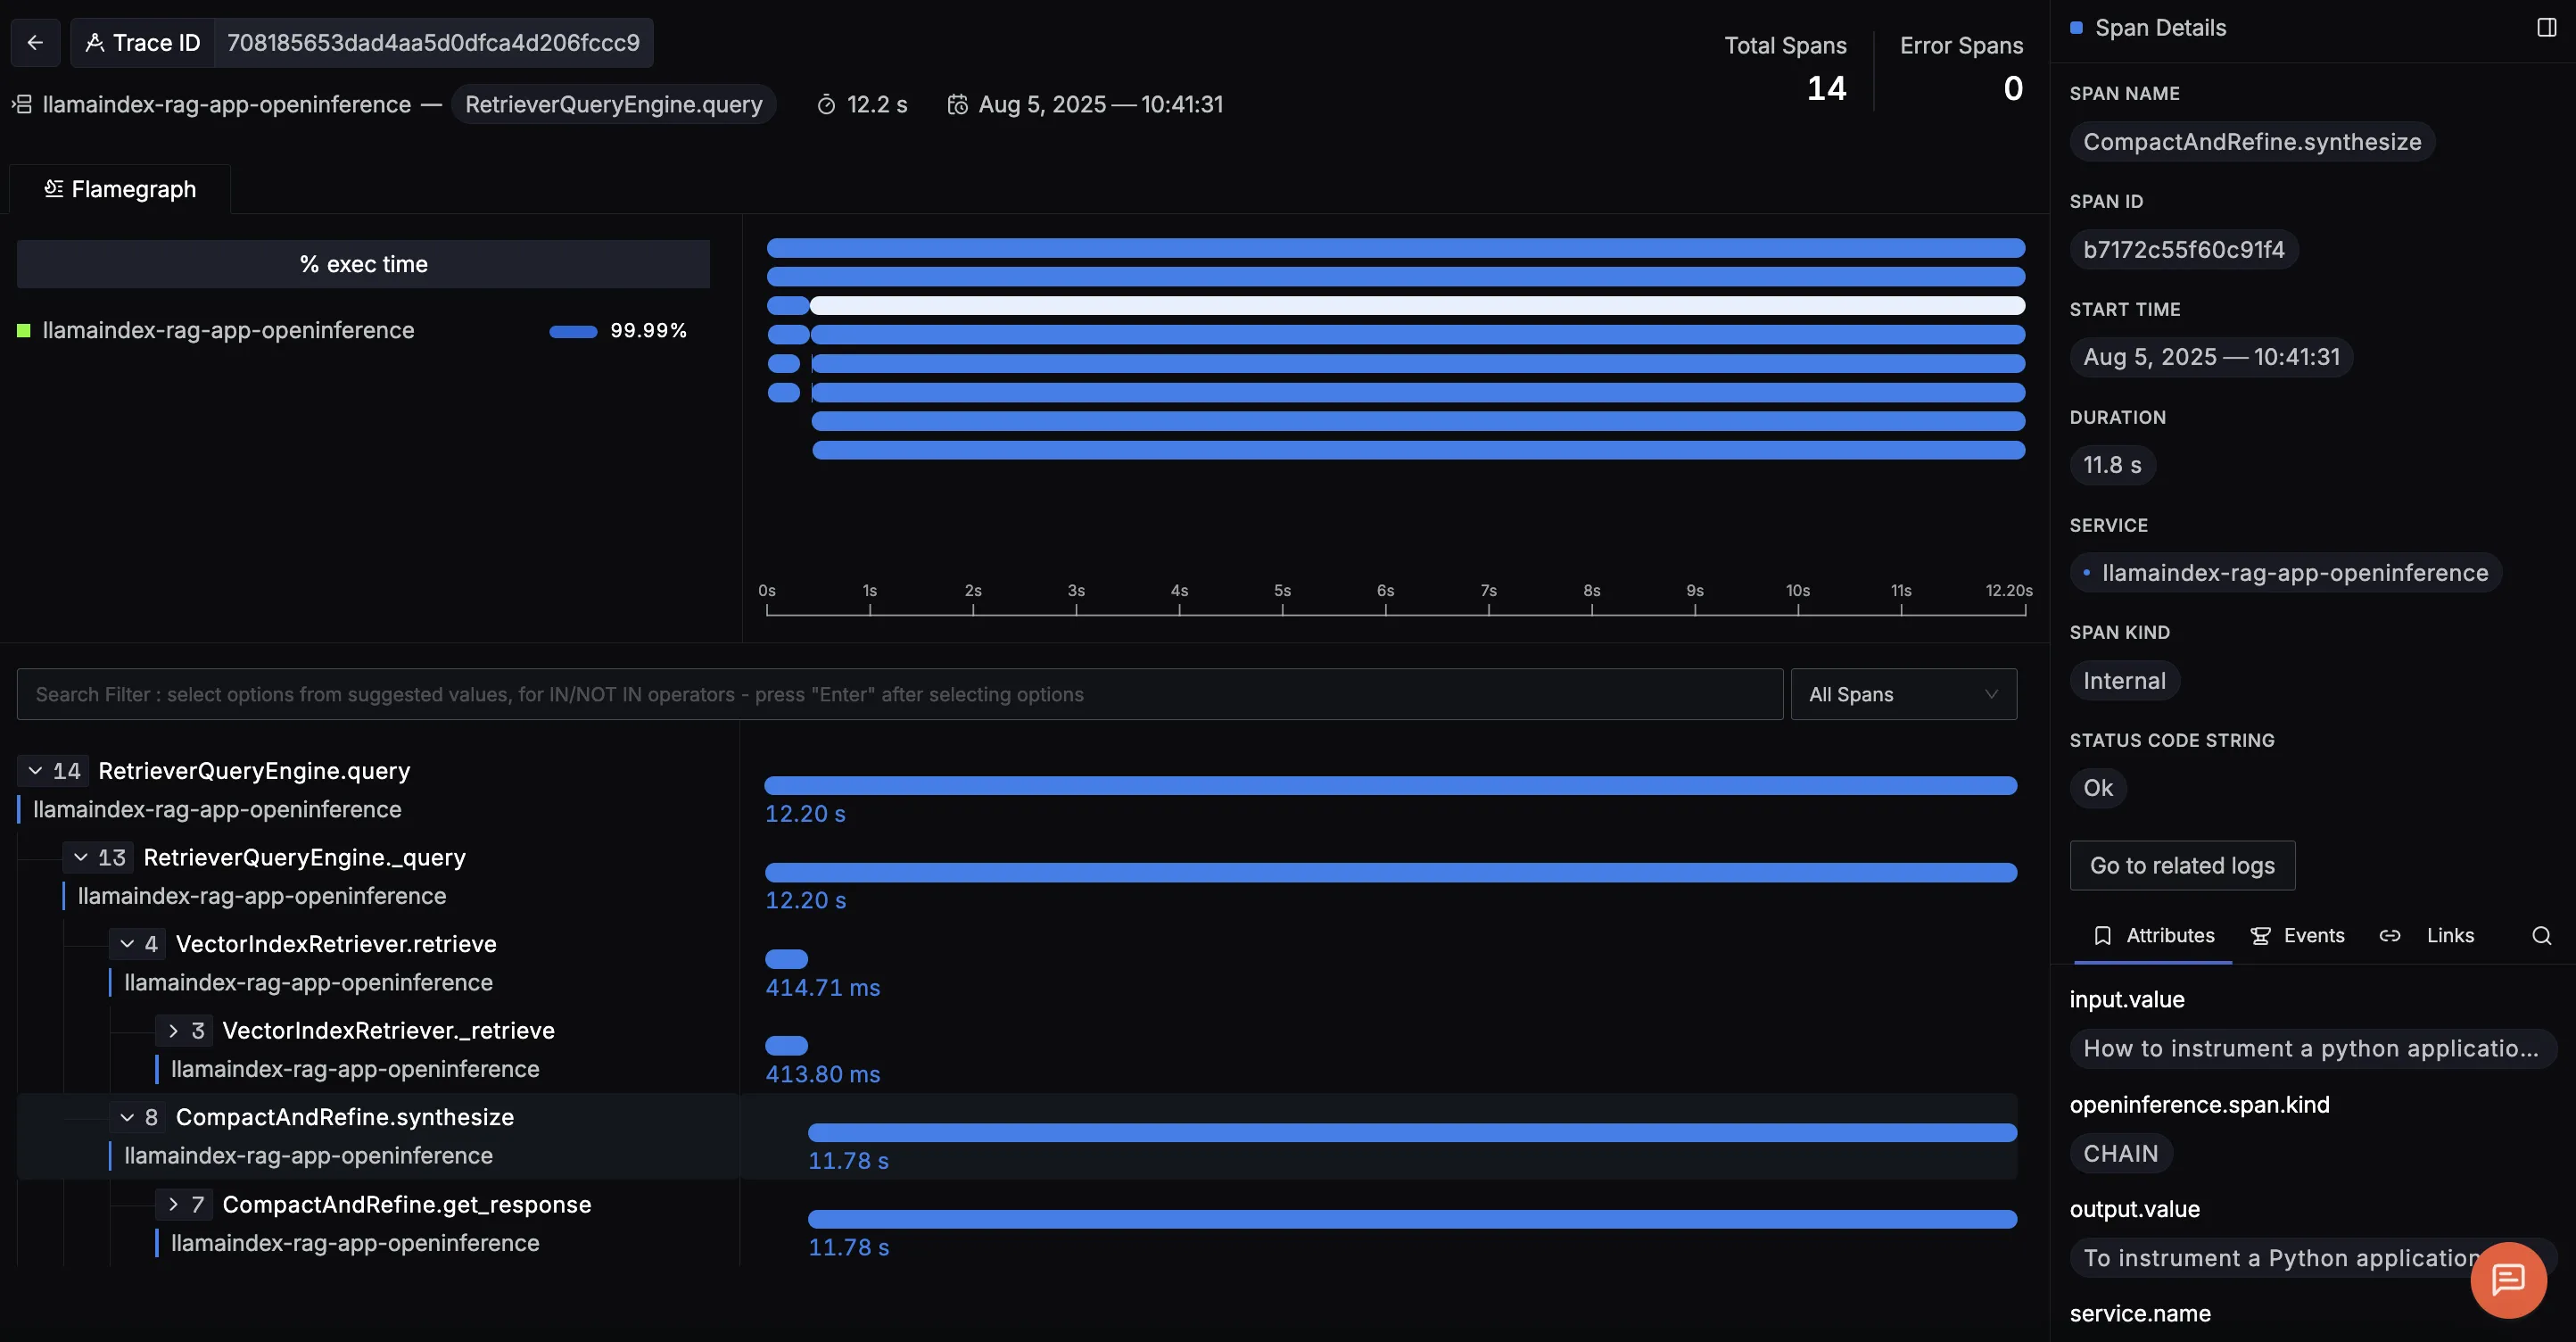
This trace shows the full RetrieverQueryEngine.query flow, covering both document retrieval and answer generation in a RAG pipeline. It reveals how relevant documents are retrieved and scored, then how the LLM uses that context to generate a final answer which is complete with prompts, token counts, and outputs, making it easy to debug and optimize results.
With this data, you can answer critical performance questions about your RAG pipeline:
- Where is the time going? Is most of the latency in preprocessing, embedding, or retrieval?
- Are embeddings a bottleneck? Long embedding durations could mean you need to optimize batch sizes or parallelism.
- Is retrieval efficient? High retrieval durations might require a different vector store configuration or indexing strategy.
Instead of guessing where delays or issues occur, SigNoz gives you a connected, end‑to‑end view of each request turning your RAG workflow from a black box into a fully observable system.
Visualizing Data in SigNoz with Dashboards
Once your LlamaIndex RAG app is instrumented with OpenTelemetry, SigNoz gives you rich dashboards to explore the emitted telemetry data. Built‑in filters and span attributes make it easy to drill down into specific queries, trace retrieval latency, or analyze LLM performance. You can also create custom dashboards and alerts to track RAG‑specific metrics like chunk processing times, retrieval similarity scores, token usage, and user feedback trends giving you a real‑time pulse on how your application is performing end‑to‑end.
Here are some of the most insightful panels we built using the traces from our instrumented RAG workflow:
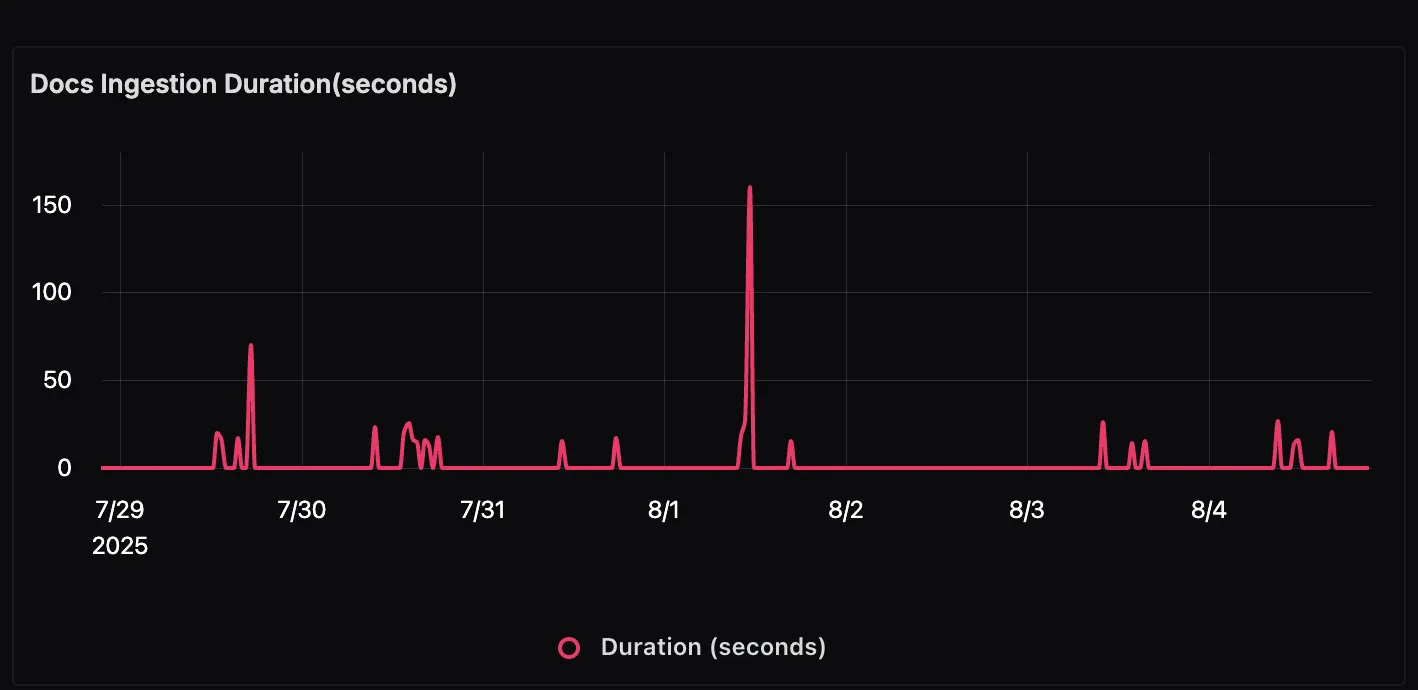
Docs Ingestion Duration This panel shows how long it takes to process and ingest documents into the system. Spikes in this graph may indicate larger document batches being processed or slower preprocessing steps such as chunking and embedding.
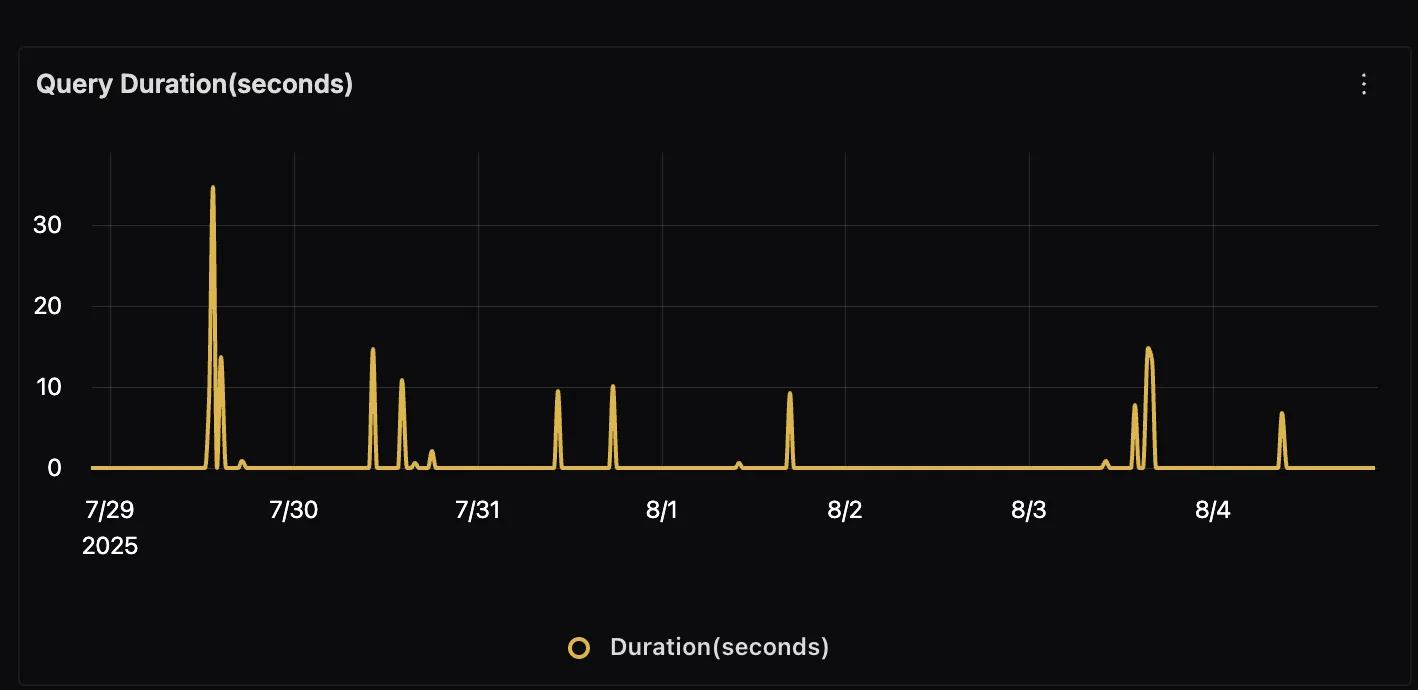
Query Duration
This panel displays the total time taken to answer user queries. Monitoring this metric helps you quickly identify latency issues in either the retrieval process or LLM generation.
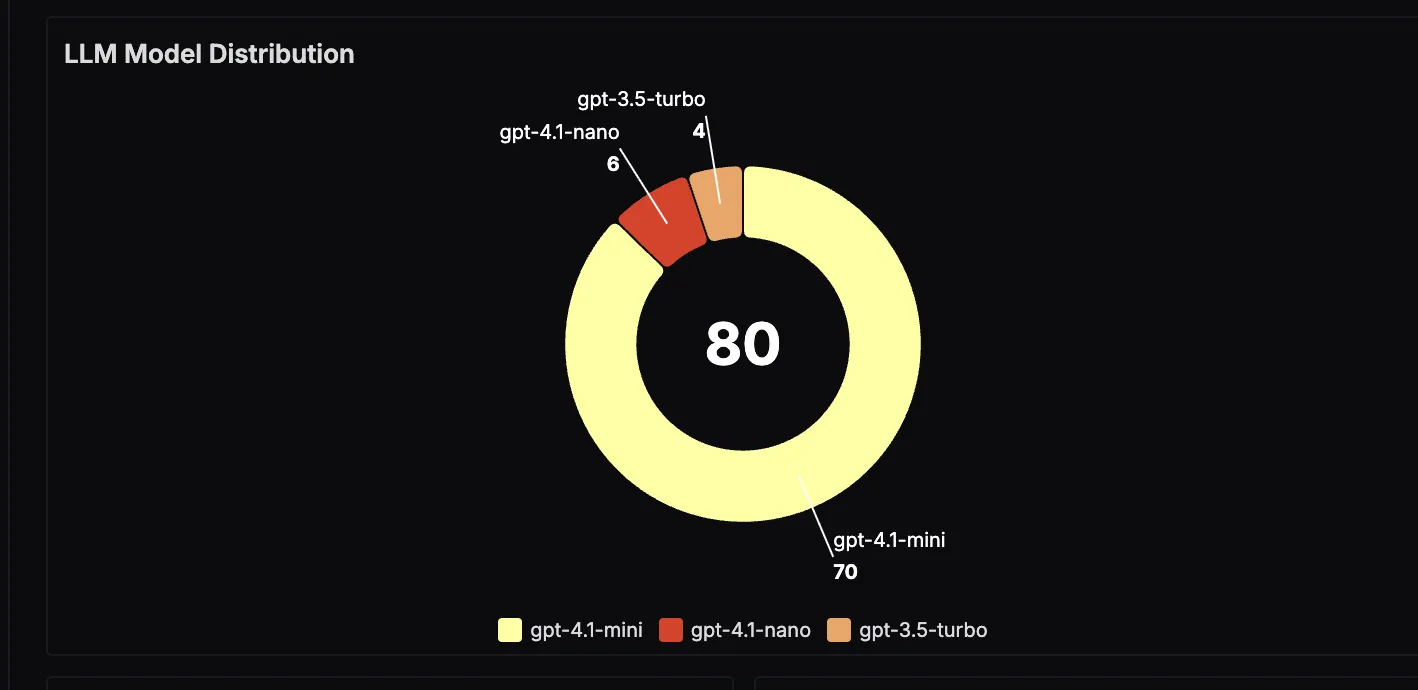
LLM Model Distribution
This panel visualizes which large language models are being used most often in the application. This is useful for understanding usage patterns and evaluating the trade‑offs between cost and performance for different models.
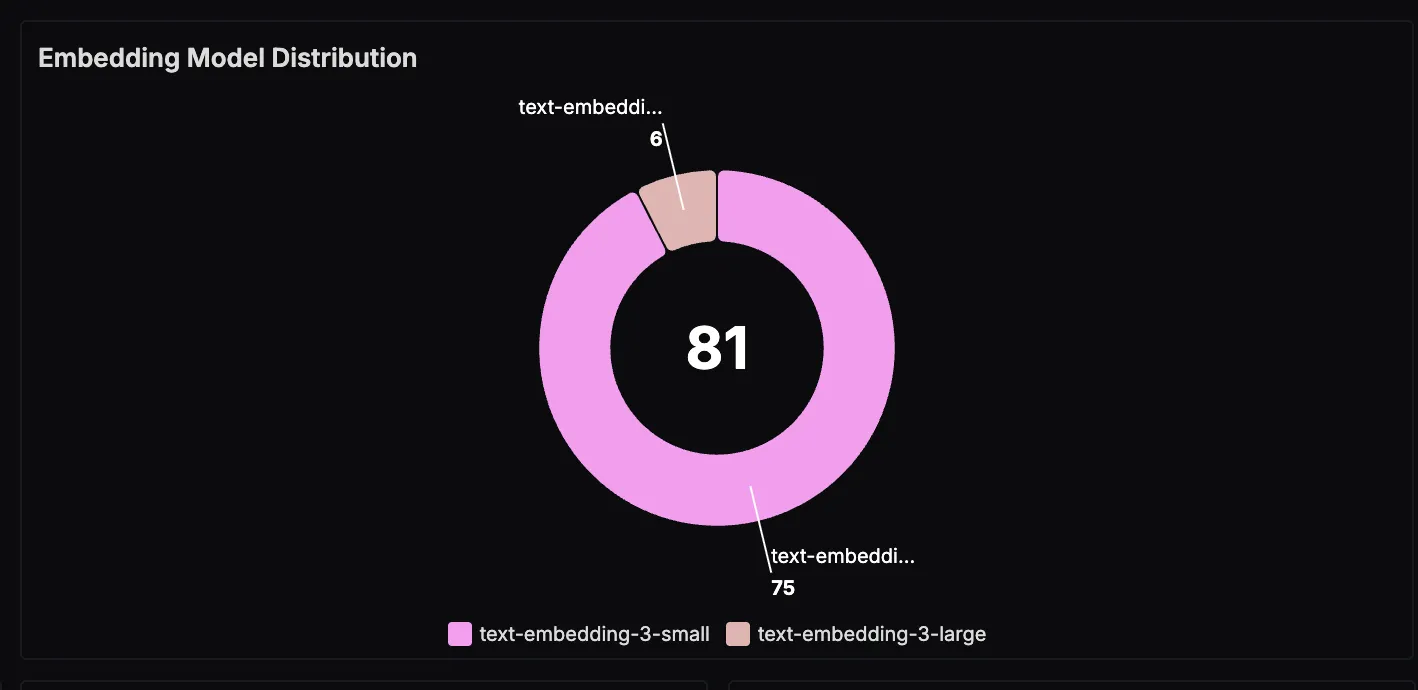
Embedding Model Distribution
This panel breaks down the embedding models used during vector generation. Tracking this over time can help monitor adoption of newer models or assess how different embedding choices impact retrieval quality.
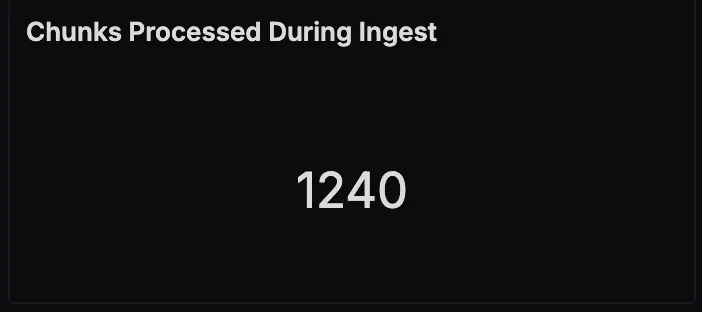
Chunks Processed During Ingest
This panel counts the total number of text chunks created during document ingestion. A sudden increase here could indicate larger ingests or a change in your chunking strategy.
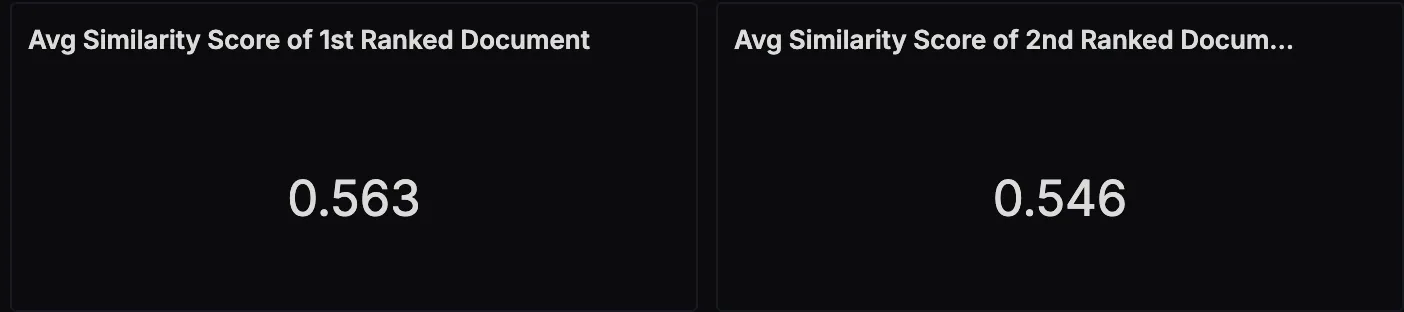
Average Similarity Scores for Top‑Ranked Documents
This panel shows the relevance of retrieved documents to the user’s query, based on vector similarity scores. By tracking the top‑1 and top‑2 scores over time, you can spot changes in retrieval accuracy and tune your pipeline accordingly.
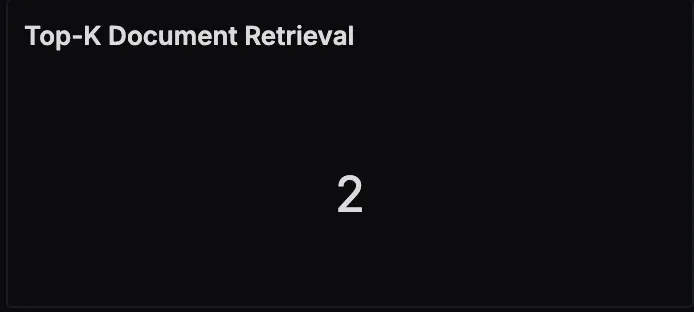
Top‑K Document Retrieval
This panel indicates the configured number of documents fetched for each query. Adjusting this number can have a direct impact on both retrieval quality and overall query latency.
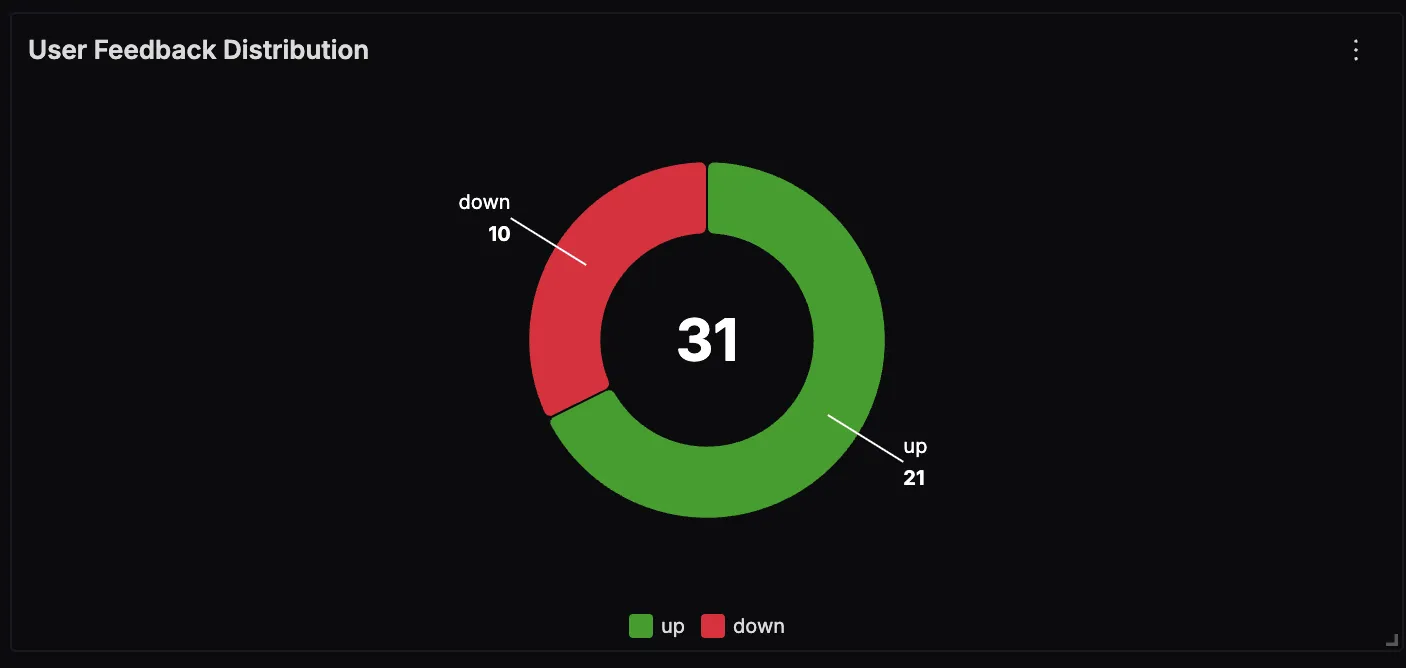
User Feedback Distribution
This panel shows how users are rating the chatbot’s responses, broken down into positive (“up”) and negative (“down”) feedback. Monitoring this helps identify trends in answer quality and provides a direct signal for improving retrieval or generation steps.
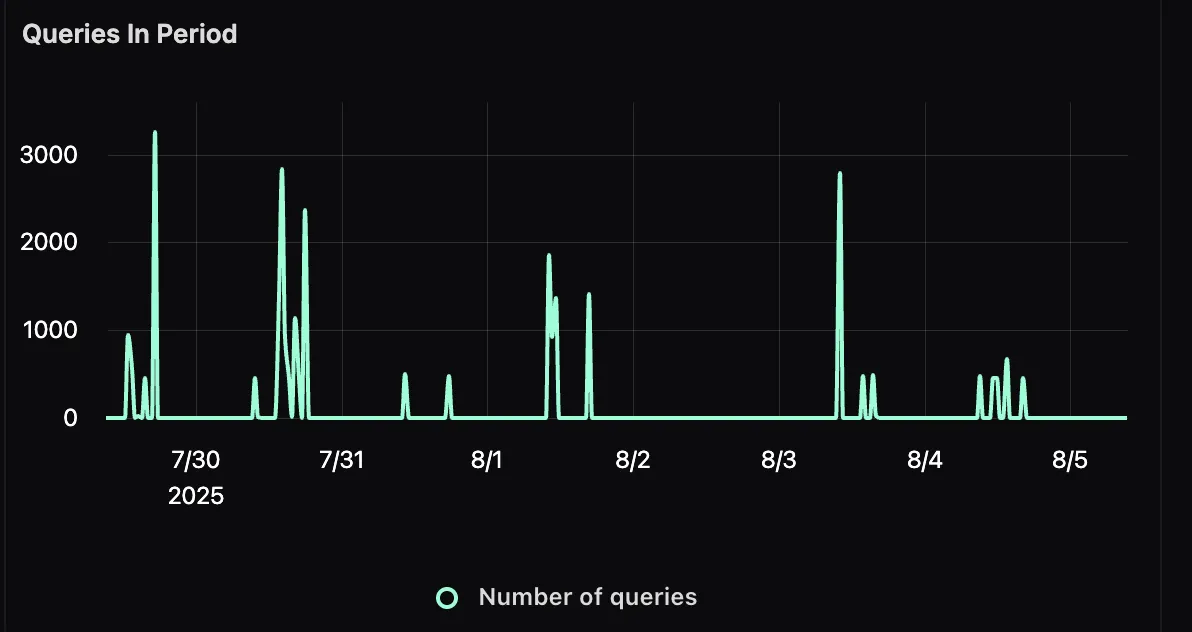
Queries in Period
This panel tracks the total number of user queries over a given time frame. This gives you visibility into traffic patterns, peak usage times, and how query volume might correlate with performance changes.
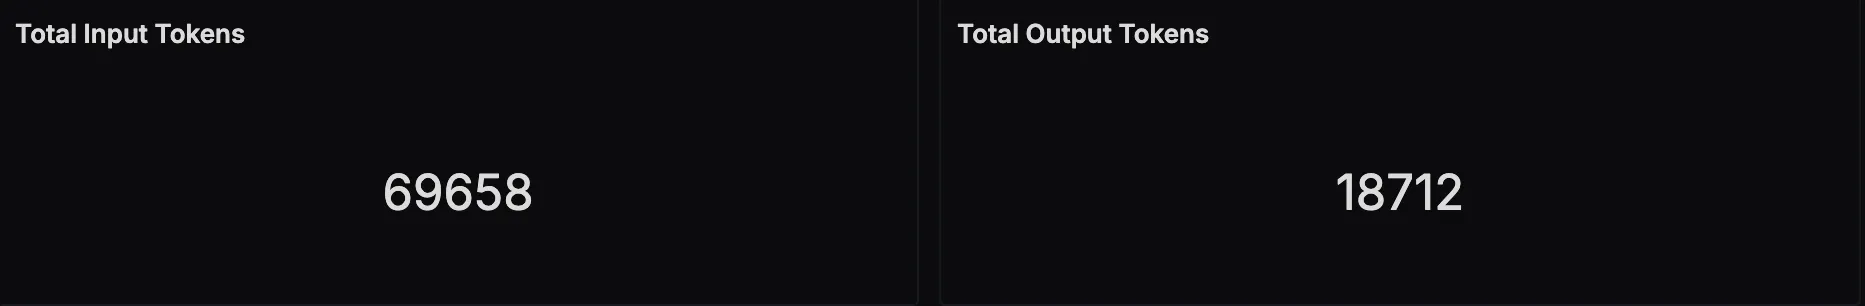
Total Token Usage
This panel displays the number of input and output tokens processed by the LLM. Input tokens represent the size of the prompt (including retrieved context), while output tokens reflect the length of the generated response. Tracking both helps with cost estimation, model performance analysis, and prompt optimization.
Wrapping it Up
Building LlamaIndex‑based RAG applications is exciting. There’s something magical about watching your AI instantly pull the right answers from your own data. But that magic only lasts if the app stays fast, reliable, and accurate. To make that happen, you need a clear view of what’s going on under the hood.
By pairing OpenTelemetry’s vendor‑neutral instrumentation with SigNoz’s powerful observability platform, you can follow every step of your RAG workflow—chunking, embedding, retrieval, generation—and even capture user feedback to drive improvements. With this visibility, debugging becomes faster, performance tuning becomes data‑driven, and your users get consistently great experiences.
In AI‑powered apps, guesswork is the enemy. Observability is how you replace it with clarity, and that’s how you build RAG systems you can trust. In the race to build smarter AI, the real edge isn’t just better models—it’s better observability.
If you want the docs version of this guide, see the LlamaIndex observability docs and the LLM observability overview.
