OpenTelemetry Metrics: A Complete Practical Guide
Picture this, your observability tool already nails the basics like request rates, latency and memory usage, but you need more insight. Think user churn rates, engagement spikes, or even how many carts get abandoned mid-checkout. That’s where OpenTelemetry (OTel) steps in, providing a way to track those critical custom metrics with ease.
OpenTelemetry metrics are numerical measurements captured over time that help you understand service health, performance, and behavior. They give you a standard way to generate, process, and export custom metrics across different languages and backends.
The OpenTelemetry Metrics specification has emerged as a benchmark for collection and management of metric data. This blog is primarily about different measurement instruments and some really cool and fun ways of collecting custom metrics from your application. By showcasing these examples, we hope to inspire you with ideas you can adopt for your own monitoring needs.
So let’s jump right into it!
OpenTelemetry [OTel] Metrics - An Overview
Before we understand OTel metrics, let’s wrap our head around metrics, in general.
A metric is a measurement of a service captured at runtime which tells us about the state of the system. Additionally, these metrics can later be used by APM tools for configuring alerts or creating dashboards for easy monitoring. We will be closely examining some cool custom metric examples later in this blog.
The best way to understand OTel metrics is to think of it as a ‘fitness tracker’. A fitness tracker monitors various health metrics such as steps taken, heart rate, and calories burned throughout the day. Similarly, the OpenTelemetry metrics system functions as the ‘fitness tracker’ for your application, continuously collecting data on application and system health like request rates, error counts, and response times.
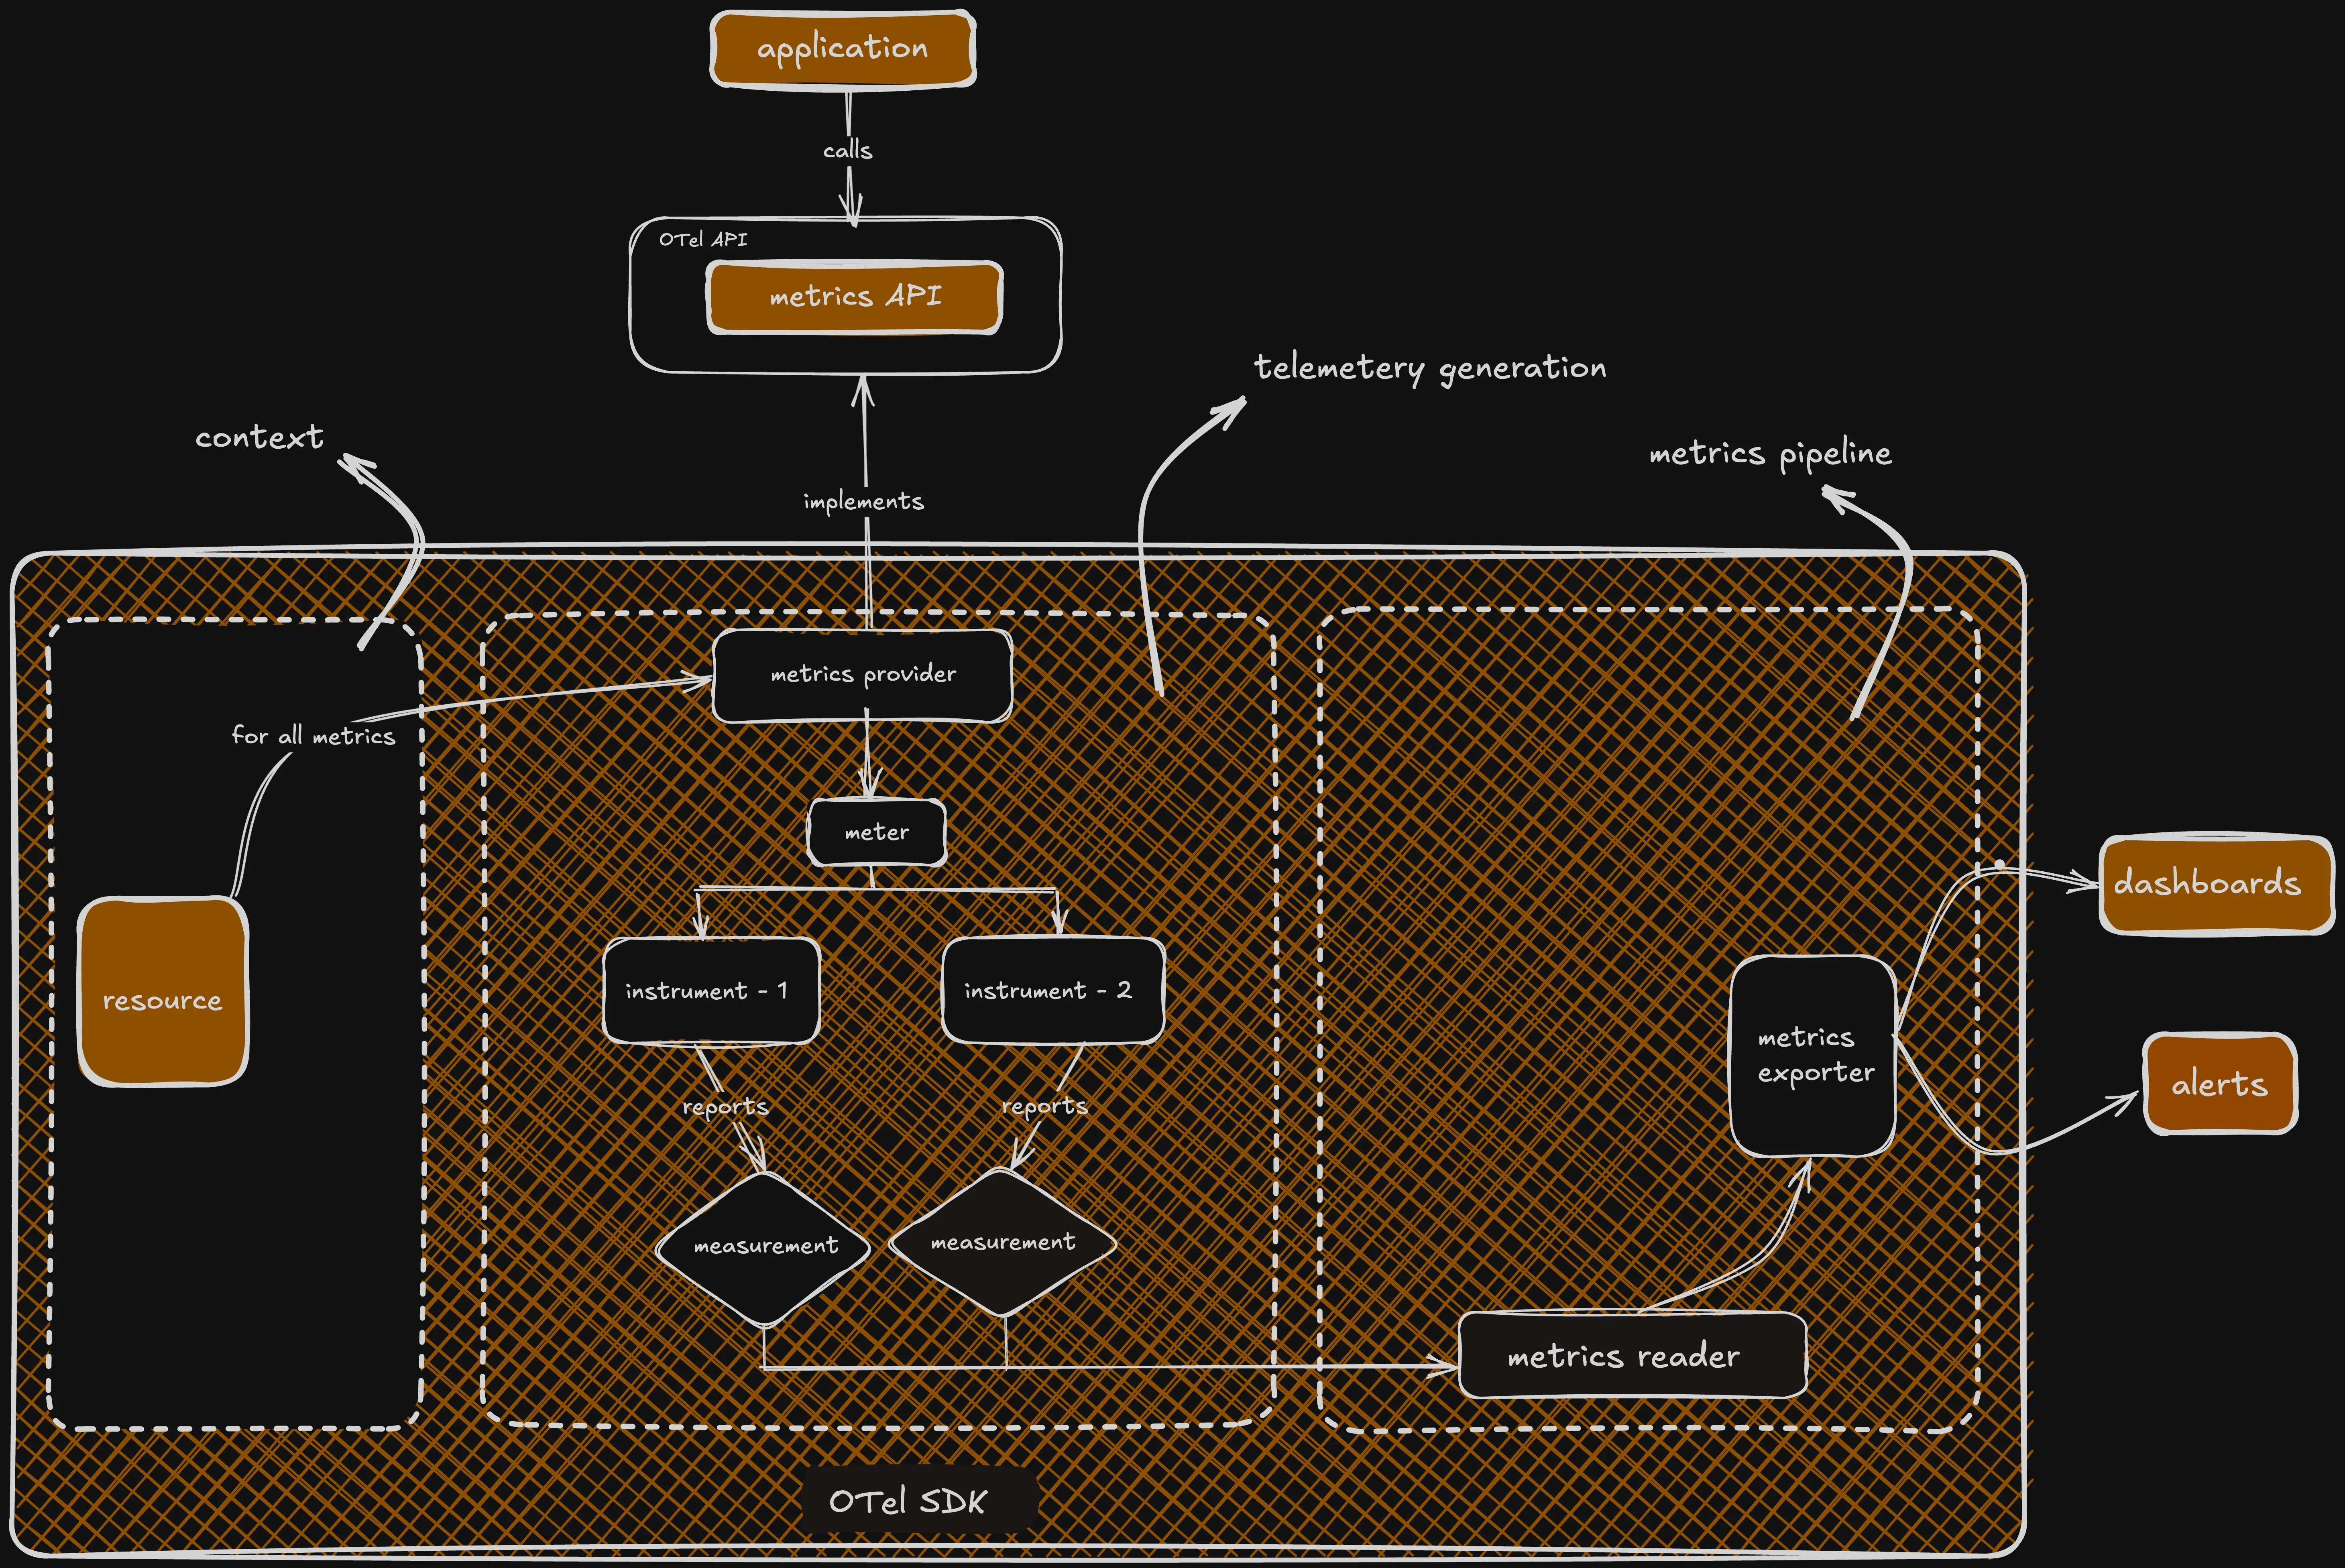
OTel metrics - programming model
The OpenTelemetry Metrics specification is completely open-source and vendor-neutral. Think of it like a free universal remote that works with any TV you’ve got, not just one brand, and you don’t have to pay a dime! It fully integrates with popular monitoring tools including Prometheus and StatsD through a standardized collector and exporter system.
As shown in the figure above, it splits the two main parts, SDK and API, so different SDKs can be configured at run time. This makes it super easy to tweak and control how your metrics are handled.
How is Metric Data Collected?
Under the hood, the data flow is fairly simple: a Meter creates instruments, your application records measurements, and the SDK aggregates them into metric streams using the OpenTelemetry Metrics Data Model.
Those streams can then be shaped further with views and exported over OTLP — the OpenTelemetry protocol for encoding, transporting, and delivering telemetry data between clients, collectors, and backends.
In many real-world setups, the OpenTelemetry Collector acts as the vendor-neutral middle layer, receiving telemetry in push-based pipelines, batching or transforming it, and forwarding it to a backend like SigNoz.
If you come from Prometheus, the mental model still fits because OpenTelemetry can work with both push and pull models, including pull-based collection through Prometheus receivers and exporters.
What are OpenTelemetry Instruments?
To generate metrics, OpenTelemetry provides a Meter, a core component of its API. This Meter lets you create different instruments, like counters or gauges, to capture measurements. Each measurement is a single data point that shows the value of a metric at a specific time, giving you a clear snapshot of what’s happening in your system.
How are OpenTelemetry Instruments Classified?
Instruments can be broadly classified into two distinct types based on when the metric is collected.
Synchronous Instruments
These integrate directly into your application's workflow, measuring events as they happen. For instance, they can track immediate data like HTTP request sizes or transaction counts as your code processes them.
Asynchronous Instruments
They work by collecting measurements only when needed (on demand) depending on the configuration of the metric collection system. To give an example, consider collecting the temperature from a sensor every 15 seconds for safety monitoring.
We will explore different instruments and their use cases in depth in the next section!
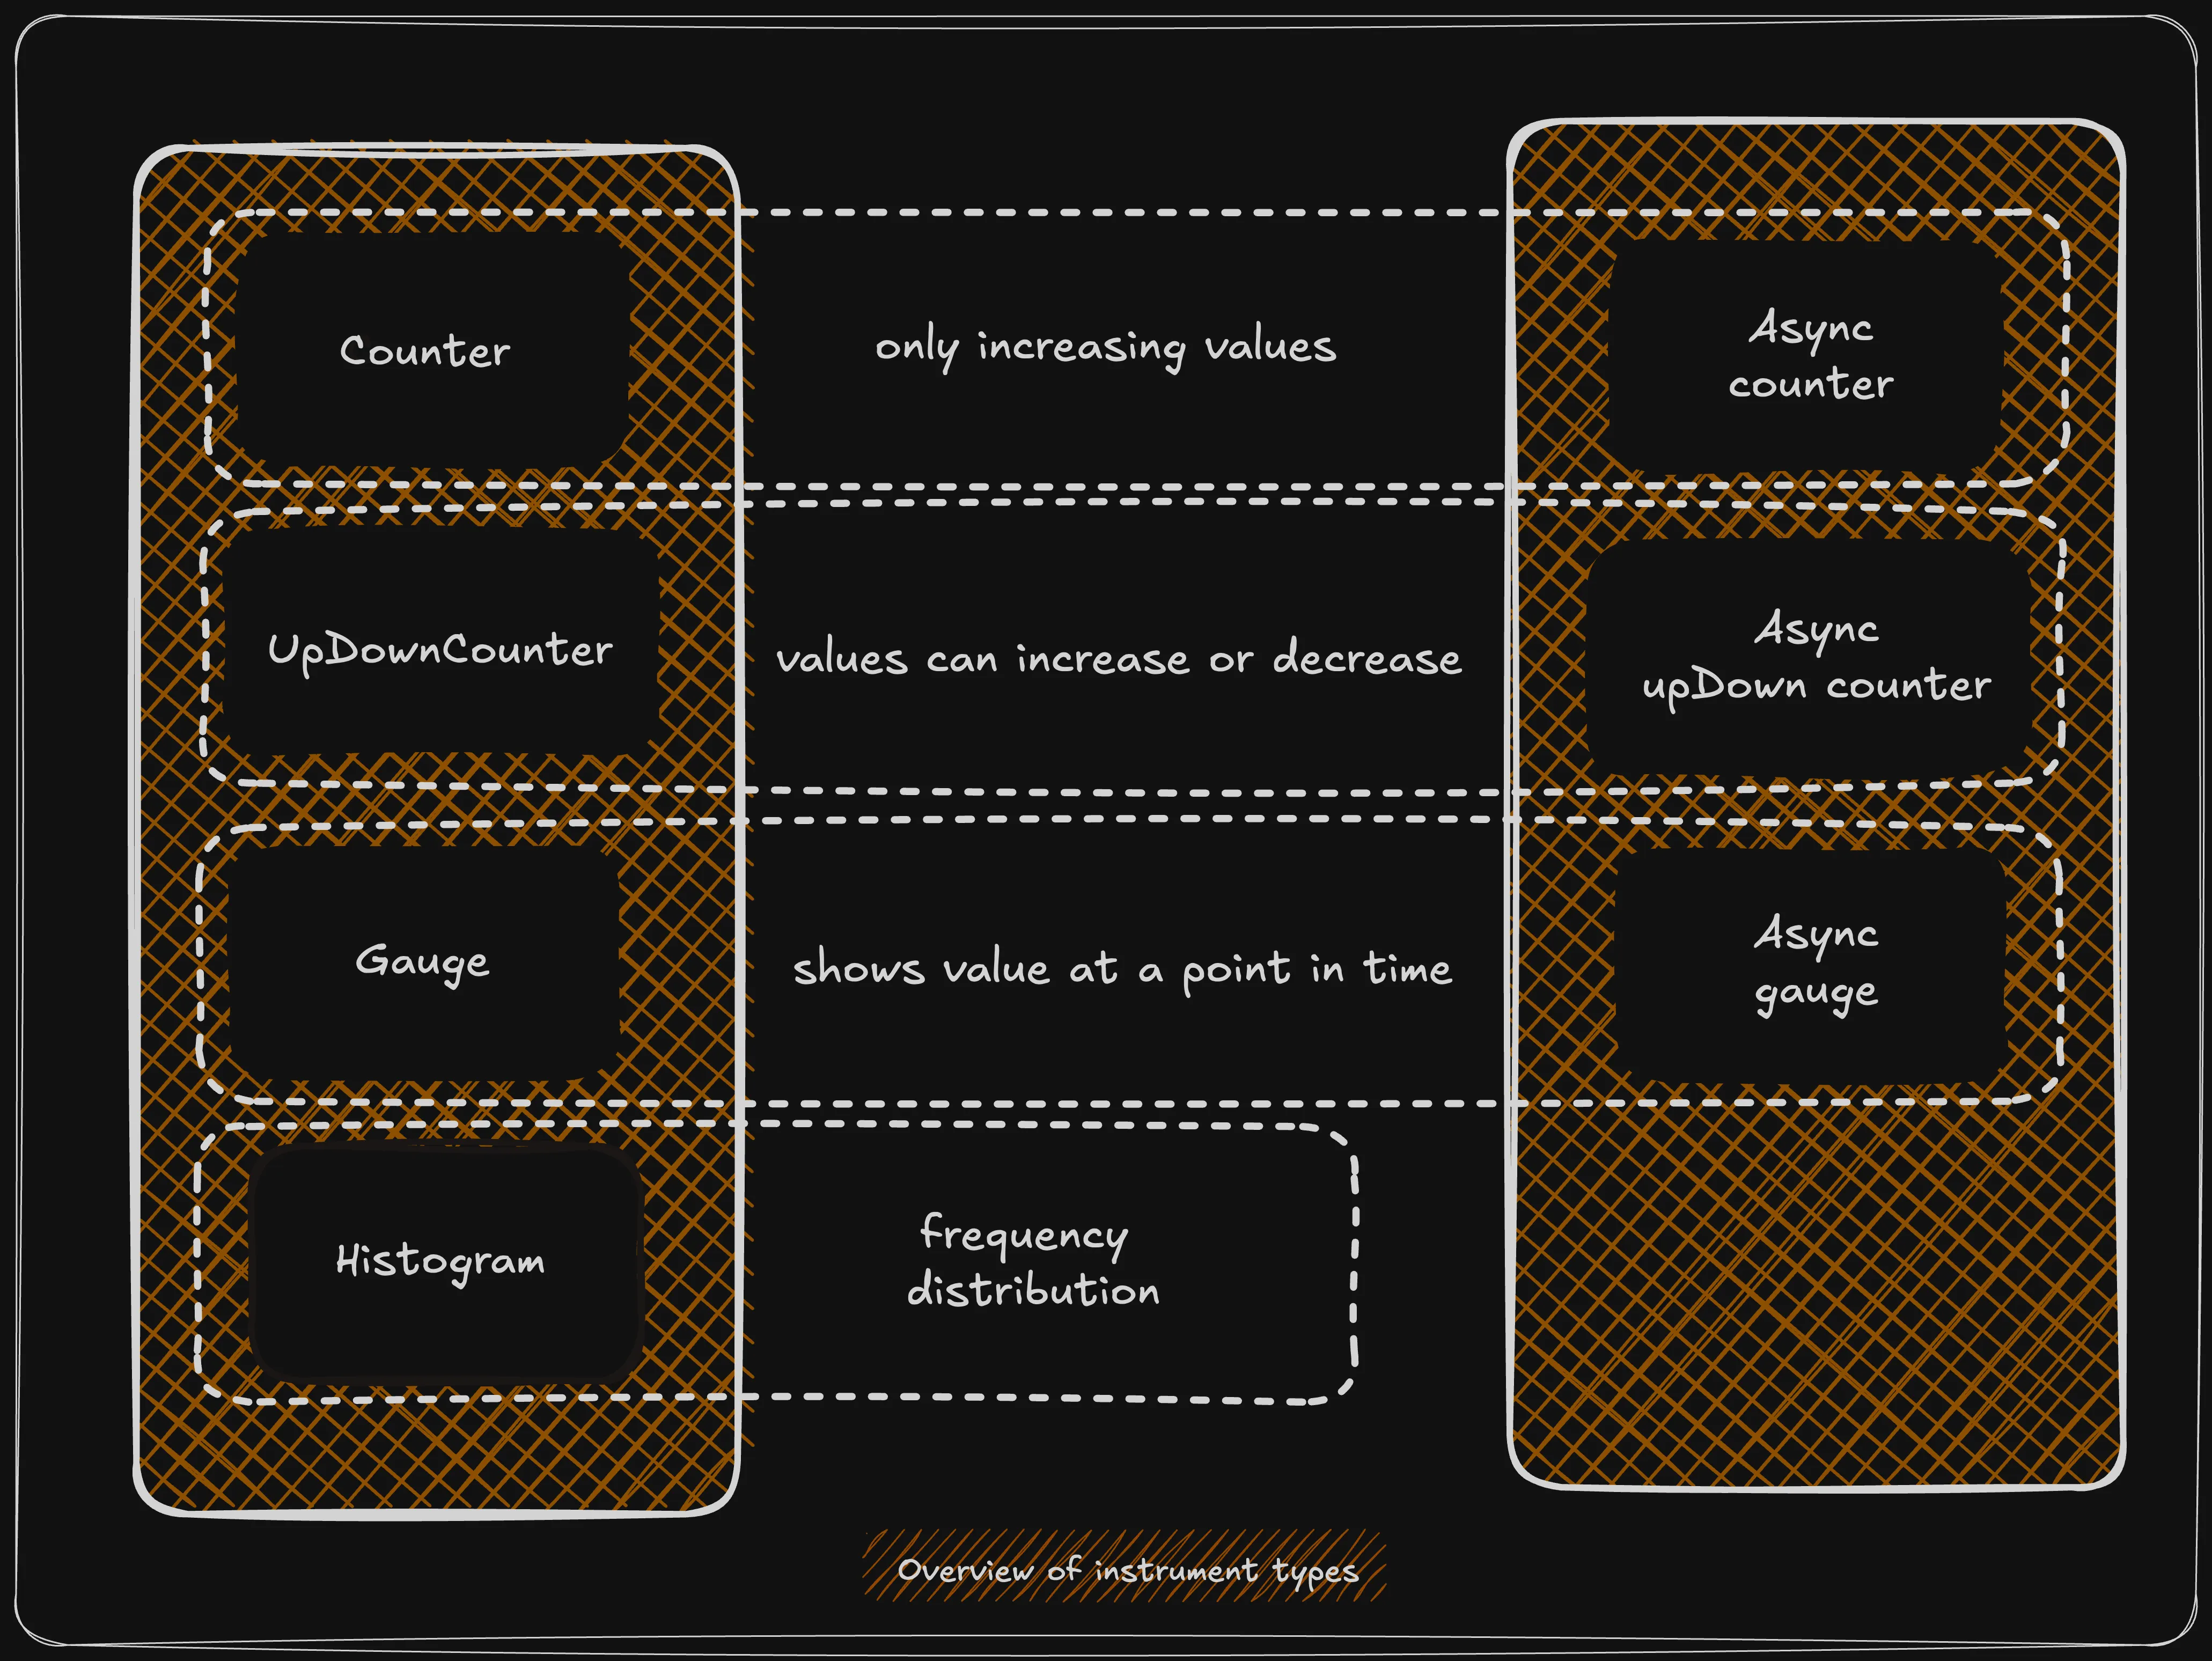
What are the Various Types of Metric Instruments?
Currently, the OpenTelemetry Metrics API supports seven different instruments. Let’s try to understand these instruments and their properties.
Although the examples in this post use Python, the underlying OpenTelemetry model stays consistent across other ecosystems as well. The same ideas around Meters, counters, gauges, histograms, and observable instruments carry over cleanly to languages such as .NET, Java, Go, and Rust. So if you have seen a .NET CreateObservableCounter or are instrumenting a Rust service with the OTel SDK, you are still working with the same core concepts, just expressed in language-specific APIs.
Counter
A synchronous instrument that measures values that only increase over time. OpenTelemetry counters provide an add method that accept a non-negative value, to be added to the current total.
Looking at the code implementation, we can see it logs a warning for negative values:
class Counter(_Synchronous, APICounter):
    def add(
        self, amount: Union[int, float], attributes: Dict[str, str] = None
    ):
        if amount < 0:
            _logger.warning(
                "Add amount must be non-negative on Counter %s.", self.name
            )
            return
        self._measurement_consumer.consume_measurement(
            Measurement(amount, self, attributes)
        )
Asynchronous Counter
Asynchronous counters are used to report monotonically increasing values on demand. It is recommended that callback functions registered with asynchronous counters should report total values, rather than increments, allowing aggregations to perform these calculations between current and previous measurements.
UpDown Counter
A synchronous instrument that measures values that can increase or decrease. As an UpDown Counter is non-monotonic, it allows reporting positive or negative deltas to the current value. This is inherently different from the counter that always represents an overall total, because of its monotonic nature.
The UpDown Counter also exposes an add method, but doesn’t reject negative values:
class UpDownCounter(_Synchronous, APIUpDownCounter):
    def add(
        self, amount: Union[int, float], attributes: Dict[str, str] = None
    ):
        self._measurement_consumer.consume_measurement(
            Measurement(amount, self, attributes)
        )
Asynchronous UpDown Counter
Similar to an UpDown counter, but reports measurements only on demand; its usage is recommended when values can be logically represented across a time series, and their computation is trivial. Asynchronous UpDown Counter is commonly used to measure metrics like memory usage for user applications in a system.
Gauge
An OpenTelemetry gauge is a synchronous instrument that measures arbitrary values at the time of recording, meaning these measurements can go up or down over time. Values of a gauge are non-additive across measurements. Consider CPU usage- their sum might produce a value greater than 100%.
Asynchronous Gauge
A gauge that reports values only when observed. You should use an asynchronous gauge when non-summable data needs to be measured at regular intervals, rather than in a continuous stream.
Histogram
Histograms are synchronous instruments that record the distribution of non-negative values across pre-defined buckets, that represent ranges. These help make sense of data points that must be studied in groups across a distribution. Each value added to the histogram is placed in the bucket based on a defined unit of measurement, such as time in seconds.
As an example, think of the time a customer spends on a product page. Majority customers spending minutes viewing a product might indicate desirable features — it might be a good indicator to rank that product higher in your search results.
Histogram’s record method implementation is similar to the Counter’s add method, where it only processes non-negative values.
How to Select the Right Instrument?
Deciding which OpenTelemetry metric instrument to use can be challenging. Selecting the right instrument is crucial, as it determines how measurements are collected and the type of metric exported, ultimately affecting how you can query and analyse the data.
So, how do you choose the right instrument?
The simple answer is that there's no one-size-fits-all solution. Multiple instruments can often be applicable for a given use case. However, by considering specific aspects of your measurement needs, you can narrow down the pool of suitable instruments.
Before proceeding, we will try to understand two important properties of metrics that will help us in choosing the right instrument.
-
Additive property is about whether you can combine values (like adding across different sources or time periods) and still produce meaningful information.
For instance, sum of HTTP requests hitting different servers in a period of time.
-
Monotonic property is about the direction of change, whether the value only goes one way (usually up) over time.
To give an example, the total bytes sent over a network, it only goes up as more data is sent.
Now, with this knowledge, you can use the table below to make a list of instruments that best fit your needs.
| Instrument | Additive | Monotonic | Use cases |
|---|---|---|---|
| Counter | ✅ | ✅ |
|
| Async counter | ✅ | ✅ |
|
| UpDown counter | ✅ | ❎ |
|
| Async upDown counter | ✅ | ❎ |
|
| Gauge | ❎ | ❎ |
|
| Async gauge | ❎ | ❎ |
|
| Histogram | ✅ | ❎ |
|
Now that we have understood each instrument in depth and when to use them, let’s see how to use it in our applications!
Modify Aggregations Through Views
Views allow you to manipulate metric data streams before they are aggregated and exported through the application. They enable renaming instrumentations, modifying aggregation behavior, reducing metric cardinality, or even dropping entire metrics when needed.
The following is a simple example of using views to modify metrics streams:
from opentelemetry.sdk.metrics import MeterProvider
from opentelemetry.sdk.metrics.export import ConsoleMetricExporter, PeriodicExportingMetricReader
from opentelemetry.sdk.metrics.view import View

exporter = ConsoleMetricExporter()
reader = PeriodicExportingMetricReader(exporter, export_interval_millis=5000)

# Rename a metric instrument
name_changer_view = View(
    instrument_name="total_requests",
    name="renamed_total_requests", # new name
)

# Keep / drop specific attribute dimensions
drop_view = View(
    instrument_name="external_requests",
    attribute_keys=["http.method", "http.status_code"],  # drop all others
)

provider = MeterProvider(
    metric_readers=[reader],
    views=[name_changer_view, drop_view],
)

meter = provider.get_meter("sample")

requests_counter = meter.create_counter("total_requests")
external_requests_counter = meter.create_counter("external_requests")

# example usage
requests_counter.add(1)
external_requests_counter.add(1, {"http.method": "GET", "http.status_code": "200", "user.id": "123"})
Adding Metadata to Metric Instruments
When registering an instrument, we associate it with a meter and identify it with a set of parameters passed to the instrument.
Each instrument will have the following parameters,
-
The name of the instrument
-
The kind of the Instrument
- if it’s a counter, gauge or any other instrument
- if it’s asynchronous or synchronous
-
A unit of measure [optional]
-
A description [optional]
-
Advisory parameters [optional]
Currently, OTel supports two advisory parameters including Attributes and ExplicitBucketBoundaries
Let’s try registering a simple counter with some parameters which counts the number of database queries made,
# Get a meter for our database service
meter = metrics.get_meter("database_service")

# name: db.queries.count
# kind: Counter (synchronous)
# unit: "queries"
# description: "Total number of database queries executed"

query_counter = meter.create_counter(
    name="db.queries.count",
    description="Total number of database queries executed",
    unit="queries"
)

## code ##

def execute_query(query_type, table, query_time_ms):
    """Simulate executing a database query and record metrics"""

    # 1. Record a query execution using the counter
    query_counter.add(
        1,  # Increment by 1
        {
            "query_type": query_type,  # Attribute: type of query
            "table": table             # Attribute: table being queried
        }
    )
Having understood how to create an instrument and define it with parameters, let’s explore some pratical ways to leverage these instruments for measuring custom metrics.
Metric Code Examples
Let’s look at some fun examples of measuring items using the above instruments. For the purpose of demonstration, we will assume the context of a simple, e-commerce application coded in Python.
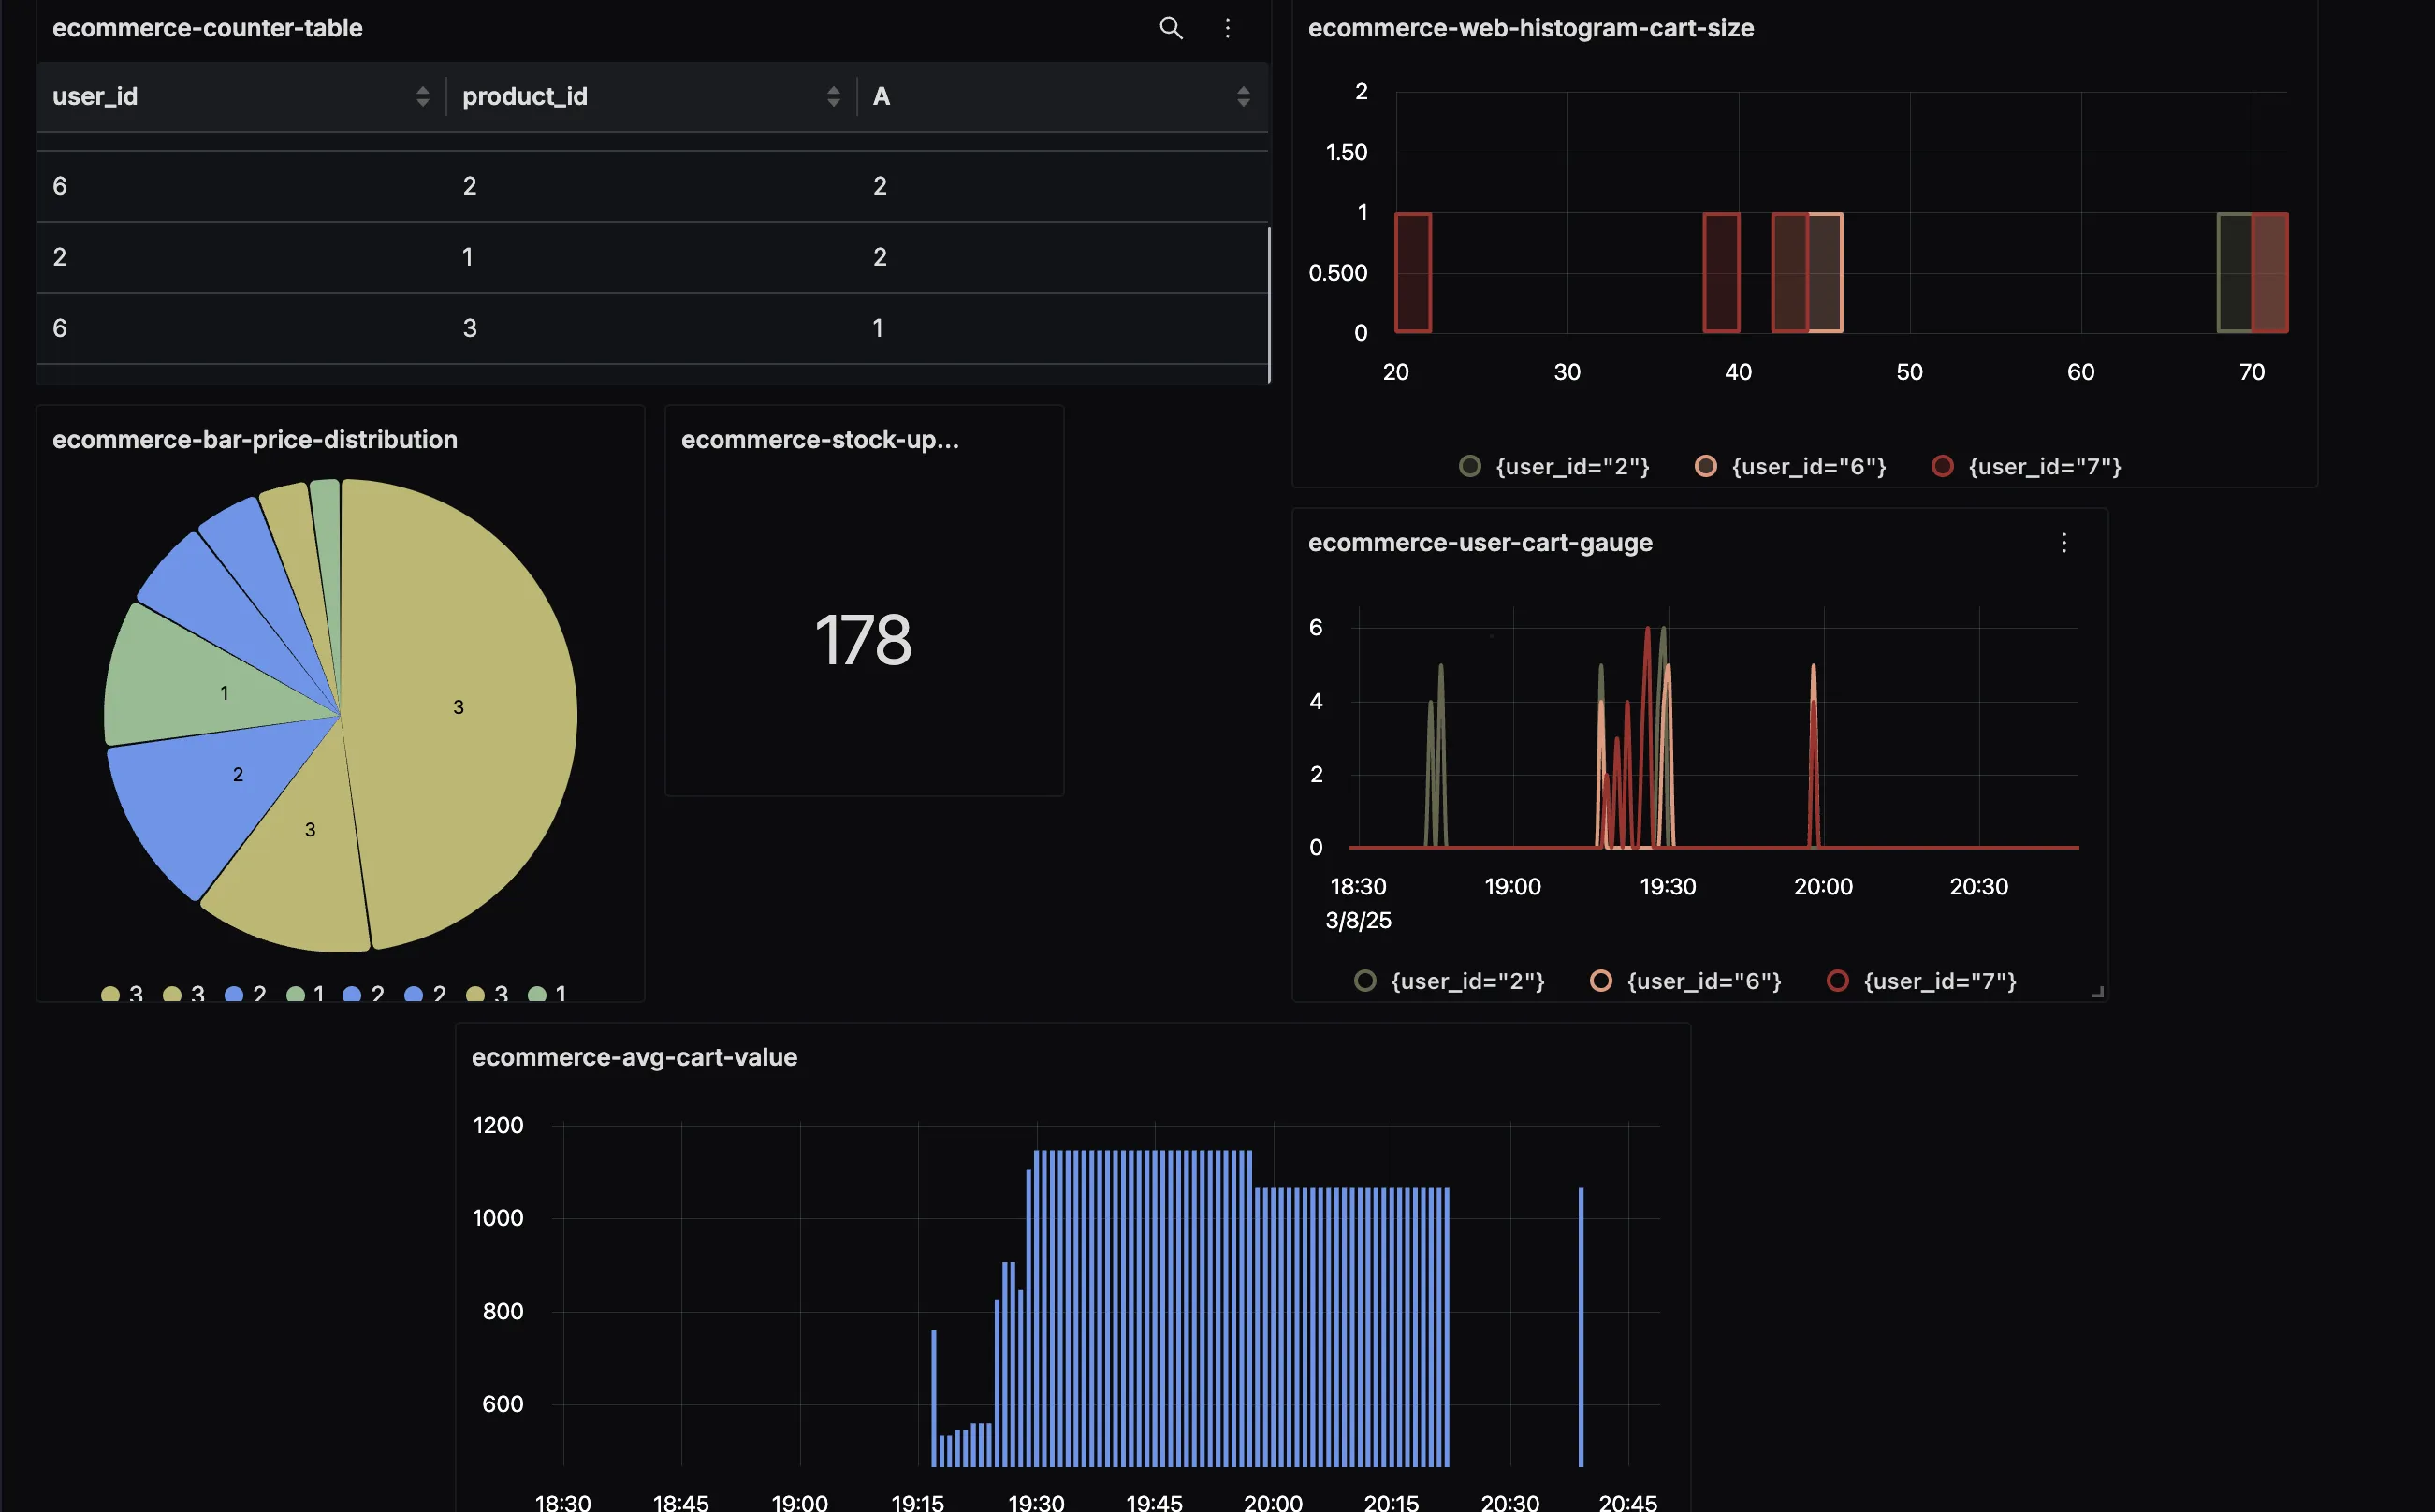
1. Items added to cart per user and per product using an upDown counter
# Register the counter
items_in_cart = meter.create_up_down_counter(
		name="items_in_cart_current",
		description="Current number of items in the cart",
		unit="1"
		)

## code ##

# Add to cart
@app.route('/add_to_cart/<int:product_id>', methods=['POST'])
@login_required
def add_to_cart(product_id):
		# Connect to database
    # Update the database
    # Update counter by 1
    items_in_cart.add(1, attributes={"user_id": str(current_user.id), "product_id": str(product_id)})
We notice that attributes (advisory parameter) are passed as a parameter for the add operation of the upDown counter. Attributes are metadata that enrich and provide context to the metric being recorded.
In the above example,
- user_id - An attribute that ties the metric to a specific user, allowing you to track cart activity per individual.
- product_id: An attribute that links the metric to a specific product, enabling analysis of which items are being added most often.
Without attributes, the metric would simply show that ‘Z items were added to cart’. With attributes, you can filter, aggregate, or visualise the data in tools like SigNoz to see how many items user X added or how popular product Y is. This makes the metric far more actionable for monitoring and debugging.
2. Cart size per user using a gauge
# Register the gauge
cart_size_gauge = meter.create_gauge(
    name="cart_size",
    description="Current number of items in the cart per user",
    unit="1"
)

## code ##

# Home page with product listing
@app.route('/')
def index():
    # Connect to database
    # Initialize cart count
    cart_count = 0

    # If user is logged in, get their cart items and calculate total quantity
    if current_user.is_authenticated:
        # Get user cart items (cart_count)
        # Calculate total quantity
        # Update metrics
        cart_size_gauge.set(cart_count, attributes={"user_id": str(current_user.id)})
3. Distribution of product prices in the cart using an histogram
# Register the histogram
cart_price_histogram = meter.create_histogram(
    name="cart_price_distribution",
    description="Distribution of product prices in the cart",
    unit="USD"
)

## code ##

# Add to cart
@app.route('/add_to_cart/<int:product_id>', methods=['POST'])
@login_required
def add_to_cart(product_id):
    # Fetch product prices and ids from the database
    # Update metrics
    cart_price_histogram.record(product_price, attributes={"user_id": str(current_user.id), "product_id": str(product_id)})
4. Total stock across all products using an asynchronous (observable) upDown counter
# Asynchronous upDown counter callback
def get_total_stock(_):
    # Make a connection to db
    # Perform sum query
    c.execute("SELECT SUM(stock) FROM products")
    total = c.fetchone()[0] or 0
    # Close db connection
    # Yield metric value
    yield metrics.Observation(total)

  # Register the updown counter
  meter.create_observable_up_down_counter(
    name="total_stock",
    description="Total stock across all products",
    unit="1",
    callbacks=[get_total_stock]
)
We had previously touched upon callbacks. Let’s try to understand it in greater depth with the code sample above.
In the code, a callback (get_total_stock) is a function that you provide to the metrics system via the meter. It gets called automatically whenever the system needs to collect the current value of the metric, in this case, the total_stock.

5. Average monetary value across all users’ carts using asynchronous (observable) gauge
# Asynchronous gauge callback
def get_average_cart_value(_):
    # Make a connection to db
    # Perform query to get average cart value
    c.execute('''SELECT AVG(total_value)
                 FROM (SELECT SUM(p.price * c.quantity) as total_value
                       FROM cart c
                       JOIN products p ON c.product_id = p.id
                       GROUP BY c.user_id)''')
    avg_value = c.fetchone()[0] or 0.0
    # Close db connection
    # Yield metric value
    yield metrics.Observation(avg_value)

# Register the gauge
meter.create_observable_gauge(
    name="average_cart_value",
    description="Average monetary value of all users' carts",
    unit="USD",
    callbacks=[get_average_cart_value]
)
Voila, you are now ready to add custom metrics to your applications!
These snippets keep things minimal so each instrument stands out; for a real-world metrics example that wires this up against an actual datastore, see our guide on monitoring PostgreSQL metrics with OpenTelemetry.
Visualizing OpenTelemetry Metrics
OpenTelemetry helps you in generating metrics. If you want to store and visualize them, you need to send them to an OpenTelemetry-compatible backend like SigNoz.
Using our dashboards and alerts feature, you can monitor any custom metric coming from your application.
SigNoz cloud is the easiest way to run SigNoz. Sign up for a free account and get 30 days of unlimited access to all features.
FAQs
What are OpenTelemetry Metrics?
OpenTelemetry Metrics are numerical measurements captured over time that provide quantifiable insights into service health, performance, and behavior. Metrics help detect system anomalies, track usage trends and ensure service reliability.
By configuring alerts on key metrics, you can identify issues early and take proactive action before they impact users.
What is a Meter in OpenTelemetry?
A meter is used to create metric instruments, such as gauges, counters and histograms, that record measurements from your applications. A meter is initialized by a MeterProvider, that acts as a factory for meters.
What is the Difference Between Prometheus and OpenTelemetry Metrics?
While Prometheus exclusively focuses on metrics monitoring and storage, OpenTelemetry defines open standards to generate and collect telemetry such as traces, metrics, and logs. Prometheus typically uses a pull-based model, scraping /metrics endpoints at regular intervals. OpenTelemetry pipelines generally push telemetry data to the OTel Collector or an observability backend. However, OpenTelemetry also supports pull-based pipelines via Prometheus exporters and receivers.
For a deeper breakdown, read our OpenTelemetry vs Prometheus guide. If you are specifically comparing standards and wire formats, our OpenMetrics vs OpenTelemetry comparison adds that extra layer of context.
What is the Difference Between OpenTelemetry Metrics and Traces?
OpenTelemetry Metrics are measurements captured over time that allow developers to track system health and ensure reliability. OpenTelemetry Traces capture the details of individual requests across your application and detail how services interact with one another.
Metrics provide a bird’s eye view of application health, while traces help identify particular issues, such as higher failure rates for one product in an e-commerce store.
We have a comprehensive guide covering the differences between traces and metrics.
Key Takeaways
-
OpenTelemetry [OTel] metrics provide a standardised framework for collecting, processing, and exporting metric data from applications.
-
There are seven different measurement instruments in OTel, including counters, gauges, and histograms, each serving specific use cases based on their additive and monotonic properties.
-
Metrics can be collected synchronously or asynchronously depending on the instrument type and use case.
-
Fun examples using a Python e-commerce application, showing how to implement various metrics like cart items, stock levels, and price distributions.
