Parsing logs with the OpenTelemetry Collector
This guide is for anyone who is getting started monitoring their application with OpenTelemetry, and is generating unstructured logs. As is well understood at this point, structured logs are ideal for post-hoc incident analysis and broad-range querying of your data. However, it’s not always feasible to implement highly structured logging at the code level.
With SigNoz, you get some parsing automatically to identify details like timestamp, container ID, container name, and an optional body. But it’s possible to go much deeper with a relatively simple configuration. It’s also a good idea to check for attributes that may contain Personal Identifying Information (PII) and remove them with filters. Since the SigNoz collector is a fork of the OpenTelemetry collector, this tutorial will also work for configuring a baseline OpenTelemetry collector.
Step 1. Send OpenTelemetry data to SigNoz
If you’re not reporting data already, check out our guide on sending data from a demo Node.js application, then come back here!
For the purposes of this tutorial, we’ll be running the SigNoz collector and other components locally as Docker containers, but you can just as well run on Kubernetes or with Docker Swarm.
Step 2. Send Logs
Currently, logging is not natively supported by the OpenTelemetry sdk in several languages. This means you’ll need to leverage your existing logs pipeline to send logs to the SigNoz (or OpenTelemetry) collector. There are several ways to get your logs into OpenTelemetry:
- The Bridge API is intended to connect existing logging with OpenTelemetry. It can be used together with existing logging libraries to automatically inject the trace context in the emitted logs, and provide an easy way to send the logs via OTLP.
- File or stdout export - if you have access to read your logging file periodically or tail your logs, you can parse bare files or .csv or json-formatted and send them to the collector. If you cannot parse your logs yourself, another log collection agent, such as FluentBit can collect the logs, then send the logs to OpenTelemetry Collector.
In Java, you also have the option of using automatic instrumentation to collect logs.
For my example, I sent logs directly via network calls using OTLP, but this approach is specifically not recommended for production use. It makes sense: you wouldn’t want to maintain dozens of network calls from inside your code, nor pay for the network overhead!
Step 3: Configure the SigNoz Collector
If you take a look in the SigNoz repository, you’ll find the configuration for the collector in /deploy/docker/otel-collector-config.yaml (you probably grabbed this project above during the install process). You can edit this file to filter what logs are being stored after being received by the collector.
After editing this file, you’ll need to restart the collector. If using Docker, the command would be docker restart signoz-otel-collector
It’s worth examining some chunks of this config unedited (since it may change in the future I won’t refer to line numbers here, just pointing out relevant sections). Again, the SigNoz collector is a fork of the OpenTelemetry collector, and all this configuration is applicable to the collector in general.
Batching to prevent unecessary network requests
 batch:
    send_batch_size: 10000
    send_batch_max_size: 11000
    timeout: 10s
It’s critical to include some batching configuration within the collector, as you can quickly overuse resources if you’re sending data with every single span or metric received.
send_batch_size : Number of spans, metric data points, or log records after which a batch will be sent regardless of the timeout. send_batch_size acts as a trigger and does not affect the size of the batch.
send_batch_max_size: The upper limit of the batch size. 0 means no upper limit of the batch size.
timeout: Time duration after which a batch will be sent regardless of size. Note that while testing you may want to reduce this, since it’s unlikely your test data will fill up the batch size, giving you 10+ seconds of latency. I set this down to 1s
Filter processors for unwanted logs
In the receivers: section you’ll find this rather large expression:
- type: filter
  id: signoz_logs_filter
  expr: 'attributes.container_name matches "^signoz-(logspout|frontend|alertmanager|query-service|otel-collector|clickhouse|zookeeper)"'
The filter processor allows users to filter telemetry based on include or exclude rules. Include rules are used for defining “allow lists” where anything that does not match include rules is dropped from the collector. Exclude rules are used for defining “deny lists” where telemetry that matches rules is dropped from the collector.
In this case, we don’t want our SigNoz process to get ‘too meta’ so we’re eliminating logging that’s generated by our own containers and their attached services, so that it’s not confusing your application data.
Notably, the filtering defined here won’t take effect unless it’s referenced in the pipelines section.
In my case, my logging was getting clogged up by docker containers I was running from poking around with another Kubernetes tool called Testkube, so I updated the pattern to exclude anything with the name testkube:
- type: filter
  id: signoz_logs_filter
  expr: 'attributes.container_name matches "^(signoz-(logspout|frontend|alertmanager|query-service|otel-collector|clickhouse|zookeeper)|.*testkube.*)"'
I couldn’t be quite so elegant in finding testkube container logs since 'testkube' didn’t appear at the beginning.
Now it’s time to execute this config. If you’re anything like me, a quick stop at yamllint should be in order to make sure you have no formatting issues with your YAML (perhaps even check out the nice UTF-8 formatted output to make sure you’re not dealing with any issues with smart quotes or other junk in your regex). Finally restart the collector with docker restart signoz-otel-collector and send some logs to see the updates.
Step 4: Add attributes
To add attributes to all lines logged by this collector, add a section to the processors to add an attribute. This example is a bit contrived, but let’s say that this collector is only gathering data for a single client organization:
attributes/clientid:
actions:
- key: client_id
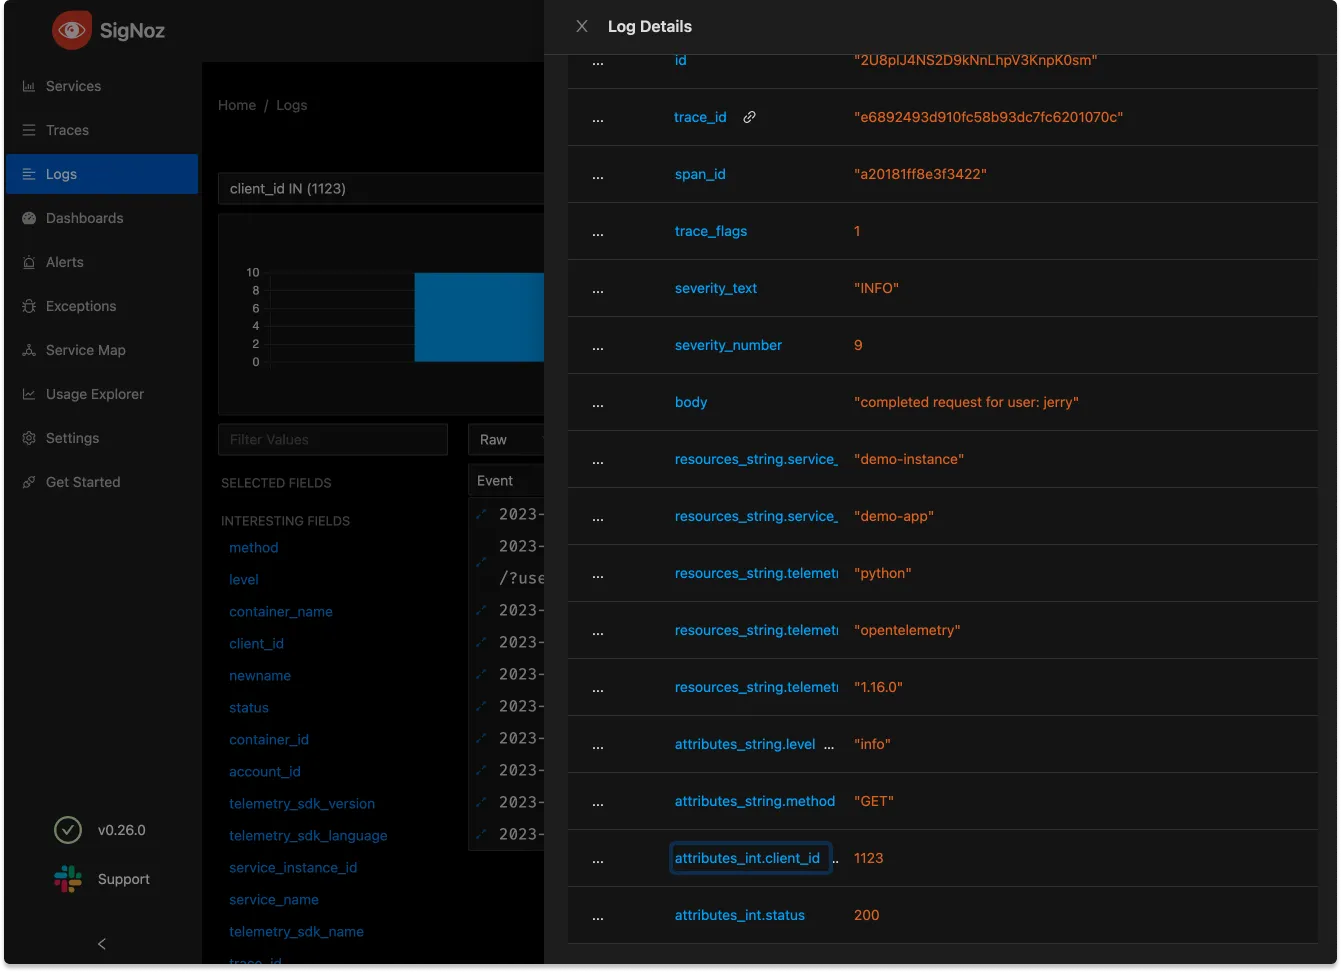
value: 1123
action: insert
There is much more sophisticated logic to be done here with re-using other attribute values and concatenation, but in this case we just want to give every single log line the same client_id attribute with a value of 1123
Adding this mapping, however, isn’t enough to add the attribute, we haven’t yet added this processor to our pipeline, check the pipelines mapping for logs:
logs:
  receivers: [otlp, tcplog/docker]
  processors: [logstransform/internal, batch]
  exporters: [clickhouselogsexporter]'
To actually affect our data, we must add it to the pipeline. The revised version looks like this:
logs:
  receivers: [otlp, tcplog/docker]
  processors: [logstransform/internal, attributes/clientid, batch]
  exporters: [clickhouselogsexporter]
Processors are executed in order so we want to add this processor before the batch processor. This is more critical if one of our processors scrubs out concerning data.
Step 5: Transform attributes to remove PII or other sensitive data
Now that we can add attributes, it’s time to give ourself more generalized tools for editing the data we’re parsing. This is done by transforming data, using the OpenTelemetry Transformation Language (OTTL). It’s not necessary or practical to learn all the ins and outs of this language, but let’s start with a simple bit of processing that adds some useful attributes.
Within the processors section. we’ll add a transform
transform:
log_statements:
- context: log
statements:
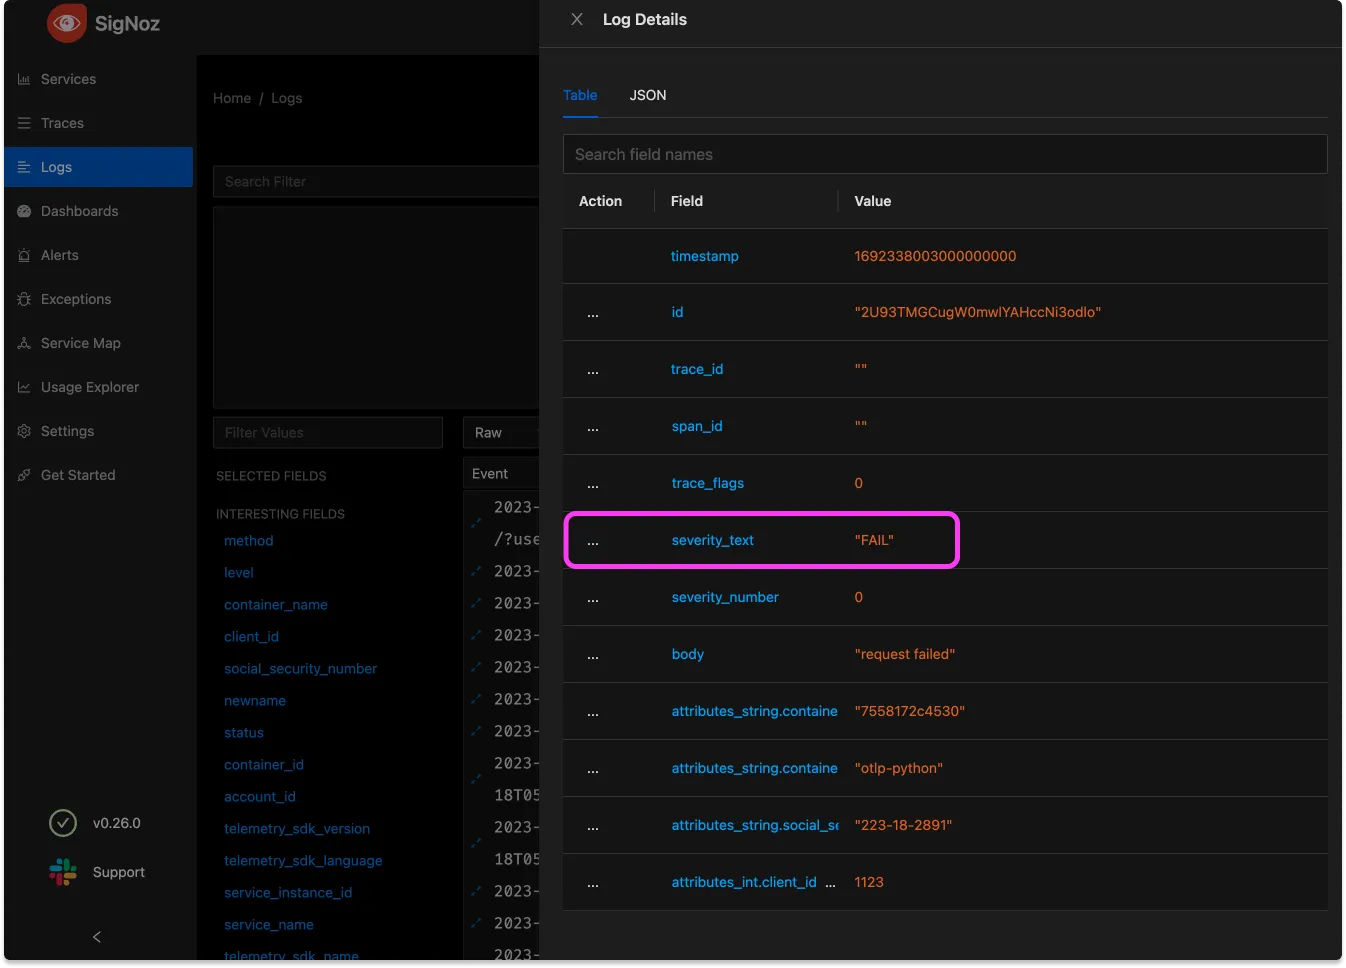
- set(severity_text, "FAIL") where body == "request failed"
This config is rather readable, with the goal of adding an attribute that’s clearly readable when there’s a particular request body. Note that it’s possible to do more complex matching here, but == works fine for this
Now let’s apply this tooling to a deeply spooky scenario: PII in our data. Eagle-eyed readers may have noticed in that last screenshot an attribute with a value that looks suspiciously like a user’s social security number (in the US, this number, connected to a legal name, constitutes the worst form of data breach).
The danger of our observability tool transmitting Personally Identifiable Information (PII) is one we never want to ignore. The inadvertent inclusion of PII in observability data potentially violates legal and regulatory compliance frameworks such as GDPR, HIPAA, and others that govern the handling of personal information. Breaches in these regulations may lead to financial penalties, legal action, and reputational damage.
transform:
log_statements:
- context: log
statements:
- set(severity_text, "FAIL") where body == "request failed"
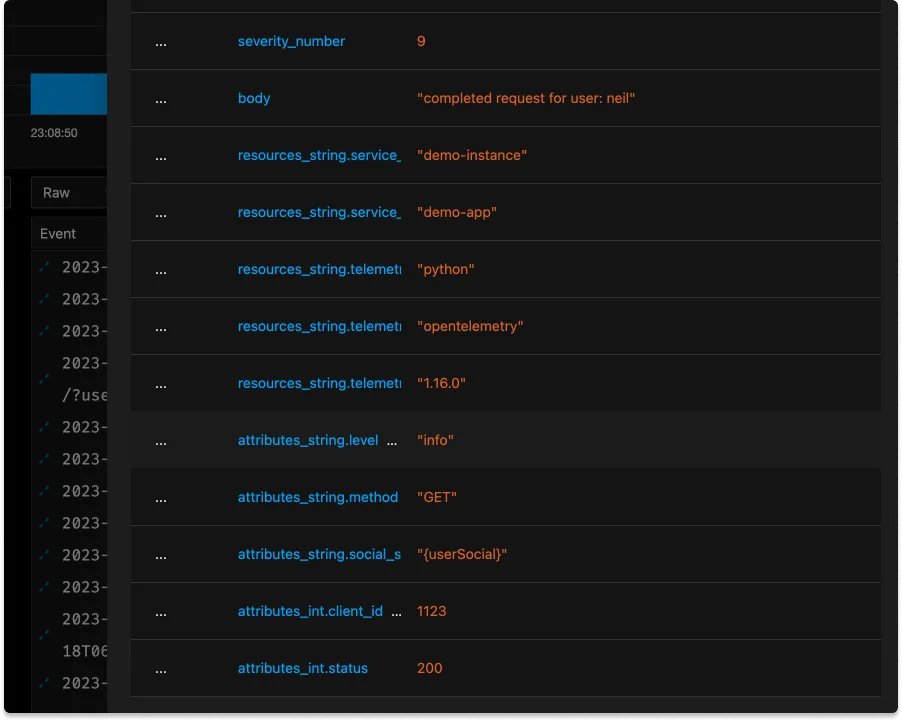
- replace_match(attributes["social_security_number"], "*", "{userSocial}")
Since, in this case, the PII was nicely labeled it’s easy enough to replace any possible value with a generic.
In a real-world scenario it might be worthwhile to try and filter out such vital information at the instrumentation layer if possible. However it’s always good to be filtering for PII twice!
On the criticality of ordering your pipeline
In this rather contrived example the PII was being added by a processor called attributes/userinfo. This is makes the ordering of the pipeline important, this collection:
logs:
      receivers: [otlp, tcplog/docker]
      processors: [logstransform/internal, attributes/userinfo, transform, batch]
      exporters: [clickhouselogsexporter]
will allow the transform to remove the PII added by attributes/userinfobut if we switch their places [logstransform/internal, transform, attributes/userinfo, batch] the PII won’t be overwritten!
Use transformation to reduce cardinality
While we always want our logging data to be highly specific, there are times when we are just making things more difficult on ourselves by introducing data that is of too high cardinality. See my previous work on high cardinality data. Here’s an example where some metric crushing will make our lives easier later
logs:
  replace_match(attributes["http.target"], "/user/*/list/*", "/user/{userId}/list/{listId}")
Notably it is possible that we will wish we had a userID for this log, but if so we should parse it out as its own attribute in the next section. Keeping ID’s in an [http.target](http://http.target) attribute will make it impossible to do any collation of data. Transformations can be a key step in normalizing our data.
Step 6: Parse Incoming Logs with a receiver regex
Before any processor sees our logs, they first hit the configured receivers. At the top of our baseline config for the SigNoz OpenTelemetry Receiver you find this expression:
receivers:
  tcplog/docker:
    listen_address: "0.0.0.0:2255"
    operators:
      - type: regex_parser
        regex: '^<([0-9]+)>[0-9]+ (?P<timestamp>[0-9]{4}-[0-9]{2}-[0-9]{2}T[0-9]{2}:[0-9]{2}:[0-9]{2}(\.[0-9]+)?([zZ]|([\+-])([01]\d|2[0-3]):?([0-5]\d)?)?) (?P<container_id>\S+) (?P<container_name>\S+) [0-9]+ - -( (?P<body>.*))?'
This receiver, if added to the pipeline, will only run on logs sent to the designated port.
Incoming logs are parsed here by the regex_parser operator which examines incoming strings and sets attributes. This is documented within the opentelemetry-collector-contrib repo. Note that altering the tcplog/docker receiver may result in missing data. The operator makes use of Go regular expressions. When writing a regex, consider using a tool such as regex101.
Here’s an example parser to handle timestamps
- type: regex_parser
  regex: '^Time=(?P<timestamp_field>\d{4}-\d{2}-\d{2}), Host=(?P<host>[^,]+), Type=(?P<type>.*)$'
  timestamp:
    parse_from: body.timestamp_field
    layout_type: strptime
    layout: '%Y-%m-%d'
regex_parsercan also contain if statements if you’re receiving messages of multiple types, e.g.
- type: regex_parser
  regex: '^Host=(?<host>)$'
  parse_from: body.message
  if: 'body.type == "hostname"'
not every message in this example will have the "type": "hostname" key/value pair and will therefore not be parsed by this pattern.
More Operators for Logs Management
See further documentation on logs receivers and operators in our docs for parsing CSV and JSON formats, syslog native parsing, and math and other functions.
Conclusions
Logs processing is extremely flexible and powerful with the OpenTelemetry Collector, and a combination of receivers and processors makes it possible to transform raw logs into highly structured data.
If you’d like to see how powerful this log parsing can be, before you re-configure your collector, check out our new logs explorer to dive in to your logging data. You’ll often find interesting insights, and can generalize them for next time by parsing your data more deeply.
