Prometheus vs InfluxDB - Key Differences, concepts, and similarities
Prometheus and InfluxDB are open-source projects created to make application performance monitoring a breeze. That is, of course, if you choose the option that covers your entire observability scope.

This article compares and contrasts the extent to which Prometheus and InfluxDB remedy the need for real-time insights into your applications’ operations. We’ll highlight similarities and overlaps in both usability and practicality.
Typically, every reader’s choice ultimately depends on their use case. As such, the knowledge we’ll expose you to should help you make informed choices on which tool works best.
What are Prometheus and InfluxDB?
Prometheus is an open-source monitoring and alerting toolkit. It's designed for reliability and scalability, making it a go-to choice for many DevOps teams. Prometheus collects and stores metrics as time series data, allowing for powerful querying and alerting capabilities.
InfluxDB, on the other hand, is a purpose-built time series database. It offers both open-source and commercial options, providing flexibility for different use cases. InfluxDB excels at handling high write and query loads, making it suitable for various monitoring and analytics scenarios.
Both tools have their roots in the need for better monitoring solutions in modern, distributed systems:
- Prometheus was developed by SoundCloud in 2012 and became a standalone open-source project in 2015.
- InfluxDB was created by InfluxData in 2013, aiming to provide a scalable solution for time series data.
Primary use cases for these systems include:
- Prometheus: Metrics-based monitoring, especially in cloud-native and microservices environments.
- InfluxDB: Time series data storage and analysis, including IoT sensor data, application metrics, and financial trading data.
A Crash Course to Prometheus
First deployed for open use by SoundCloud, Prometheus is a package of system monitoring and event alerting tools. Since 2016, it's been a part of the Cloud Native Computing Foundation (CNCF.) The same governance body for other revolutionary tools, such as the Kubernetes project.
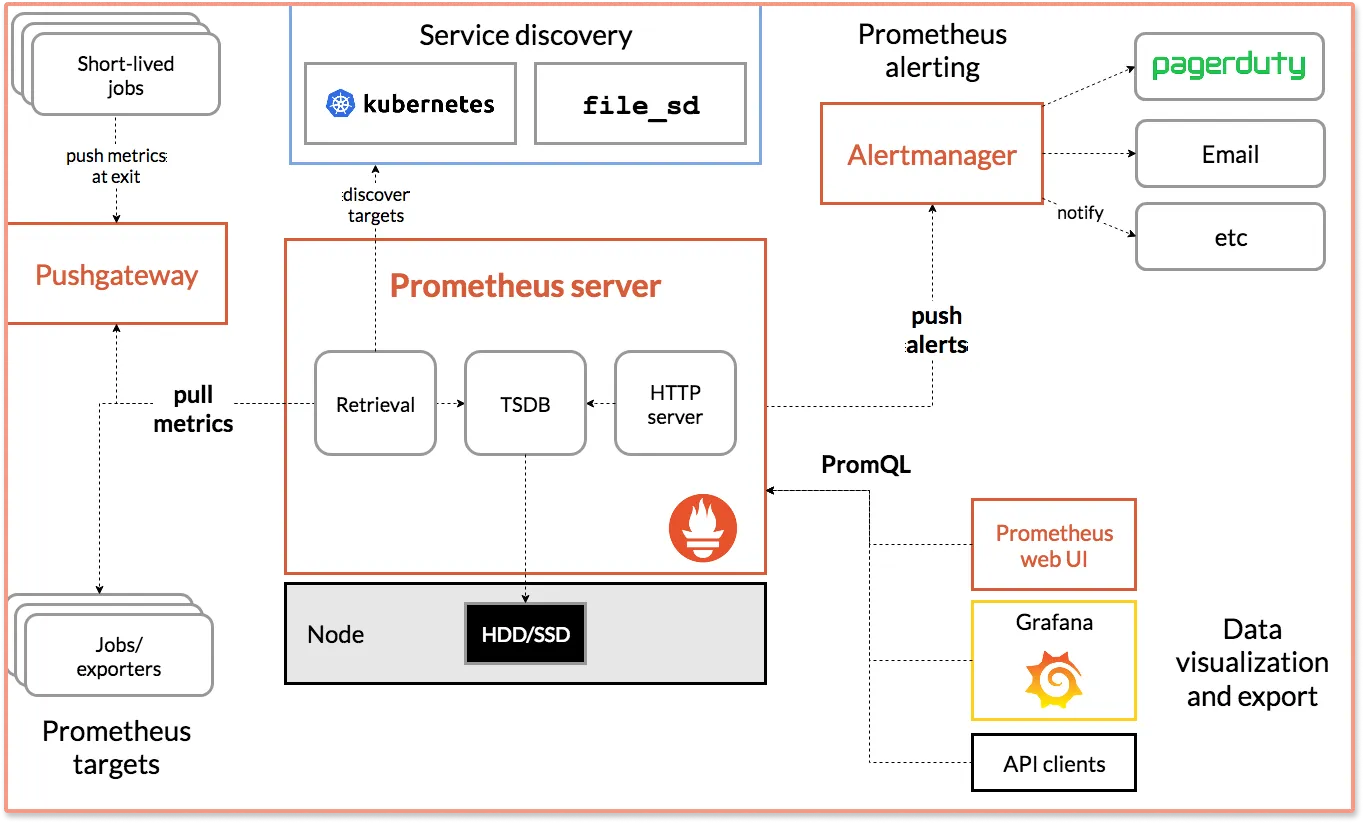
A typical Prometheus instance execution exposes a time-series model multi-dimensional database. It binds metrics and key/value arrays. The metrics data stored can be rendered in easy-to-evaluate visualizations through the default Expression Browser. But Prometheus provides a basic visualization layer. It is often teamed up with Grafana, an open-source data visualization tool to create richer dashboards.
Currently, data streams from the instrumentation of Prometheus' various client libraries are converted into time series models and formats. However, plans are underway to reveal system insights in an assortment of metric options:
Gauge - This is the metric type typically responsible for fluctuating readings on dashboards. For example, where resource usage (compute, storage, etc.) varies over time. So a gauge metric would suffice to push metrics for effective observability.
Counter - A metric that exposes a quality that only increases (positive count or reset). A good application area would be showing how many times an application has been visited over an observed duration.
Summary - In addition to the counter metric's ability, a summary exposes the intensity of an observed event. This facilitates comparative analysis of metrics, especially when they emerge from multiple telemetry collection sources/edges.
Histogram - Much like the summary metric, histogram metrics show a multi-variable sample result. They further group output into bars over the duration of observation. This facilitates comparative analysis of metrics. Especially when they emerge from multiple telemetry collection sources/edges.
InfluxDB 101 - A Crash Course

Available as an open-source tool, alongside a paid distribution of the same, InfluxDB provides a time-series data platform. InfluxDB is a capable time-series engine with a wide range of application areas. It’s designed to ingest and process multiple data points ingesting anything from metrics, traces, logs, and events.
InfluxDB was penned in Go, backed by the Y Combinator accelerator initiative, and officially deployed for public access in 2013 by then Errplane (now InfluxData).
InfluxDB comes filled to the brim with tools that facilitate the full range of data manipulation activity spectrum. These include:
A CLI (Telegraf) that is used to streamline read and write tasks from the actual data storage location. It comes in handy across all hosting options, cloud, local, and hybrid.
Querying and processing data from InfluxDB instances is made possible through the use of either InfluxQL or the proprietary Flux language, solely created for data scripting. With some practice, low-code end users can configure and schedule complex tasks through the InfluxDB UI to process data into valuable insights.
Monitoring and notifying users when triggers go off. With a variety of endpoints (Slack, email, HTTP, etc.), admins/analysts can keep tabs on environment variable statuses or simple event occurrences stored in the time series engine. This gives them the edge to react quickly and maintain optimal system performance when notifications chime.
Multiple visualization options become the go-to window for enhanced visibility into systems once all APIs and client libraries have been configured correctly.
Key Similarities Between Prometheus and InfluxDB
Apart from their key intentions being congruent, the most obvious commonality is that both are OSS. This means you could get away with using either, or both platforms at no cost. While this is a good way to onboard and prove their effectiveness on your projects, it also means you'd be using the very base of their distros.
Once they fetch telemetry data, they spit out compatible data types. Being multi-dimensional time-series data storage engines, you could create a pipeline including both Prometheus and InfluxDB to squeeze the most value from every byte of data extracted through query-based results or any logs trickling in from live applications.
One implemented both Prometheus and InfluxDB platforms' performance can be extended through plugins. Plugins add functionality above and beyond the collectors and extractors crucial to fetching and provisioning telemetry data.
Key Differences: InfluxDB vs. Prometheus
Despite being clearly useful for application performance monitoring, InfluxDB and Prometheus approach their objectives differently. To start with, they use different query languages (InfluxQL and PromQL) to explore underlying data pools.
Flux and FluxQL At A Glance
Flux is the official querying language for a vast array of operations in InfluxDB. Depending on the actual task at hand, InfluxQL will resemble the regular SQL most developers are familiar with.
join(
tables: {mem:memUsed, proc:procTotal},
on: ["_timestamp", "_halt", "_begin", "host"],
)
Take, for instance, a data transformation operation above, which looks and writes like regular SQL at first glance.
Typical PromQL Commands
Prometheus implements its own command language for data operations - PromQL. We'll use the same join function to demonstrate the difference in syntax.
label_join(up{job="api-server",src1="a",src2="b",src3="c"}, "foo", ",", "src1", "src2", "src3")
Although we have condensed the code above to just a single sentence, this is not to imply relative ease of use. Code density and complexity will vary depending on prior scripting experience and the scope of operations underway.
Also, all snippets of code above are extracts from the official PromQL and InfluxQL scripting documentation volumes.
Even the way time-series data is kept in data engines is different. Approaches to data storage (append-only vs. in-memory indexing and time structured merge trees). In addition to this disparity, the degree of accuracy for event timestamps is more precise within InfluxDB compared to Prometheus time-series stores.
Although both tools are OSS projects, InfluxDB also has a paid tier offering a fully-managed experience hosted in the cloud. InfluxDB also offers an enterprise-grade user-managed version. Prometheus is free unless you decide to use distros hosted by cloud services providers (AWS, GCP, AZURE, etc.).
Key Features of Prometheus vs InfluxDB
Understanding the core features of both systems is essential for making the right choice. Let's break down the key differences:
Data Model
Prometheus uses a multi-dimensional data model. Each time series is identified by a metric name and a set of key-value pairs called labels. This model allows for flexible and efficient querying across different dimensions.
Example Prometheus metric:
http_requests_total{method="POST", endpoint="/api/users"}
InfluxDB employs a tag-based data model. Data points consist of measurements, tag sets, and field sets. This model provides a good balance between flexibility and performance.
Example InfluxDB data point:
measurement,tag1=value1,tag2=value2 field1=value1,field2=value2 timestamp
Query Language
Prometheus uses PromQL (Prometheus Query Language), a powerful and flexible language designed specifically for time series data. PromQL allows for complex aggregations and calculations across multiple time series.
PromQL example:
rate(http_requests_total{method="GET"}[5m])
InfluxDB uses InfluxQL, which is similar to SQL, making it familiar to many developers. It also supports Flux, a more powerful scripting language for complex data transformations.
InfluxQL example:
SELECT mean("value") FROM "cpu" WHERE "host" = 'server01' GROUP BY time(10s)
Scalability and Clustering
Prometheus is designed for vertical scalability. It doesn't natively support clustering, but you can use federation or remote storage adapters for horizontal scaling.
InfluxDB offers built-in clustering in its commercial version, allowing for easier horizontal scaling out of the box.
Retention Policies and Data Management
Both systems provide ways to manage data retention:
- Prometheus uses a local storage engine with configurable retention periods.
- InfluxDB offers more granular control with retention policies that can be set per measurement or database.
Visualization Capabilities
Both Prometheus and InfluxDB integrate well with Grafana, a popular open-source visualization tool. This allows you to create rich, interactive dashboards for your metrics.
Prometheus provides a basic built-in expression browser for ad-hoc queries and graph exploration. InfluxDB offers Chronograf, part of the TICK stack, for native visualization.
Creating dashboards in Grafana with either system is straightforward:
- Add your Prometheus or InfluxDB data source in Grafana.
- Create a new dashboard and panels.
- Use PromQL or InfluxQL to query your data.
- Customize your visualizations with Grafana's rich set of options.
Performance and Scalability
Performance is a critical factor when choosing a monitoring tool. Here's how Prometheus and InfluxDB stack up:
Write and Read Performance
- Prometheus excels at read performance, making it great for querying and alerting.
- InfluxDB is optimized for high write throughput, handling millions of data points per second.
Horizontal Scaling
- Prometheus relies on functional sharding for horizontal scaling. You divide your metrics across multiple Prometheus servers.
- InfluxDB Enterprise offers native clustering, allowing for easier distribution of data across multiple nodes.
High Availability
- Prometheus achieves high availability through running multiple identical Prometheus servers and using Alertmanager for deduplication.
- InfluxDB Enterprise provides built-in replication and automatic failover.
Resource Consumption
- Prometheus is generally more resource-efficient for smaller to medium-sized deployments.
- InfluxDB may require more resources but offers better performance for very large datasets.
Data Collection and Storage
The way data is collected and stored can significantly impact your monitoring architecture:
Data Collection Methods
- Prometheus uses a pull-based model. It scrapes metrics from configured targets at regular intervals.
- InfluxDB uses a push-based model. Applications or agents send data to InfluxDB directly.
Storage Efficiency
Both systems use efficient storage formats:
- Prometheus uses a custom time series database format optimized for append-only writes and range queries.
- InfluxDB uses a Time-Structured Merge Tree (TSM) storage engine, providing high write and read throughput.
Data Retention and Downsampling
- Prometheus allows you to configure retention periods and uses a block-based storage for efficient data management.
- InfluxDB offers continuous queries and retention policies for automatic downsampling and data expiration.
Backup and Recovery
- Prometheus provides snapshot-based backups of its time series database.
- InfluxDB offers more comprehensive backup and restore functionality, including incremental backups.
Use Cases: When to Choose Prometheus or InfluxDB
Choosing between Prometheus and InfluxDB often depends on your specific use case:
Ideal Scenarios for Prometheus
- Cloud-native environments using Kubernetes
- Microservices architectures requiring service discovery
- When you need powerful alerting capabilities out of the box
Situations Where InfluxDB Excels
- IoT and sensor data collection with high write throughput
- Long-term data retention and historical analysis
- When you need a flexible, general-purpose time series database
Considerations for Mixed Environments
In some cases, you might use both:
- Prometheus for real-time monitoring and alerting
- InfluxDB for long-term storage and complex analytics
Industry-Specific Recommendations
- Finance: InfluxDB for high-frequency trading data
- E-commerce: Prometheus for real-time performance monitoring
- Manufacturing: InfluxDB for sensor data, Prometheus for process monitoring
Integration and Ecosystem
A robust ecosystem can make or break your monitoring solution:
Prometheus Ecosystem
- Exporters: A wide range of exporters available for various systems and applications
- Alert Manager: Handles alerts from Prometheus, including deduplication and routing
- Push Gateway: Allows short-lived jobs to expose metrics
InfluxDB Ecosystem
- Telegraf: A plugin-driven server agent for collecting and reporting metrics
- Kapacitor: Real-time streaming data processing engine for complex alerting
- Chronograf: Data visualization and administrative UI
Third-Party Tool Compatibility
Both systems integrate well with popular DevOps tools:
- Kubernetes: Native support in Prometheus, plugins available for InfluxDB
- Grafana: Excellent support for both as data sources
- Ansible/Chef/Puppet: Modules available for automated deployment
Community Support and Resources
- Prometheus: Large, active open-source community with extensive documentation
- InfluxDB: Strong community support, with additional resources from InfluxData
Conclusion: How To Select a monitoring tool
When all is said and done, one should ensure the closer fit of either Prometheus or InfluxDB to their specific monitoring requirements. Given how you can use InfluxDB to scrape data from Prometheus' collector endpoints when doing custom instrumentation, it might be worthwhile experimenting with their paired use to get the best experience.
Better still, when your application metrics monitoring scope is considerably large, going back to the fundamentals can be the way to go. Metrics are just one aspect of monitoring your application for performance issues. Today’s distributed applications need a combination of metrics, logs, and traces to debug performance issues quickly.
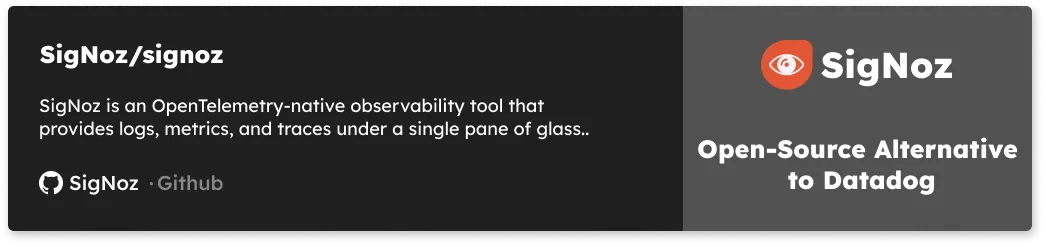
For that you can explore OpenTelemetry based full-stack APM, SigNoz. With SigNoz you can monitor metrics and track transactions across services with distributed tracing. There are other features like exceptions monitoring, custom dashboards, and alerts too.
SigNoz Cloud is the easiest way to run SigNoz. Sign up for a free account and get 30 days of unlimited access to all features.

You can also install and self-host SigNoz yourself since it is open-source. With 24,000+ GitHub stars, open-source SigNoz is loved by developers. Find the instructions to self-host SigNoz.
You can check out SigNoz GitHub repo here:
FAQs
How do Prometheus and InfluxDB handle high cardinality data?
Prometheus can struggle with high cardinality data due to its label-based model. InfluxDB generally handles high cardinality better, but both systems require careful management of tags and labels to avoid performance issues.
What are the main differences in querying between Prometheus and InfluxDB?
Prometheus uses PromQL, which is specifically designed for time series data and offers powerful functions for rate calculations and aggregations. InfluxDB uses InfluxQL (SQL-like) and Flux, providing familiar syntax for many developers and powerful data transformation capabilities.
Is it possible to migrate from Prometheus to InfluxDB or vice versa?
Migration between the two systems is possible but can be challenging due to differences in data models and query languages. Tools like Telegraf can help in migrating data, but you may need to adjust your queries and dashboards.
What are the main differences between Prometheus and InfluxDB?
The main differences include their query languages (PromQL vs InfluxQL/Flux), data storage approaches (append-only vs in-memory indexing), timestamp precision, and availability of paid tiers. Prometheus is primarily a metrics monitoring tool, while InfluxDB is a more versatile time-series database.
Can Prometheus and InfluxDB be used together?
Yes, Prometheus and InfluxDB can be used together. InfluxDB can scrape data from Prometheus' collector endpoints, allowing for custom instrumentation and potentially getting the best of both tools.
Which tool is better for application performance monitoring?
The choice depends on your specific requirements. Prometheus is excellent for metrics monitoring and alerting, especially in cloud-native environments. InfluxDB offers more versatility as a time-series database and can handle metrics, logs, and events. For comprehensive monitoring, consider using both or exploring full-stack APM solutions like SigNoz.
Are Prometheus and InfluxDB open-source?
Yes, both Prometheus and InfluxDB are available as open-source projects. However, InfluxDB also offers paid tiers with additional features and managed services.
What types of metrics can Prometheus collect?
Prometheus can collect various metric types, including:
- Gauge: for fluctuating measurements like resource usage
- Counter: for values that only increase, like visit counts
- Summary: for event intensity measurements
- Histogram: for grouped sample results over time
What visualization options are available for Prometheus and InfluxDB?
Prometheus provides a basic Expression Browser for visualization but is often paired with Grafana for richer dashboards. InfluxDB offers multiple built-in visualization options through its UI, allowing for various chart types and data representations.
If you want to know more about SigNoz, read this blog:
