Monitor your Python application with full stack open source APM tool - SigNoz
In this article, learn how to setup application monitoring for Python apps using an open-source solution, SigNoz.
If you want to check our Github repo before diving in 👇
The cost of a millisecond.
TABB Group, a financial services industry research firm, estimates that if a broker's electronic trading platform is 5 milliseconds behind the competition, it could cost $4 million in revenue per millisecond.
The cost of latency is too high in the financial services industry, and the same is true for almost any software-based business today. For Google, half a second delay in search results caused a 20% drop in traffic. Half a second is enough to kill user satisfaction to a point where they abandon an app's service.
While a user sees a screen, there are thousands of services in the background taking care of a user's request. In a microservices architecture, the challenge for engineering teams is to constantly figure out areas of optimization in a complex distributed network. And the solution starts with setting up a robust monitoring infrastructure for the application's production environment.
Capturing and analyzing data about your production environment is critical. You need to proactively solve stability and performance issues in your web application to avoid system failures and ensure a smooth user experience.
And to do that, you need insights into how your infrastructure handles user requests. With SigNoz, you can start monitoring your app in a few simple steps, and with an easy-to-use dashboard, you can quickly identify bottlenecks in your services.
Python Application Monitoring with SigNoz: Overview
SigNoz is a full-stack open-source application monitoring and observability platform which can be installed within your infra. You can track metrics like p99 latency, error rates for your services, external API calls, and individual endpoints. With service maps, you can quickly assess the health of your services.
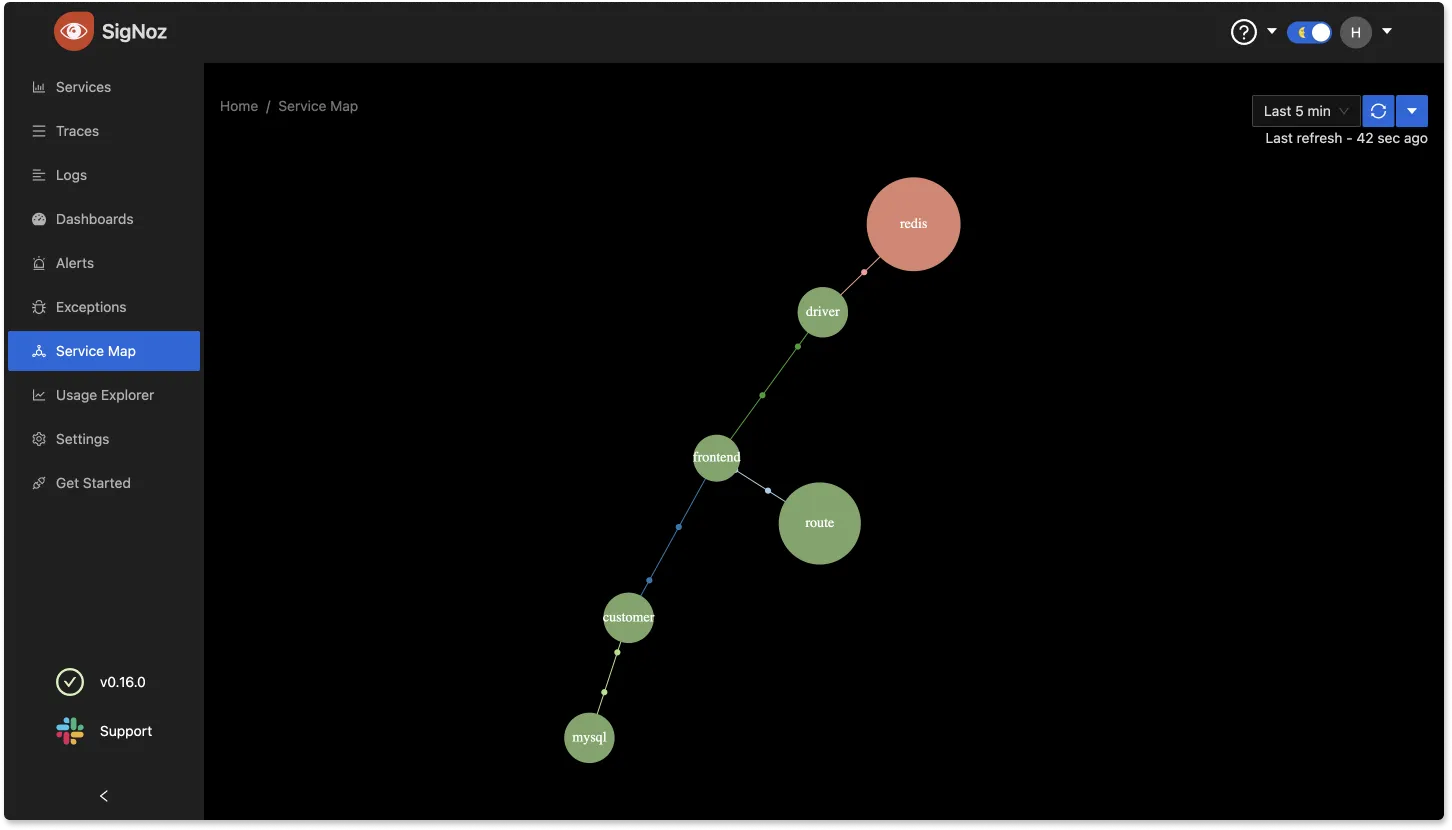
And once you know the affected service, trace data can help you identify the exact code causing the issue. Using SigNoz dashboard, you can visualize your traces easily with flamegraphs.

Now let's get down to some action and see everything for yourself.
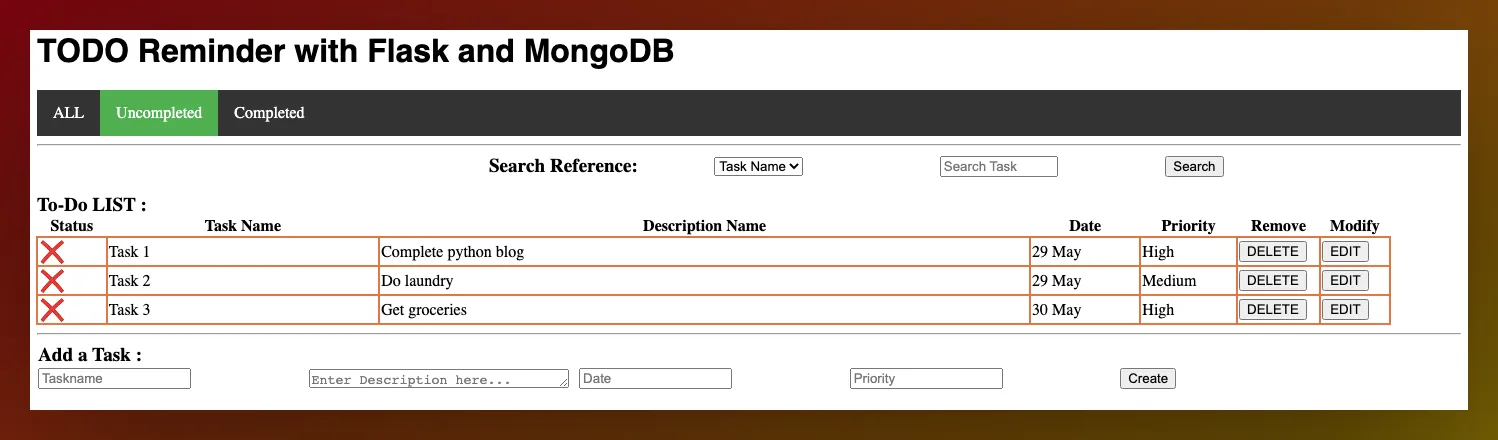
We have set up a sample ToDo Python app based on Flask web framework, which uses MongoDB as a database to demonstrate how SigNoz works. We will divide the tutorial into two parts:
- Setting Up Python Application Monitoring with SigNoz
- Instrumenting Your Python Application with OpenTelemetry
Setting Up Python Application Monitoring with SigNoz
You can get started with SigNoz using just three commands at your terminal.
git clone -b main https://github.com/SigNoz/signoz.git
cd signoz/deploy/
./install.sh
For detailed instructions, you can visit our documentation.

When you are done installing SigNoz, you can access the UI at: http://localhost:3301
The application list shown in the dashboard is from a sample app called HOT R.O.D that comes bundled with the SigNoz installation package.
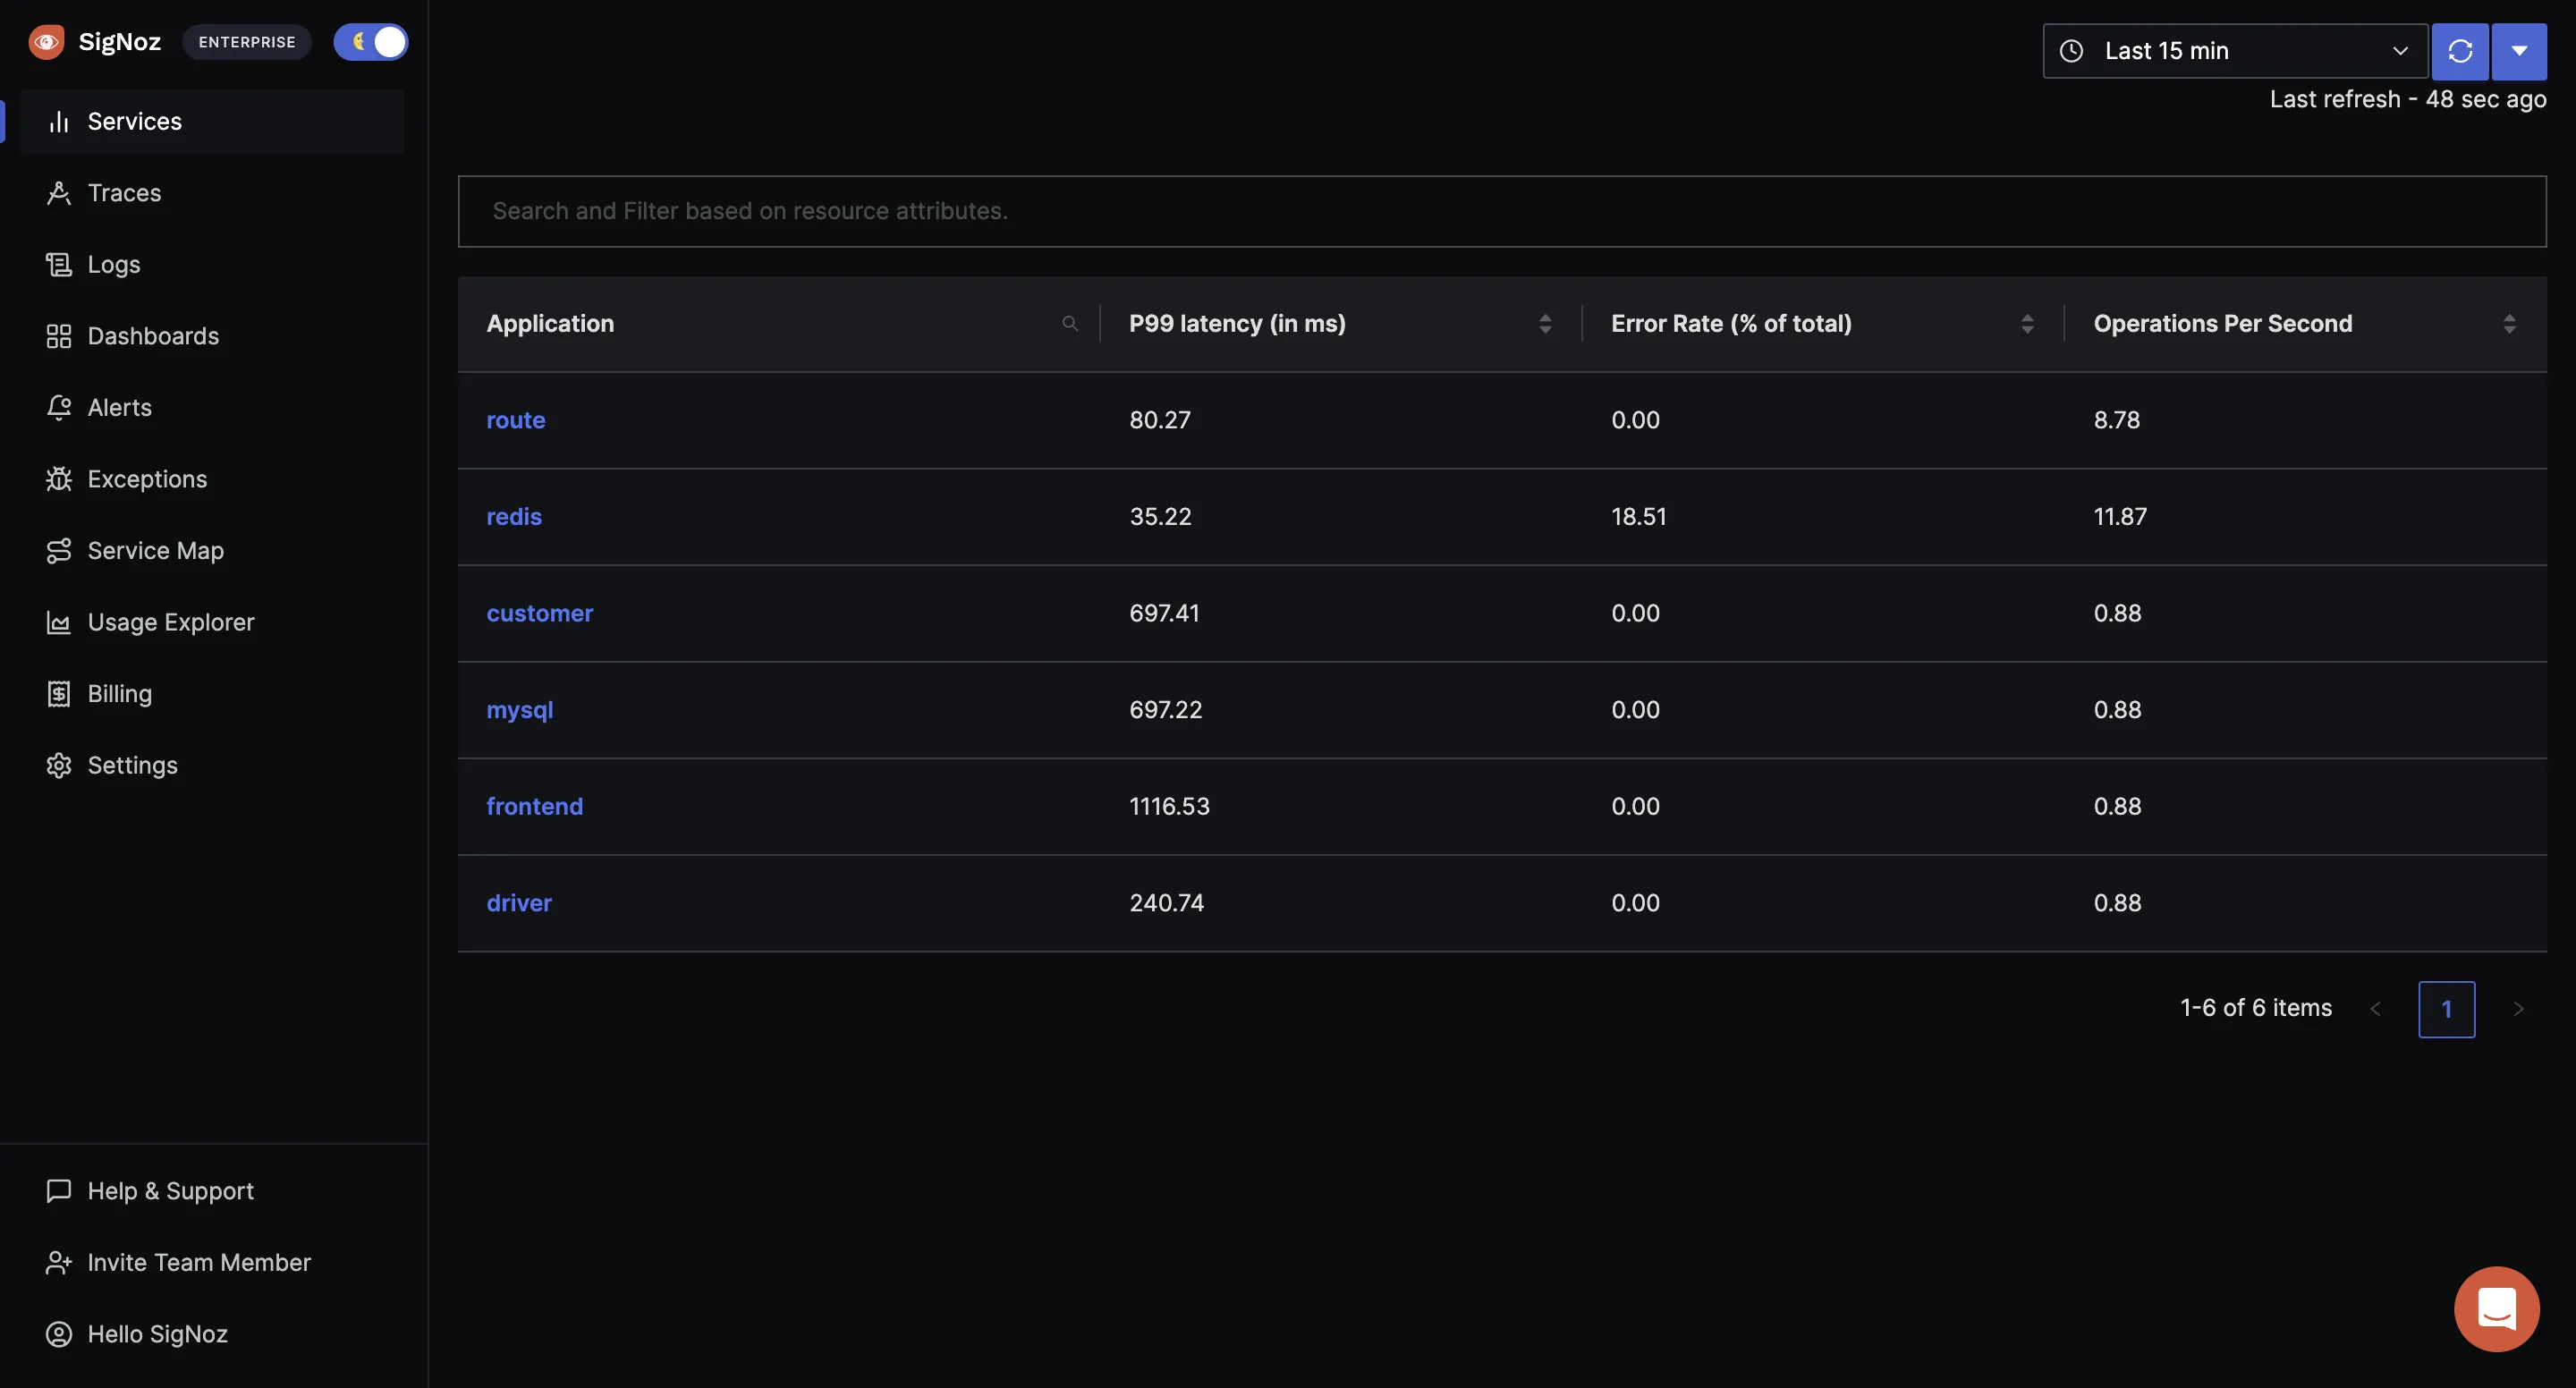
The applications shown in the dashboard are from a sample app called Hot R.O.D that comes with the installation bundle.
Now that you have SigNoz up and running, let's see how instrumentation works. Instrumentation is the process of implementing code instructions to monitor your application's performance. Instrumentation is key to see how your application handles the real world.
SigNoz supports OpenTelemetry as the primary way for users to instrument their application. OpenTelemetry is a single, vendor-agnostic instrumentation library per language with support for both automatic and manual instrumentation. You don't need to worry about instrumentation in this tutorial. OpenTelemetry comes with all currently available instrumentation.
Instrumenting Your Python Application with OpenTelemetry
The modern path to Python instrumentation is OpenTelemetry's zero-code agent: opentelemetry-bootstrap installs the right instrumentation libraries and opentelemetry-instrument runs your app with automatic support for distributed tracing, so you get spans for common frameworks without editing code. The dedicated Python performance monitoring guide covers metrics and optimization in depth.
Prerequisites
-
Python 3.8 or newer
If you do not have Python installed on your system, you can download it from the link here. Check the version of Python usingpython3 --versionon your terminal to see if Python is properly installed or not. -
MongoDB
If you already have MongoDB services running on your system, you can skip this step.For macOS: https://docs.mongodb.com/manual/tutorial/install-mongodb-on-os-x
For Linux: https://docs.mongodb.com/manual/administration/install-on-linux
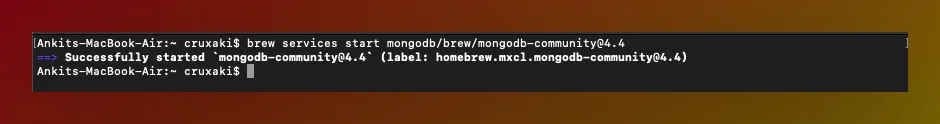
On MacOS the installation is done using Homebrew's brew package manager. Once the installation is done, don't forget to start MongoDB services using brew services start mongodb/brew/mongodb-community@4.4 on your macOS terminal.
Steps
Step 1. Clone sample Flask app repository
From your terminal use the following command to clone sample Flask app GitHub repository.
git clone https://github.com/SigNoz/sample-flask-app.git
Step 2. Update path to sample-flask-app
Check if the app is working or not using the following command:
cd sample-flask-app
python3 app.py
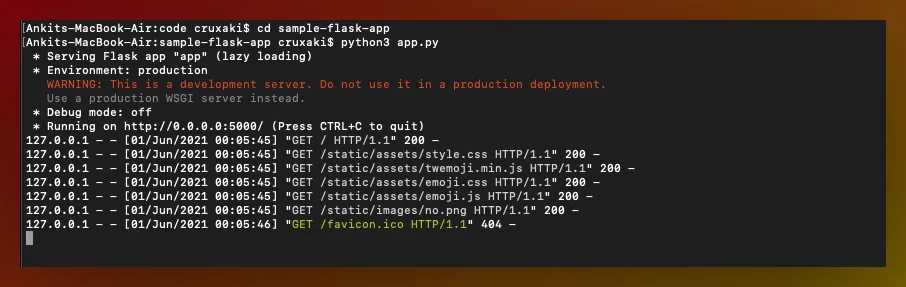
You can now access the UI of the app on your local host: http://localhost:5002/
Press 'Ctrl + C' to exit the app once you have made sure it is running properly.
Step 3. Set up OpenTelemetry Python instrumentation library
Your app folder contains a file called requirements.txt. This file contains all the necessary commands to set up OpenTelemetry python instrumentation library. All the mandatory packages required to start the instrumentation are installed with the help of this file. Make sure your path is updated to the root directory of your sample app and run the following command:
pip3 install -r requirements.txt
The opentelemetry-exporter-otlp is a convenience wrapper package to install all OTLP exporters. Currently, it installs:
-
opentelemetry-exporter-otlp-proto-http
-
opentelemetry-exporter-otlp-proto-grpc
-
(soon) opentelemetry-exporter-otlp-json-http
The opentelemetry-exporter-otlp-proto-grpc package installs the gRPC exporter which depends on the grpcio package. The installation of grpcio may fail on some platforms for various reasons. If you run into such issues, or you don't want to use gRPC, you can install the HTTP exporter instead by installing the opentelemetry-exporter-otlp-proto-http package. You need to set the OTEL_EXPORTER_OTLP_PROTOCOL environment variable to http/protobuf to use the HTTP exporter.
If it hangs while installing grpcio during pip3 install opentelemetry-exporter-otlp then follow below steps as suggested in this stackoverflow link
- pip3 install --upgrade pip
- python3 -m pip install --upgrade setuptools
- pip3 install --no-cache-dir --force-reinstall -Iv grpcio
Step 4. Install application specific packages
This step is required to install packages specific to the application. Make sure to run this command in the root directory of your installed application. This command figures out which instrumentation packages the user might want to install and installs it for them:
opentelemetry-bootstrap --action=install
Please make sure that you have installed all the dependencies of your application before running the above command. The command will not install instrumentation for the dependencies which are not installed.
Step 5. Configure environment variables to run app and send data to SigNoz
You're almost done. In the last step, you just need to configure a few environment variables for your OTLP exporters. Environment variables that need to be configured:
service.name- application service name (you can name it as you like)OTEL_EXPORTER_OTLP_ENDPOINT- In this case, IP of the machine where SigNoz is installed
IP of SigNoz backend is the IP of the machine where you installed SigNoz. If you have installed SigNoz on localhost, the endpoint will be http://localhost:4317 for gRPC exporter and http://localhost:4318 for HTTP exporter.
You need to put these environment variables in the below command.
OTEL_RESOURCE_ATTRIBUTES=service.name=<service_name> OTEL_EXPORTER_OTLP_ENDPOINT="http://<IP of SigNoz>:4317" opentelemetry-instrument python3 app.py
Don’t run app in reloader/hot-reload mode as it breaks instrumentation. For example, if you use export FLASK_ENV=development, it enables the reloader mode which breaks OpenTelemetry instrumentation.
As we are running SigNoz on local host, IP of SigNoz can be replaced with localhost in this case. And, for service_name let's use pythonApp. Hence, the final command becomes:
Final Command
OTEL_RESOURCE_ATTRIBUTES=service.name=pythonApp OTEL_EXPORTER_OTLP_ENDPOINT="http://localhost:4317" opentelemetry-instrument python3 app.py
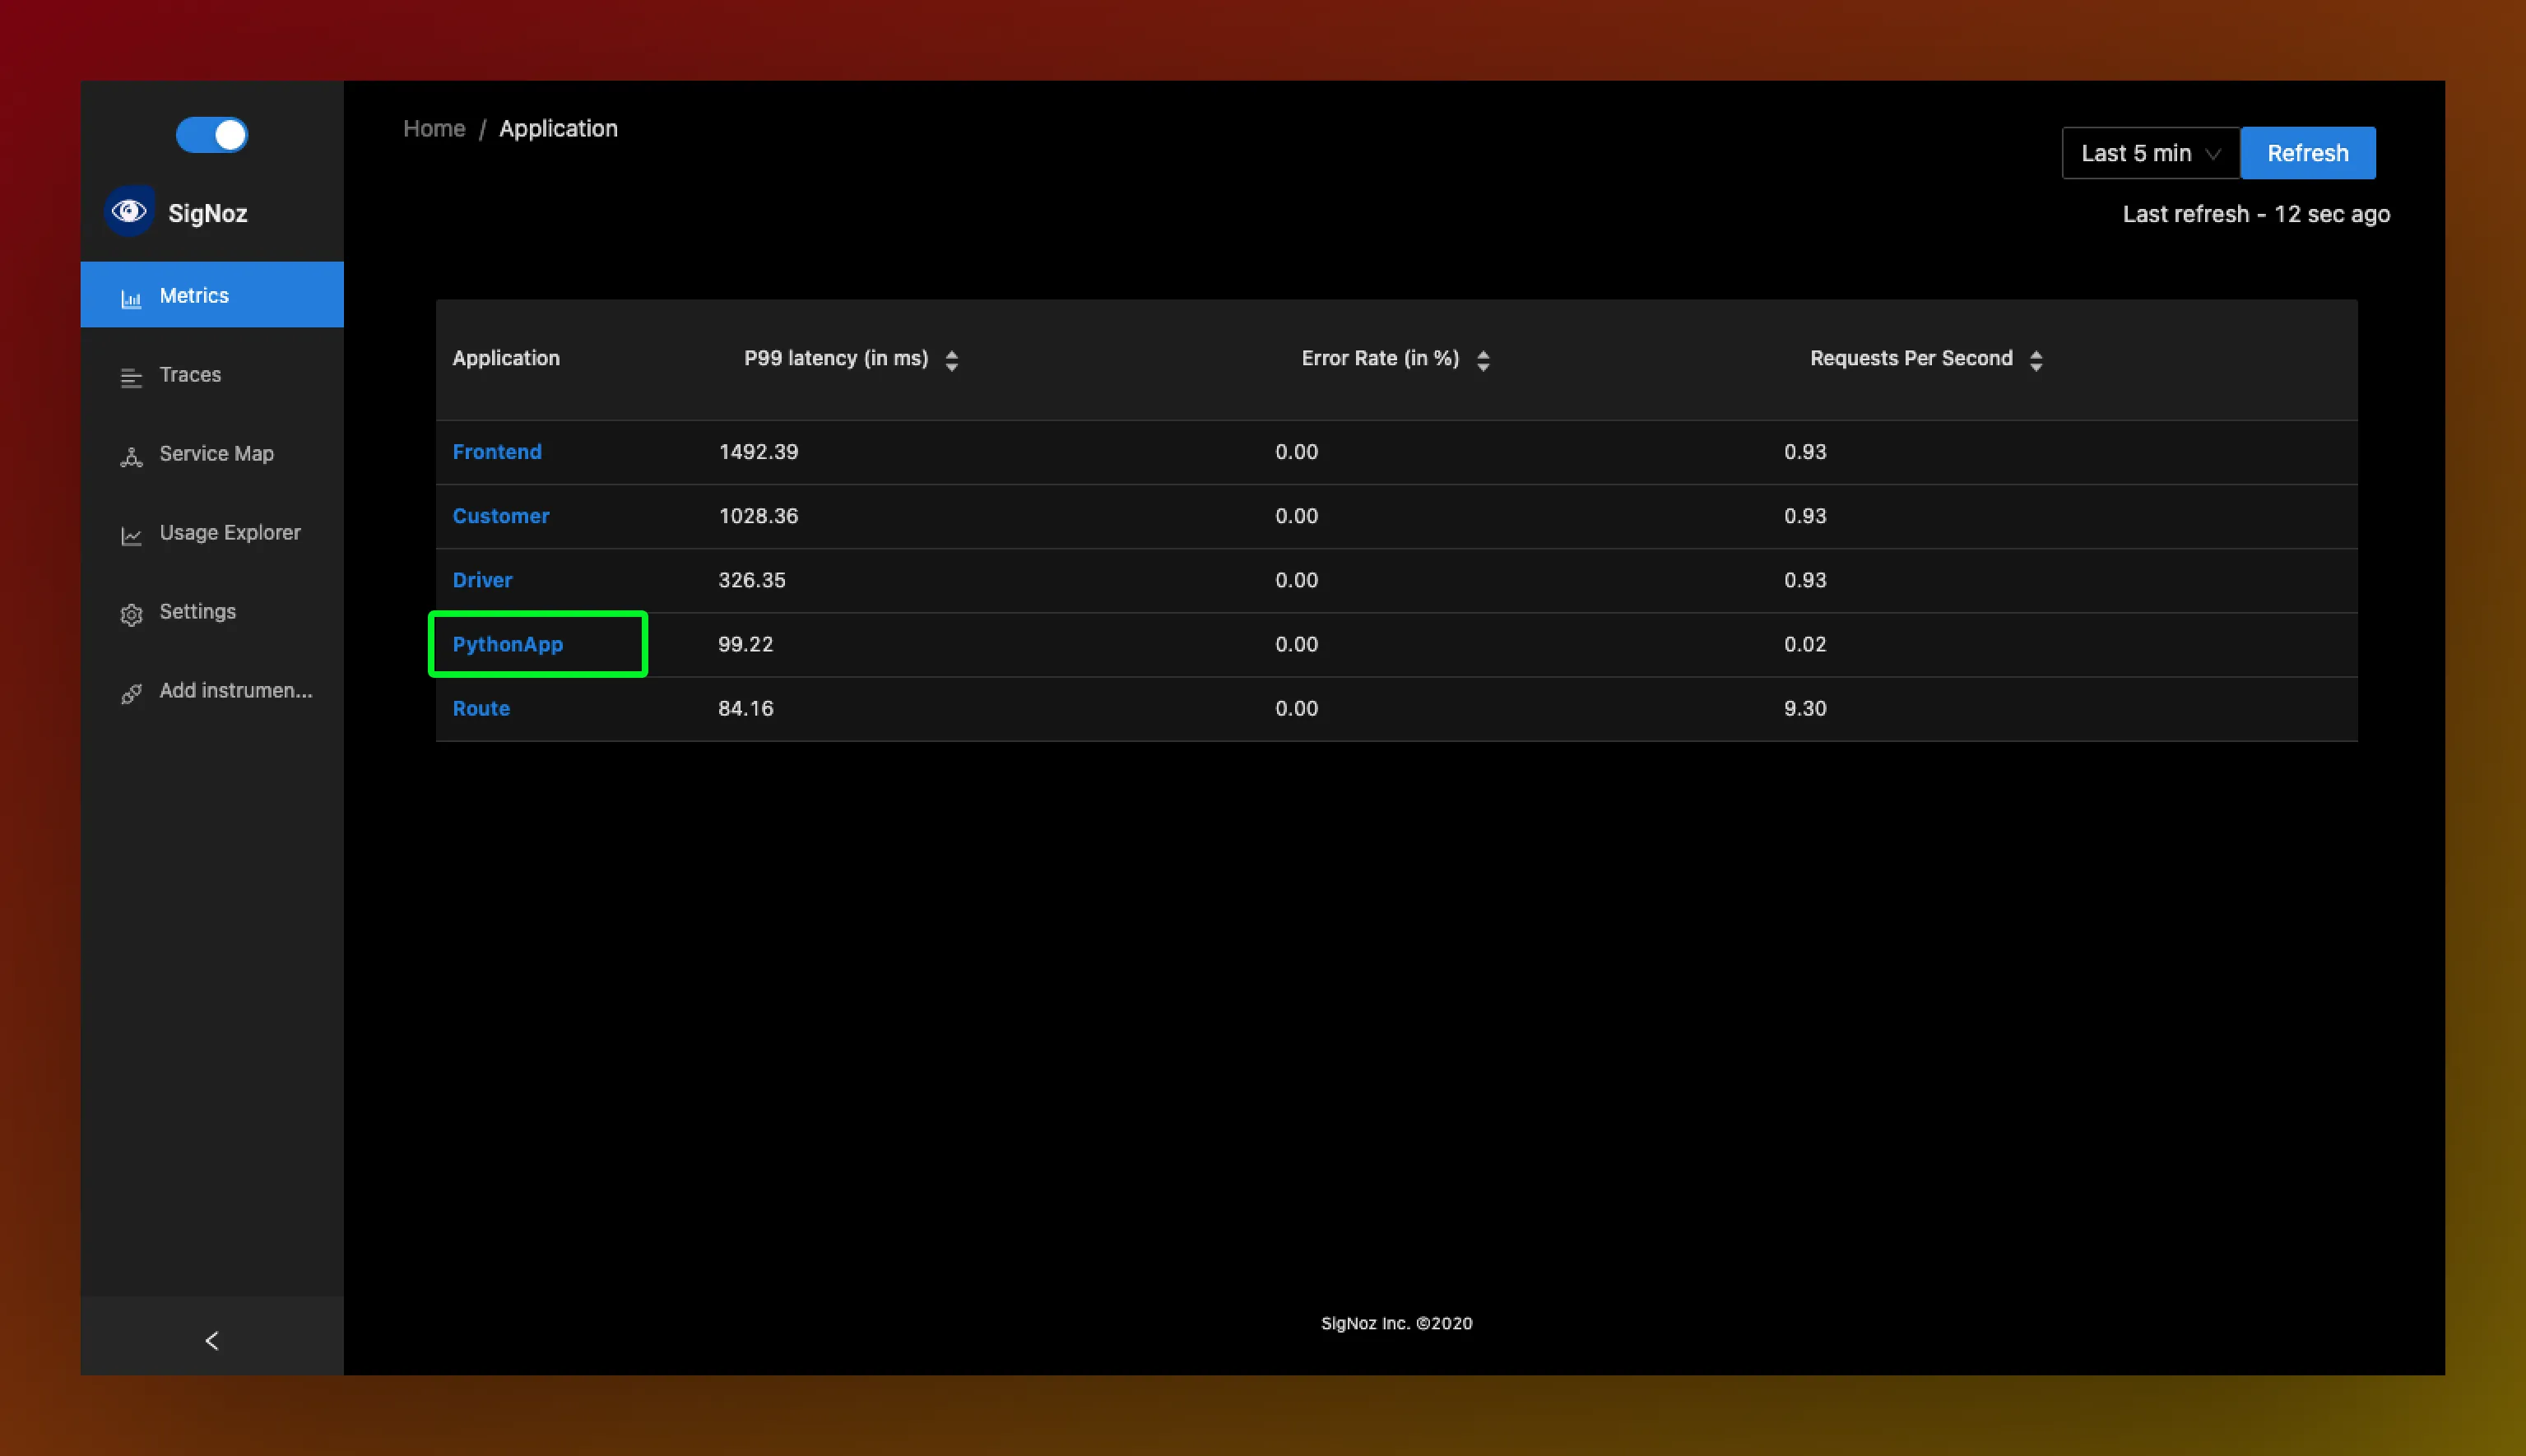
And, congratulations! You have instrumented your sample Python app. You can now access the SigNoz dashboard at http://localhost:3301 to monitor your app for performance metrics.
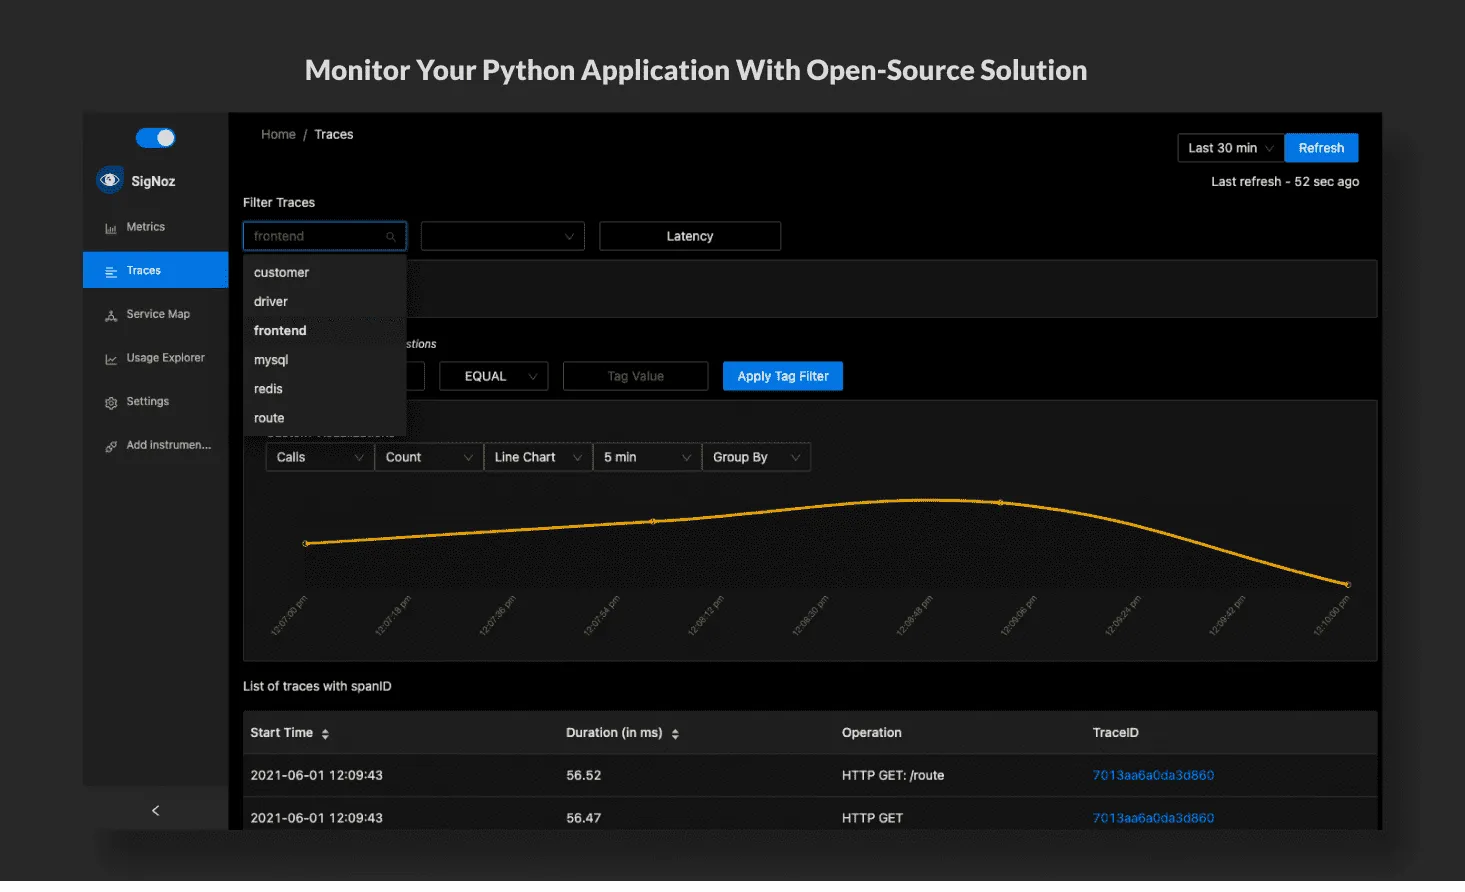
Finding Latency Issues in Your Python Application
Now that you have installed SigNoz, let's see how you can identify specific events causing high latency in your deployed applications.
In just 5 easy steps, our dashboard lets you drill down to events causing a delay in your deployed apps 👇
Step 1. Choose the service you want to inspect
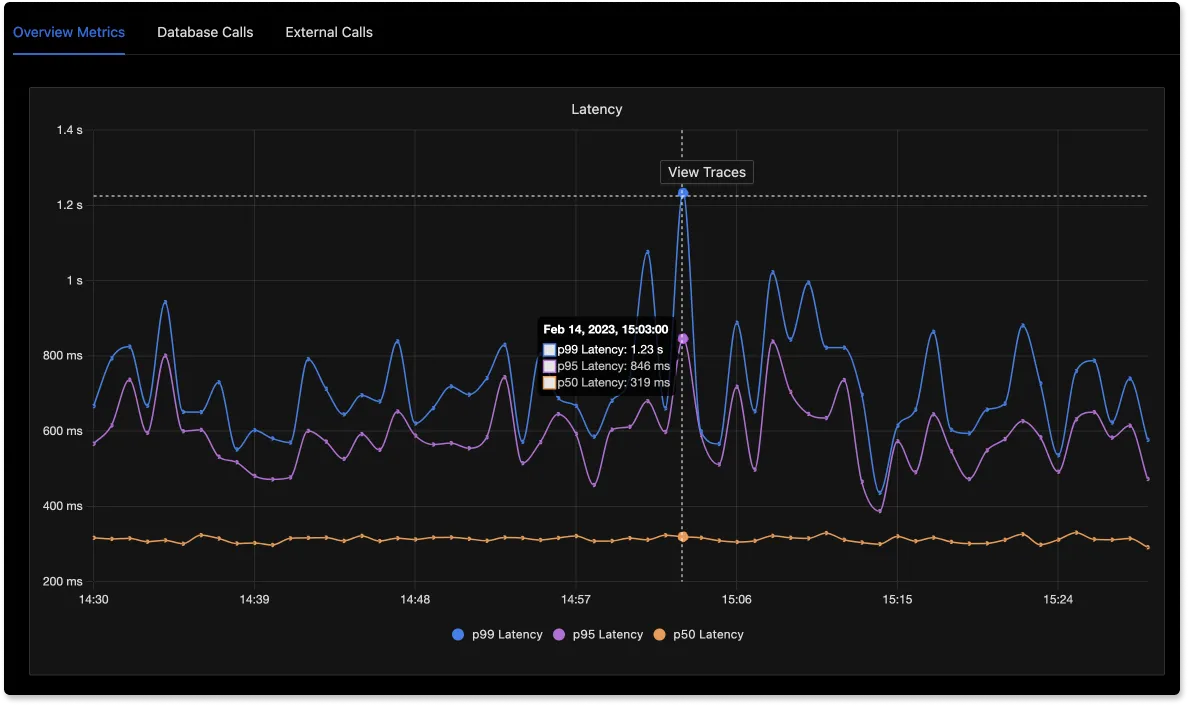
** Step 2. Choose the timestamp where latency is high and click on view traces**
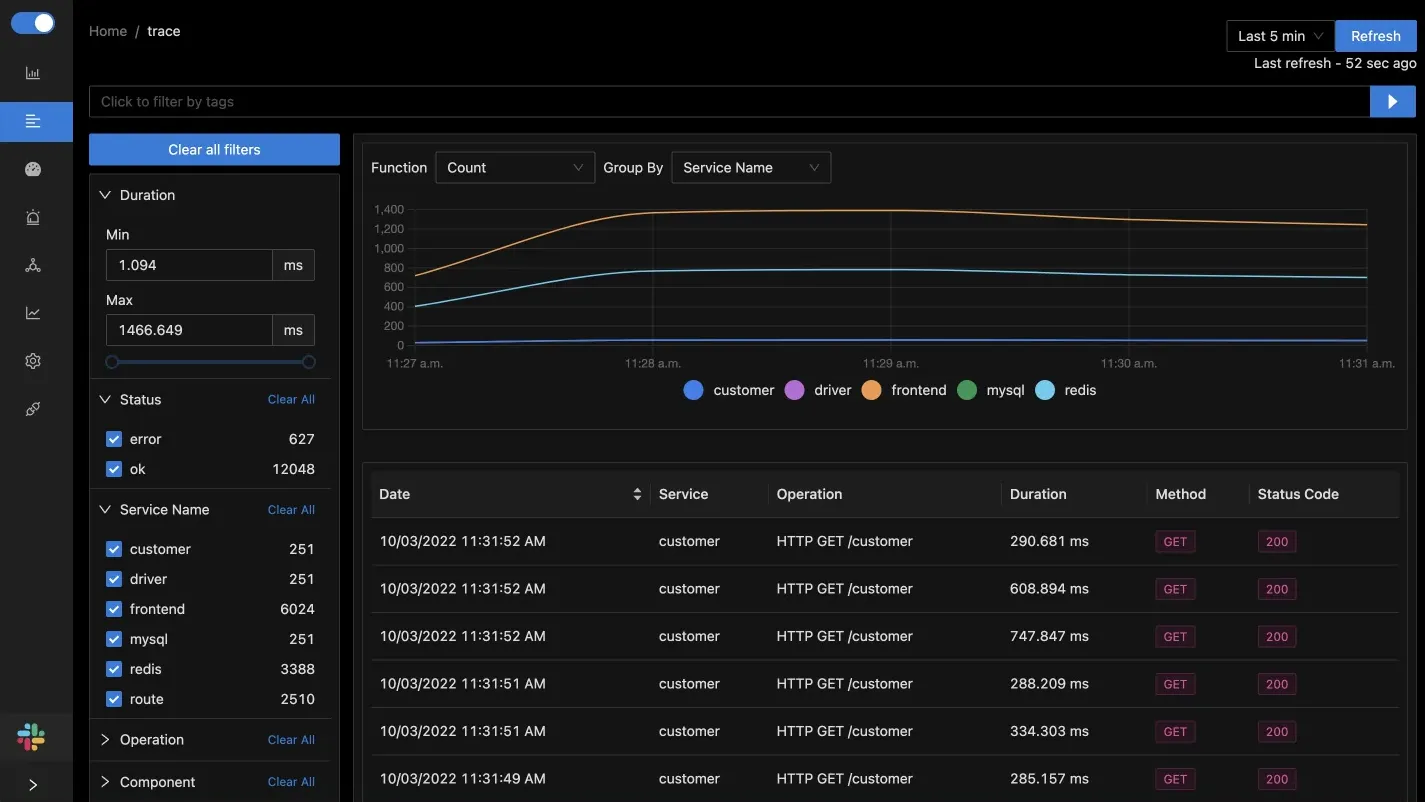
Step 3. Choose the trace ID with the highest latency
**Step 4. Inspect distributed traces with flamegraph
If you need any help with trying out SigNoz, feel free to mail me at ankit.anand@signoz.io.
Check out our documentation for more installation guides and troubleshooting instructions.
If you are someone who understands more from video, then you can watch the below video tutorial on the same with SigNoz.
They say, "If it's not monitored, then it's not in production." And with SigNoz you can start monitoring your applications now. Enabling your team to resolve issues quickly in production is critical to maintaining complex distributed systems in fine health.
At SigNoz, we are committed to making the best open-source, self-hosted tool for application performance monitoring. Feel free to check out our GitHub repo here 👇
