Getting Started with OpenTelemetry and Python
OpenTelemetry is a vendor-agnostic instrumentation library under CNCF — the organization hosting projects that are the backbone of modern-day cloud-native systems. Over the years, OTel (as OpenTelemetry is conveniently known) has been adopted widely by the developer community and is being used by organisations of all sizes.
Teams are increasingly using it to standardise telemetry (traces, metrics, and logs) data collection and management across languages, frameworks, and environments. In this practical guide, we’ll walk through everything you need to know to use OpenTelemetry in Python application — how it works, how to instrument Python applications, and how to send telemetry to an OpenTelemetry-compatible backend like SigNoz.
What is OpenTelemetry?
OpenTelemetry emerged as a single project after the merging of OpenCensus (from Google) and OpenTracing (from Uber) into a single project. It seeks to unify the fragmented observability ecosystem and provide users with a vendor-agnostic pipeline to any compatible observability platform. This would enable telemetry signals to become a built-in feature of cloud-native software applications.
OpenTelemetry supports all popular programming languages and has a vast number of Python libraries to integrate into your applications. Python features robust integration with OpenTelemetry because of its immense popularity and use in all industries. Let’s understand how OTel works in more detail.
How Does OpenTelemetry Instrumentation Work with Python?
Instrumentation means adding code to your application to make it emit telemetry data that any OpenTelemetry-compatible backend can process and visualize. You can instrument Python applications in two ways:
- Automatic instrumentation uses dedicated libraries to generate telemetry without requiring code changes, significantly reducing the effort required to instrument applications. However, some libraries do not work with auto-instrumentation, and they might not provide the required level of detail based on your needs.
- Manual instrumentation involves adding telemetry collection code directly to your codebase, enabling more control over the data being collected. This comes at the cost of requiring more developer effort compared to automatic instrumentation.
OpenTelemetry’s Building Blocks: Spans & Traces
A span represents a single unit of work executed by an observable application. A span could be anything, from a local function call, a database query, to a third-party API request to process a payment. A trace represents the entire journey of a request across all your application services, and is composed of multiple spans.
Since spans carry the ID of the traces they belong to, visualization platforms can logically group these spans, and sequentially order them. This concept, known as distributed tracing, ensures that operations across complex and distributed systems can be tracked, cross-referenced and viewed in one pane with ease.
Automatic instrumentation simplifies distributed tracing by injecting trace context into outbound requests, gRPC calls, and producer-consumer messages. You can read more about trace context propagation in this article. The following shows a requests HTTP call carrying the traceparent header:
{
    'User-Agent': 'python-requests/2.26.0',
    'Accept-Encoding': 'gzip, deflate',
    'Accept': '*/*',
    'Connection': 'keep-alive',
    'traceparent': '00-d66349998f87d62441140346b2a0b500-febf8549a13f975e-01'
}
OTel maintains specifications for all components, including the data emitted by instrumented applications. This helps ensure an efficient and reliable observability data pipeline between your instrumented application and the observability platform.
Now that you have established a fundamental understanding of OpenTelemetry, let’s set up the software required to instrument a Python application.
Implementing OpenTelemetry in Python
We’ll be using SigNoz as the observability backend of choice for receiving and visualizing Python application telemetry in a single pane.
Prerequisites for Application Instrumentation
There are the main prerequisites to getting started:
- A SigNoz Cloud Account
- Python 3.8 or later (Download the latest version here)
- A locally running MongoDB instance (find detailed instructions below)
Step 1: Setting Up SigNoz
As discussed previously, we will send the application’s emitted telemetry to SigNoz. SigNoz is an OpenTelemetry-native APM that is well-suited for visualizing OpenTelemetry data.
SigNoz Cloud is the easiest way to run SigNoz. Sign up for a free account and get 30 days of unlimited access to all features.

You can also install and self-host SigNoz yourself since it is open-source. With 24,000+ GitHub stars, open-source SigNoz is loved by developers. Find the instructions to self-host SigNoz.
Step 2: Installing MongoDB Locally
You can skip this step if you have already set up a MongoDB instance on your machine.
The easiest way to run MongoDB locally is to set it up using Docker. Run the following command to start MongoDB:
docker run --rm --name my-mongo -it -dp 27017:27017 mongo:latest
Alternatively, if you’d like to install it directly on your machine, you can find instructions based on your OS:
Step 3: Preparing the Sample Python Application
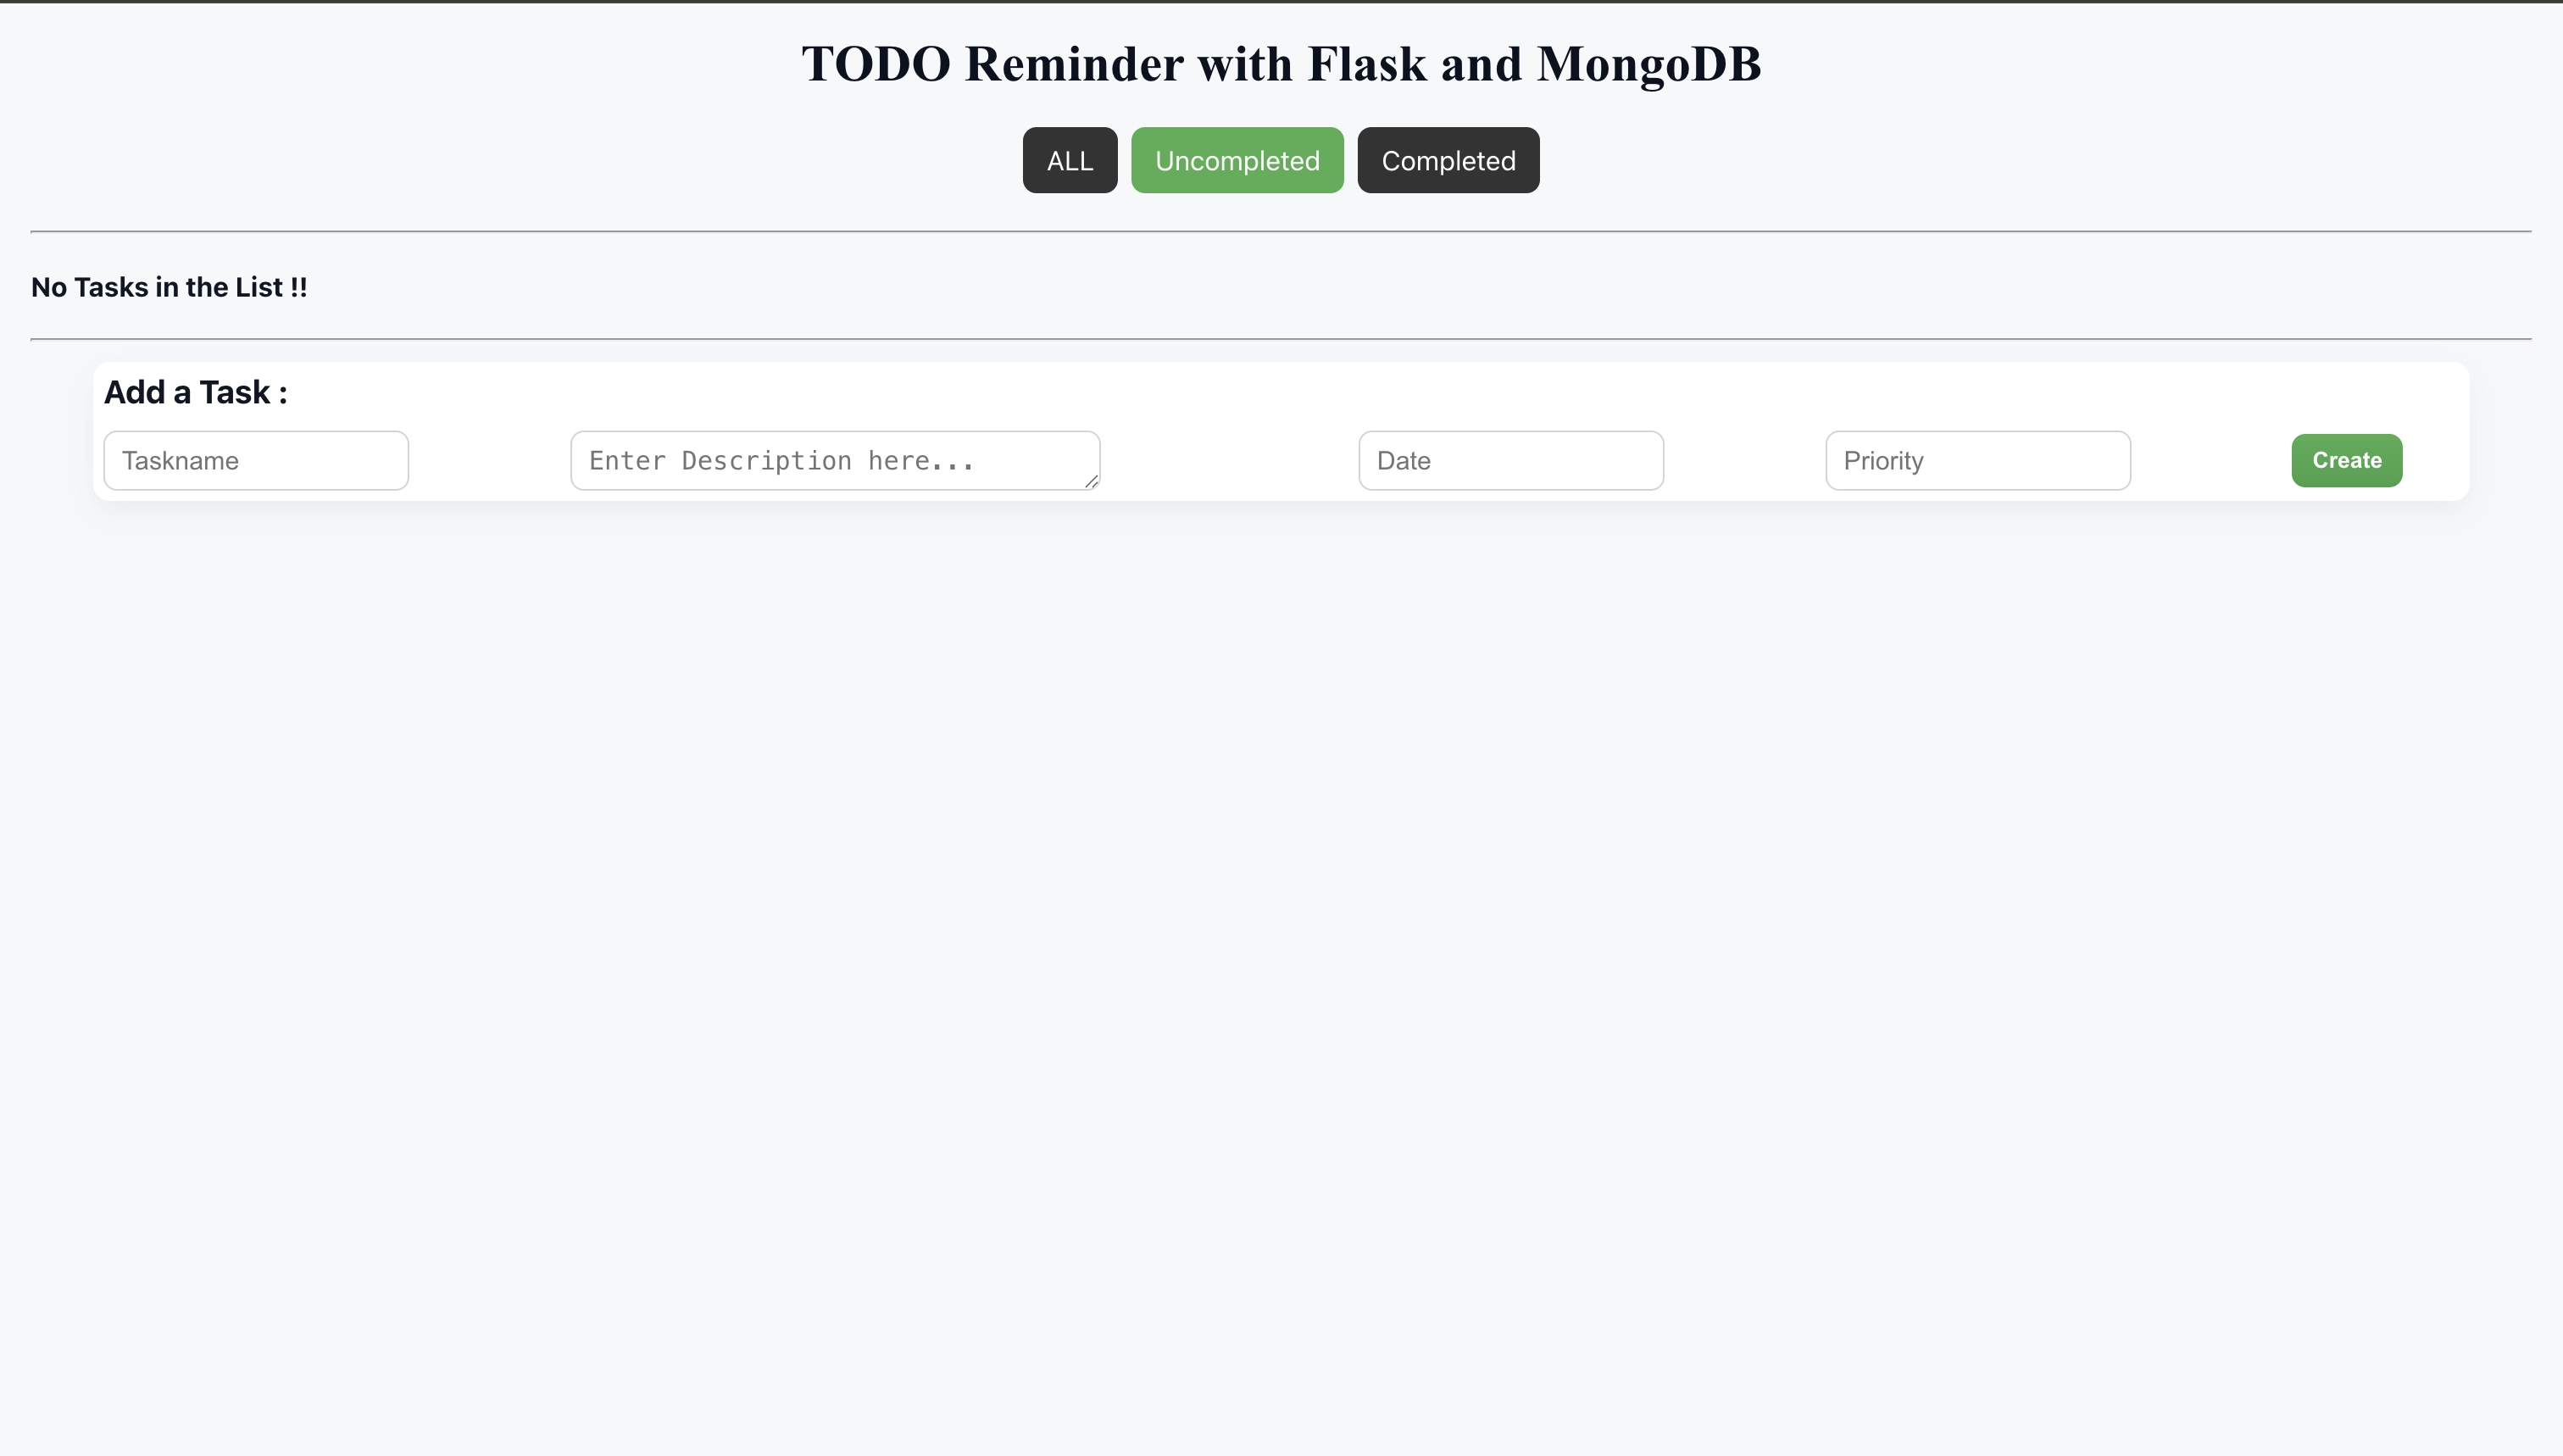
We have prepared a sample Flask application Github repository to get you up-and-running quickly. It is a CRUD TODO application to help you get familiar with OpenTelemetry concepts, and all required packages are part of the opentelemetry.txt file.
Access the code locally by running:
git clone https://github.com/SigNoz/sample-flask-app.git
cd sample-flask-app
Next, we will create and activate a Python virtual environment. Setting up virtual environments is a recommended practice to avoid dependency conflicts between different Python projects on your system.
# create a virtual environment with `.venv` folder name
python3 -m venv .venv
# activate the virtual environment
source .venv/bin/activate

# install all required dependencies
python -m pip install -r requirements.txt
If it hangs while installing the grpcio dependency for opentelemetry-exporter-otlp, follow below steps as suggested in this stackoverflow link.
pip3 install --upgrade pippython3 -m pip install --upgrade setuptoolspip3 install --no-cache-dir --force-reinstall -Iv grpcio
Verify whether the application is now accessible by running
python3 app.py
You will be greeted by the following UI upon visiting http://localhost:5002/. With this, we have completed the initial application setup.
Step 4: Instrumenting the Python Application
Now, we need to install the required OTel instrumentation libraries to generate telemetry from our application, and set up environment variables so SigNoz can capture and visualize this data.
Before proceeding, stop the application by pressing ctrl + c in your terminal window.
The opentelemetry-bootstrap command installs the corresponding instrumentation libraries for libraries present in the current environment.
opentelemetry-bootstrap --action=install
We’re almost done. In the last step, we just need to configure a few environment variables for the OTLP exporters. The run command will look like this:
OTEL_RESOURCE_ATTRIBUTES=service.name=sample-flask-app \
OTEL_EXPORTER_OTLP_ENDPOINT="https://ingest.{region}.signoz.cloud:443" \
OTEL_EXPORTER_OTLP_HEADERS="signoz-ingestion-key=<SIGNOZ-INGESTION-KEY>" \
OTEL_EXPORTER_OTLP_PROTOCOL=grpc \
opentelemetry-instrument python3 app.py
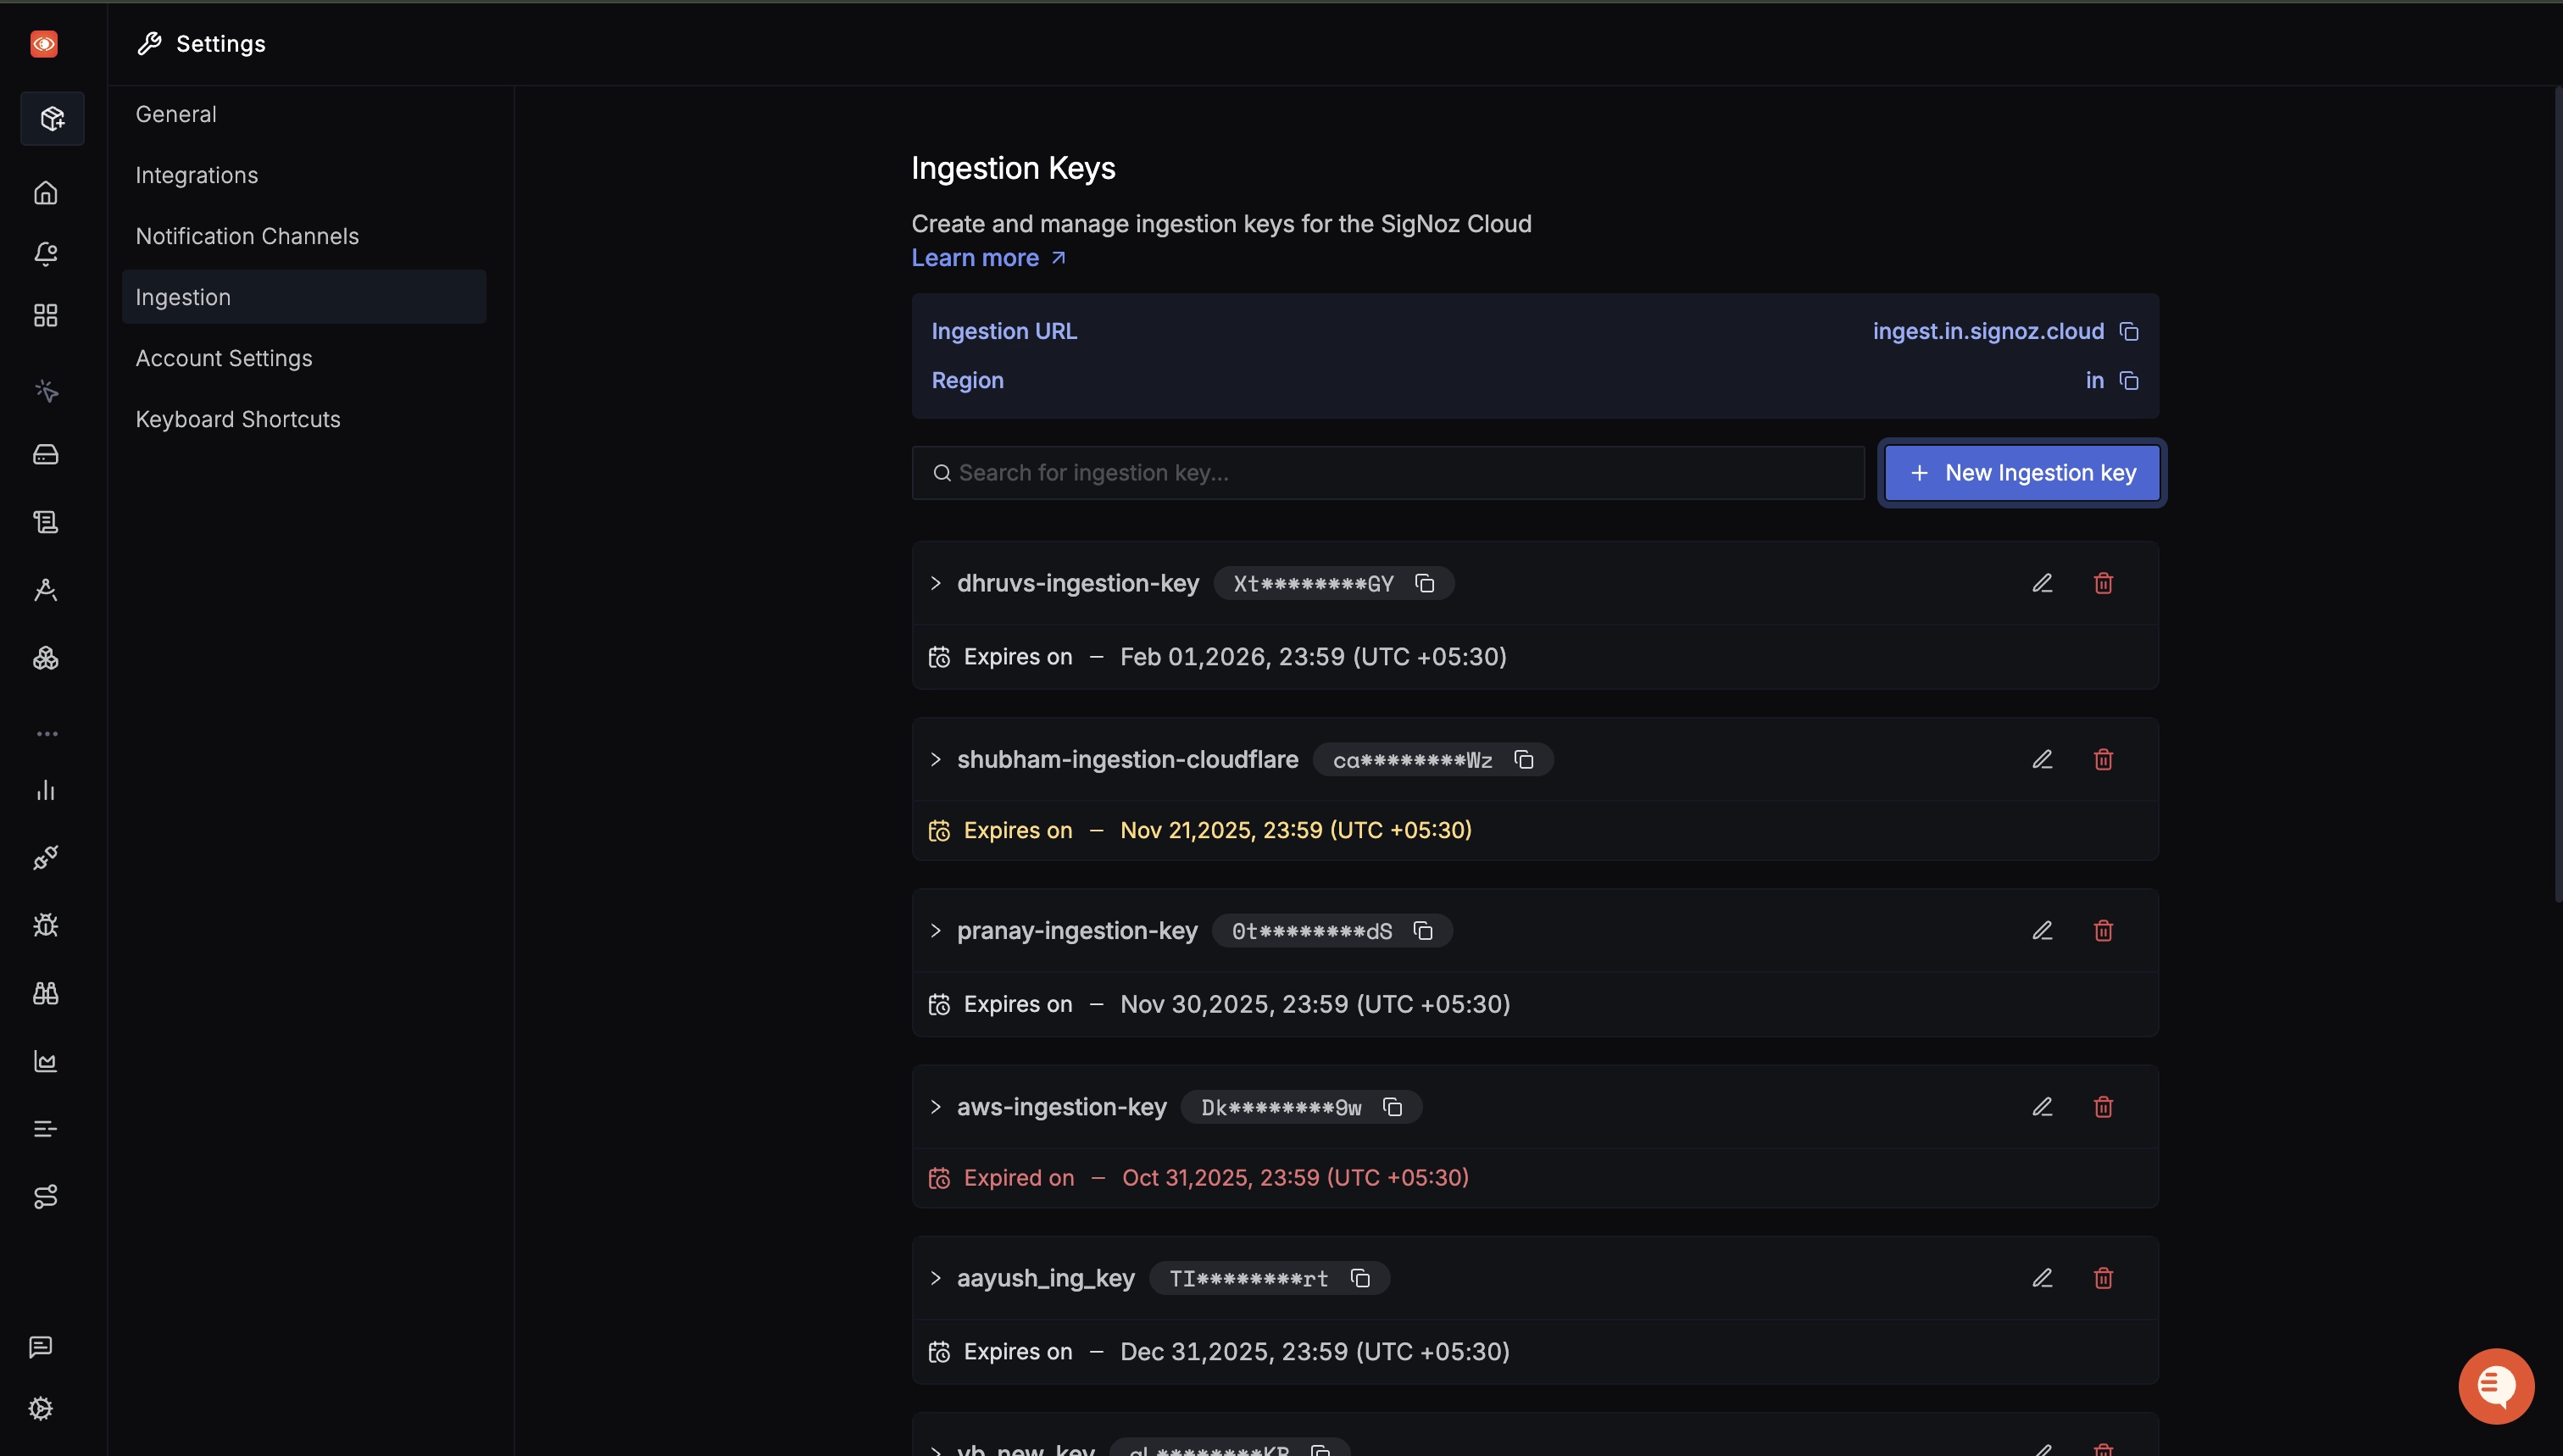
You can get SigNoz ingestion key and region from your SigNoz cloud account from Settings --> Ingestion.
After running the command, play around with the application at http://localhost:5002/ to generate telemetry data. You can add a few TODOs, mark them as completed, or delete them. Now open the Services from the side bar to see your application being observed, and SigNoz visualizing key metrics with pre-built monitoring dashboards.
Troubleshooting
The debug mode can break instrumentation from happening because it enables a reloader. To run instrumentation while the debug mode is enabled, set the use_reloader option to False:
if __name__ == "__main__":
    app.run(host='0.0.0.0', port=5002, debug=True, use_reloader=False)
If you face any problems in instrumenting with OpenTelemetry, refer these docs.
Going Further with Python and OpenTelemetry
Congratulations- you now have hands-on experience using OpenTelemetry in Python! As you continue exploring observability, the following resources will help you dive deeper into logs, frameworks and more advanced instrumentation techniques.
If you wish, you can also follow our guided, chapter-by-chapter path by going through our Python tutorial series.
Generating and Exporting Logs
You might have noticed that SigNoz dashboard doesn’t show any logs. There are two reasons for the same- first, our application doesn’t contain any logging statements, and even if we had, we need to manually instrument the logging library to export logs through OpenTelemetry.
We have a detailed guide that covers sending logs to OTel backend.
Capturing Custom Traces for Application-Specific Flows
Automatic instrumentation does not application-specific operations beyond web requests and details about core functionality like database queries.
Developers can use custom spans to track specific operations and add custom attributes to capture detailed context. The following code snippet shows an example with dynamic attribute values:
from random import choice
import time

from opentelemetry import trace

tracer = trace.get_tracer(__name__)


def validate_data(data: dict) -> bool:
	time.sleep(0.1)  # Simulate a delay in processing
	return choice([True, False])

with tracer.start_as_current_span("validate_data") as span:
    data = {"sample": "data"}

    span.set_attribute("data.length", len(data))
    is_valid = validate_data(data)
    span.set_attribute("data.validated", is_valid)
Implementing Custom Metrics
Custom metrics derive performance KPIs and measure business-specific health signals. Automatic instrumentation does not measure these values as they require deep insight into an application’s business context, and must be measured manually.
We have used a custom meter to monitor the number of active TODOs in our sample application. The relevant code snippet is as follows:
from flask import Flask
from opentelemetry.metrics import get_meter_provider

app = Flask(__name__)

# create global meter provider and up-down counter
meter = get_meter_provider().get_meter("sample-flask-app", "0.1.2")
todo_counter = meter.create_up_down_counter("todo_count")


@app.route("/action", methods=['POST'])
def action():
    #Adding a Task
    name=request.values.get("name")
    desc=request.values.get("desc")
    date=request.values.get("date")
    pr=request.values.get("pr")
    todos.insert({ "name":name, "desc":desc, "date":date, "pr":pr, "done":"no"})
    todo_counter.add(1) # increment the counter to signal new TODO
    return redirect("/")

@app.route("/remove")
def remove():
    #Deleting a Task with various references
    key=request.values.get("_id")
    todos.remove({"_id":ObjectId(key)})
    todo_counter.add(-1) # decrement the counter to signal deleted TODO
    return redirect("/")
You can find an overview of all metric types and their implementations here.
Instrumenting FastAPI and Django Applications
We used Flask for this demo because of its ease-of-use and familiarity within the Python developer community. We have a similar blog post covering instrumentation for Django, and an in-depth guide for FastAPI covering advanced techniques like sampling and data retention.
