Python Syslog | Configuring Syslog in Python using syslog and logging module
Syslog is an important messaging protocol in computing systems where it is used to send system logs or event messages to a specific server. In Python, you can either use the syslog module or the logging module to collect and send syslogs to a central server.
Logging is important to audit and debug your software. You can set logging to your running application to help monitor its behavior locally or system-wide. In this tutorial, we will learn how to configure logging to syslog in Python.
We will use two modules: syslog, a built-in Python library for system logging, and logging, a built-in Python library for logging in general. Logs are only helpful if analyzed properly to give actionable insights. In the last part of this tutorial, we will demonstrate how to send logs to SigNoz - ranked highly among open source log management tools.
A brief overview of what is syslog
Syslog is a standard for message logging. It helps isolate the messages in the software from the software functionality and the system that your software resides on. Each log message is sent via a facility code with a severity level.
A facility code indicates the type of system that is logging the message. Some examples of the type of system include the kernel, mail system, system daemon, and more.
A severity level describes how severe the message is sent from the system. Some examples of severity levels could be informational, critical, error, and more.
Typically, logs in Unix systems are stored in the/var/log directory. You can find the system logs inside this file /var/log/syslog.
Now let’s look into some simple syslog examples using the syslog python module.
Simple Syslog Examples using the syslog module
The simplest way to send log messages to the system using Python is through the built-in syslog module.
You can use a simple method syslog.syslog(priority, message) to send a message to the system logger. Let’s see that in action in the following example:
import syslog

syslog.syslog('Sending a log message through syslog_module!')
I named this file v01_00syslog.py. If you run this file through the terminal python v01_00syslog.py and then explore the content on the /var/log/syslog file using grep, you’ll see the following output:
$ cat /var/log/syslog | grep syslog_module
Nov 27 11:14:04 ezz v01_00syslog.py: Sending a log message through syslog_module!
So this is the log message indicating the date when it sent that message. It also indicates the user name that executed that file. Further, it logs the file name and the log message sent in the module.
Let’s see another example where we can add more complexity:
import syslog

syslog.syslog('Sending a log message through syslog_module_v1!')
def divide(dividend, divisor):
    try:
        syslog.syslog(syslog.LOG_INFO, f"Dividing {dividend} by {divisor}")
        return dividend / divisor
    except ZeroDivisionError:
        syslog.syslog(syslog.LOG_ERR, "Zero Division error.")

print(divide(6, 2))
print(divide(6, 0))
So in this example, we start logging with a different keyword (syslog_module_v1, the word we will search for in the system logs). Then we use a division function to return the result of dividing two numbers and make an exception if there is a division by zero.
The first syslog.syslog method usage assigns a priority option to the syslog.LOG_INFO to indicate that it’s an informational message. The second option is the message indicating a string of what numbers are divided.
The second syslog.syslog method uses another priority option which is syslog.LOG_ERR to indicate that it’s an error severity level. Similarly, the second option is the message.
And then, we print two results of the function, one that is working well with just the informational message and the other with both the informational and the zero division error.
Let’s run this script and then head over to the syslog with grep command. We will use the -A followed by 3 to print 3 lines after the matched line:
$ cat /var/log/syslog | grep -A 3 syslog_module_v1
Nov 27 11:27:01 ezz v01_01syslog_err.py: Sending a log message through syslog_module_v1!
Nov 27 11:27:02 ezz v01_01syslog_err.py: Dividing 6 by 2
Nov 27 11:27:02 ezz v01_01syslog_err.py: Dividing 6 by 0
Nov 27 11:27:02 ezz v01_01syslog_err.py: Zero Division error.
As you can see, the logs exist for each division case.
Sending Python logs through the logging module
Through the native Python module logging, you can also send system logs. It provides more customized ways to send logs than the syslog module we used, but it’s a bit more complicated.
Let’s break it down so that it’s easy for you to follow.
In the logging module, we will use the SysLogHandler. Let’s see how to use that handler to send system log messages:
import logging
from logging.handlers import SysLogHandler

logger = logging.getLogger(__name__)
logger.setLevel(logging.DEBUG)
handler = SysLogHandler(
    facility=SysLogHandler.LOG_DAEMON,
    address='/dev/log'
    )
logger.addHandler(handler)
logger.debug('Sending a log message through SysLogHandler!')
Comments on the snippet code:
- We first import the
loggingmodule and then importSysLogHandlerfrom thelogging.handlers. - The
loggerinstance is the logger object with the name of the file. - Setting the severity level is done through the
setLevelmethod. By default, it’s set to theINFOlevel, while we set it here asDEBUG. - The
handlerobject is theSysLogHandler, with the facility indicating to theLOG_DAEMONas the system that sends the logs. However, theaddressoption is assigned to/dev/log, which is the Unix domain socket used to send the messages to the syslog. - We then add that Syslog handler to the
loggerobject. - And finally, we send the message to syslog. In this case, we send a debugging message with the keyword SysLogHandler.
If you run this script and explore the syslog file, you’ll see the following output:
$ cat /var/log/syslog | grep SysLogHandler
Nov 27 11:51:49 ezz Sending a log message through SysLogHandler!
Let’s customize it more so that we log the filename with a customized time format and where the log appeared in the file:
import logging
from logging.handlers import SysLogHandler

def main():
    logger = logging.getLogger(__name__)
    logger.setLevel(logging.DEBUG)
    handler = SysLogHandler(
        facility=SysLogHandler.LOG_DAEMON,
        address='/dev/log'
        )

    formatter = logging.Formatter(
        fmt="%(asctime)s - %(filename)s:%(funcName)s:%(lineno)d %(levelname)s - '%(message)s'",
        datefmt="%Y-%m-%d %H:%M:%S"
        )
    handler.setFormatter(formatter)
    logger.addHandler(handler)

    logger.debug('Sending a log message through SysLogHandler_v1!')

if __name__ == '__main__':
    main()
Comments on the code:
- We have a function here that contains the logic.
- What’s new is the
formatterobject. In this code, we assign two options to this object:fmtto indicate the format string of the log. It contains the following:asctimeto format the event time to be human-readable.filenameto format the name of the file.funcNameto format the function name that has the log message.linenoto format the line number where the log is printed.levelnameto format the severity level of the log.messageto format the log message that we want to send.
datefmtto indicate how the date time should be represented. It contains the following:%Yto represent the year.%mto represent the month.%dto represent the day.%Hto represent the hours.%Mto represent the minutes.%Sto represent the seconds.
- Each attribute in the formatting string with a suffix of
sindicates that it’s a string. However, the attribute with a suffix ofdindicates that it’s a decimal number (e.g.lineno).
I named this file v02_01sysloghandler_formatter.py. If you run this script and then explore the syslog file, you’ll see the following:
$ cat /var/log/syslog | grep SysLogHandler_v1
Nov 27 11:57:35 ezz 2022-11-27 11:57:35 - v02_01sysloghandler_formatter.py:main:20 DEBUG - 'Sending a log message through SysLogHandler_v1!'
As you can see, the time format is added differently. Notice that it’s still prepended with a syslog time format which is defined in the syslog configuration. The new time format is followed by the filename and the name of the function, and the line number. Finally, the severity level is printed, followed by the log message.
Managing syslogs with SigNoz
In production environment logs need to collected in a central system. Effective log management and analysis can give developers insights to solve application issues faster. You can send your system logs to SigNoz - an open source log management tool.
SigNoz is a full-stack open source APM that you can use for log mangement. SigNoz uses a columnar database ClickHouse to store logs, which is very efficient at ingesting and storing logs data. Columnar databases like ClickHouse are very effective in storing log data and making it available for analysis.
In this section, we will see how to configure syslog to be sent to SigNoz. But before that, let’s install SigNoz.
Installing SigNoz
SigNoz may be installed in three simple steps on macOS or Linux PCs using a simple install script.
Docker Engine is installed automatically on Linux by the installation script. However, before running the setup script on macOS, you must manually install Docker Engine.
git clone -b main https://github.com/SigNoz/signoz.git
cd signoz/deploy/
./install.sh
You can visit the documentation for instructions on how to install SigNoz using Docker Swarm and Helm Charts.

Sending Syslogs to SigNoz
You can consult how to collect syslog logs on SigNoz here. For our sample application, let’s see how to send syslog to SigNoz.
Now, let's get our earlier Python script:
import logging
from logging.handlers import SysLogHandler

logger = logging.getLogger(__name__)
logger.setLevel(logging.DEBUG)
handler = SysLogHandler(
    facility=SysLogHandler.LOG_DAEMON,
    address='/dev/log'
    )
logger.addHandler(handler)
logger.debug('Sending a log message through SysLogHandler!')
And head over to the SigNoz dashboard after you run that script. If you're running it from your local host, go to http://localhost:3301/logs endpoint and search for a keyword like 'SysLogHandler'.
You can now see the log on the dashboard like the following:
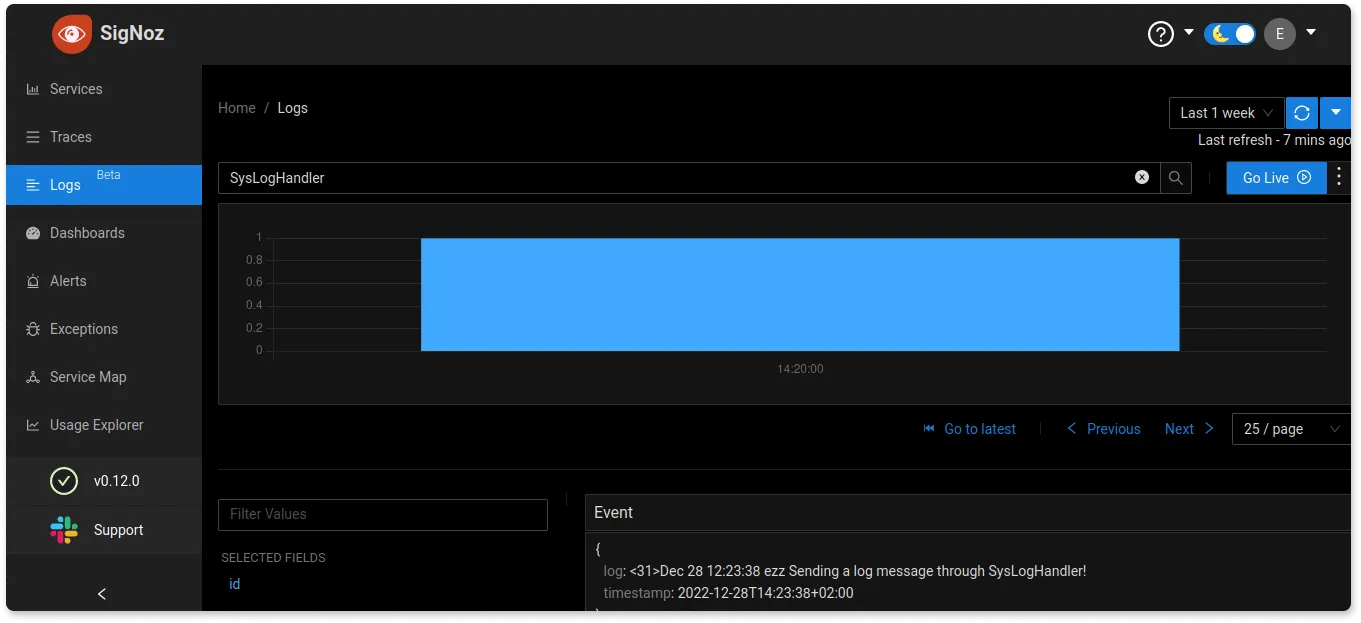
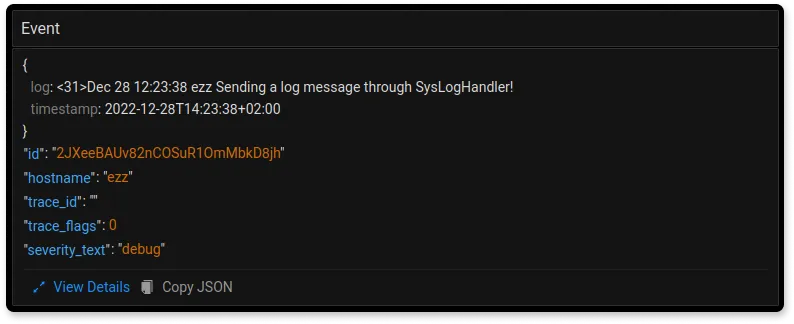
The logs are available with a breakdown showing the hostname of where the syslog is coming from and the severity of that log (in this case, it's a debug message):
If you want to access all the snippet codes we discussed, you can visit this GitHub repo.
Related Posts
