101 Guide to RabbitMQ Metrics Monitoring
This guide covers key metrics important for efficiently monitoring RabbitMQ. We will also talk about in-built RabbitMQ monitoring tools with which you can start monitoring your RabbitMQ instances.

In fast-paced, data-driven applications where our data flows between the systems at lightning speed - the reliability and efficiency of your messaging infrastructure can make or break your whole application. In this article, we will dive into the crucial realm of RabbitMQ monitoring, exploring why monitoring your message queue is not just a mere best practice but an absolute necessity to avoid unwanted failures. We will cover key metrics you should focus on and performance indicators that you should keep tabs on.
But before that, let’s have a brief overview of RabbitMQ.
What is RabbitMQ?
RabbitMQ is a message broker, which means it acts as an intermediary that takes in messages from one application and routes them to the correct destination application. RabbitMQ uses AMQP (Advanced Message Queuing Protocol), but it supports a number of protocols, including the most popular HTTP.
In layman's language, RabbitMQ is like a post office for computer programs. Just as a post office handles the sorting and delivery of physical mail, RabbitMQ handles the sending and receiving of messages between different applications.
In RabbitMQ, messages are stored in queues, which is FIFO (First In, First Out), just like a line of people waiting for their turn at a counter. The messages are placed in a queue and processed in the order they were received.
Developers use many different design patterns like Publisher-Subscriber, Point-to-Point, Topic-Based, and Publisher Confirms. Whichever your pattern is, RaabitMQ lets you monitor your traffic, queues, exchanges, resource usage, etc.
How does RabbitMQ work?
RabbitMQ ensures message reliability through features like acknowledgments, message persistence, and retries. It also supports various messaging patterns, including point-to-point and publish-subscribe, making it a versatile solution for decoupling components and enabling asynchronous communication.
Furthermore, RabbitMQ can scale horizontally to handle high volumes of messages and provides features like clustering for high availability and fault tolerance. It plays a crucial role in modern applications by enabling efficient, reliable, and flexible communication between components, both within and across systems.
Important RabbitMQ Terms
A node in RabbitMQ typically refers to an individual instance of a RabbitMQ message broker that runs on a single server or machine within a RabbitMQ cluster. Each RabbitMQ node is a self-contained installation of the RabbitMQ server software and functions independently.
Nodes within a RabbitMQ cluster work together to distribute and manage queues, exchanges, and messages. A RabbitMQ cluster can consist of multiple nodes, and each node in the cluster has a unique name or identifier.
Importance of RabbitMQ Monitoring
Imagine a fleet of delivery trucks crisscrossing a bustling city, carrying vital parcels from one location to another. Just as a delay or breakdown in this fleet can disrupt the entire supply chain, a hiccup in your message broker can disrupt the data flow in your distributed systems.
RabbitMQ is designed to be highly scalable, which means it can handle a large volume of messages. With the increase in messages, nearly 100% availability becomes necessary for the system. To ensure that, we need to monitor and analyze the behavior of our RabbitMQ instance.
Tutorial on how to monitor RabbitMQ with OpenTelemetry
In-Built Monitoring Tools
RabbitMQ comes with an in-built management monitoring tool that comes with a Web UI as well as an HTTP API to collect the metrics. To enable the management tool in your cluster, you just need to execute the following command.
CLI Command :
rabbitmq-plugins enable rabbitmq_management

It will enable the management dashboard on the path - http://SERVER-IP:15672
& API on the path - http://SERVER-IP:15672/api
curl -u {username}:{password} {hostname}:15672/api/overview
Although this monitoring tool provides info on many metrics, the RabbitMQ team doesn't recommend it for use in a high throughput production environment because of these shortcomings:
- It only stores recent data (think hours, not days or months). You have to implement your own logic to save the history of monitored metrics and implement data persistence.
- It may impact the performance of RabbitMQ as well because it tends to have some overhead on the node’s RAM footprint.
To overcome these shortcomings, you can use a centralized monitoring tool like SigNoz. You can create dashboards for monitoring your RabbitMQ clusters. SigNoz provides logs, metrics, and traces under a single pane of glass so that you can use it for full-stack application performance monitoring.
Key RabbitMQ Metrics to Monitor with In-Built Monitoring Tools
We can divide the key RabbitMQ metrics to monitor into four sections -
- Operational
- Latency and Reliability
- System Health
- Custom Metrics
Operational Metrics
Metrics you can measure include -
1. Queue Length
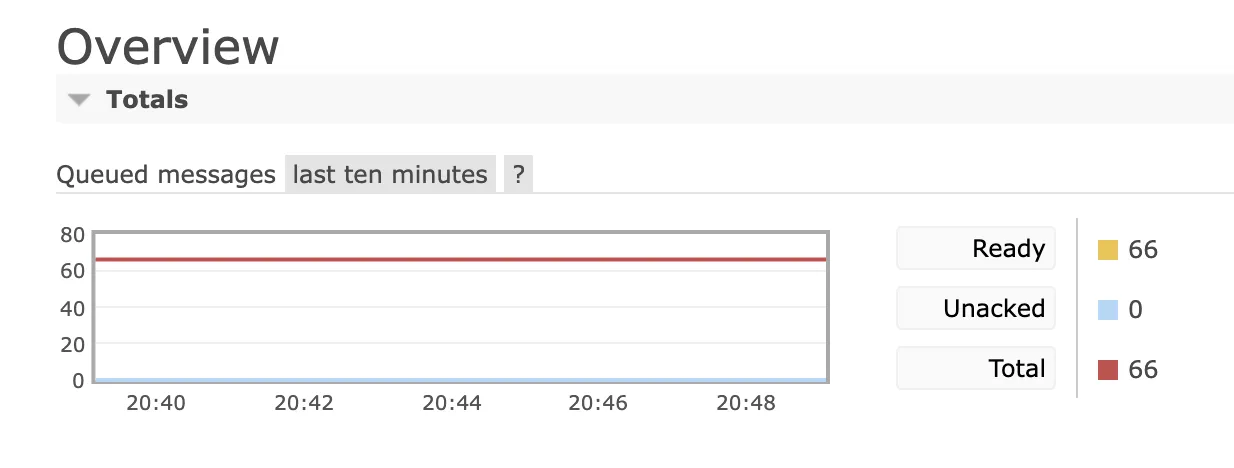
Queue length measures the number of messages waiting in a queue at any given time. High queue lengths can indicate backlogs. You can either access queue metrics in the web-based management interface, or you can build your own system through HTTP requests to endpoints like /api/queues to retrieve queue statistics, including message counts.

2. Node Resource Utilization
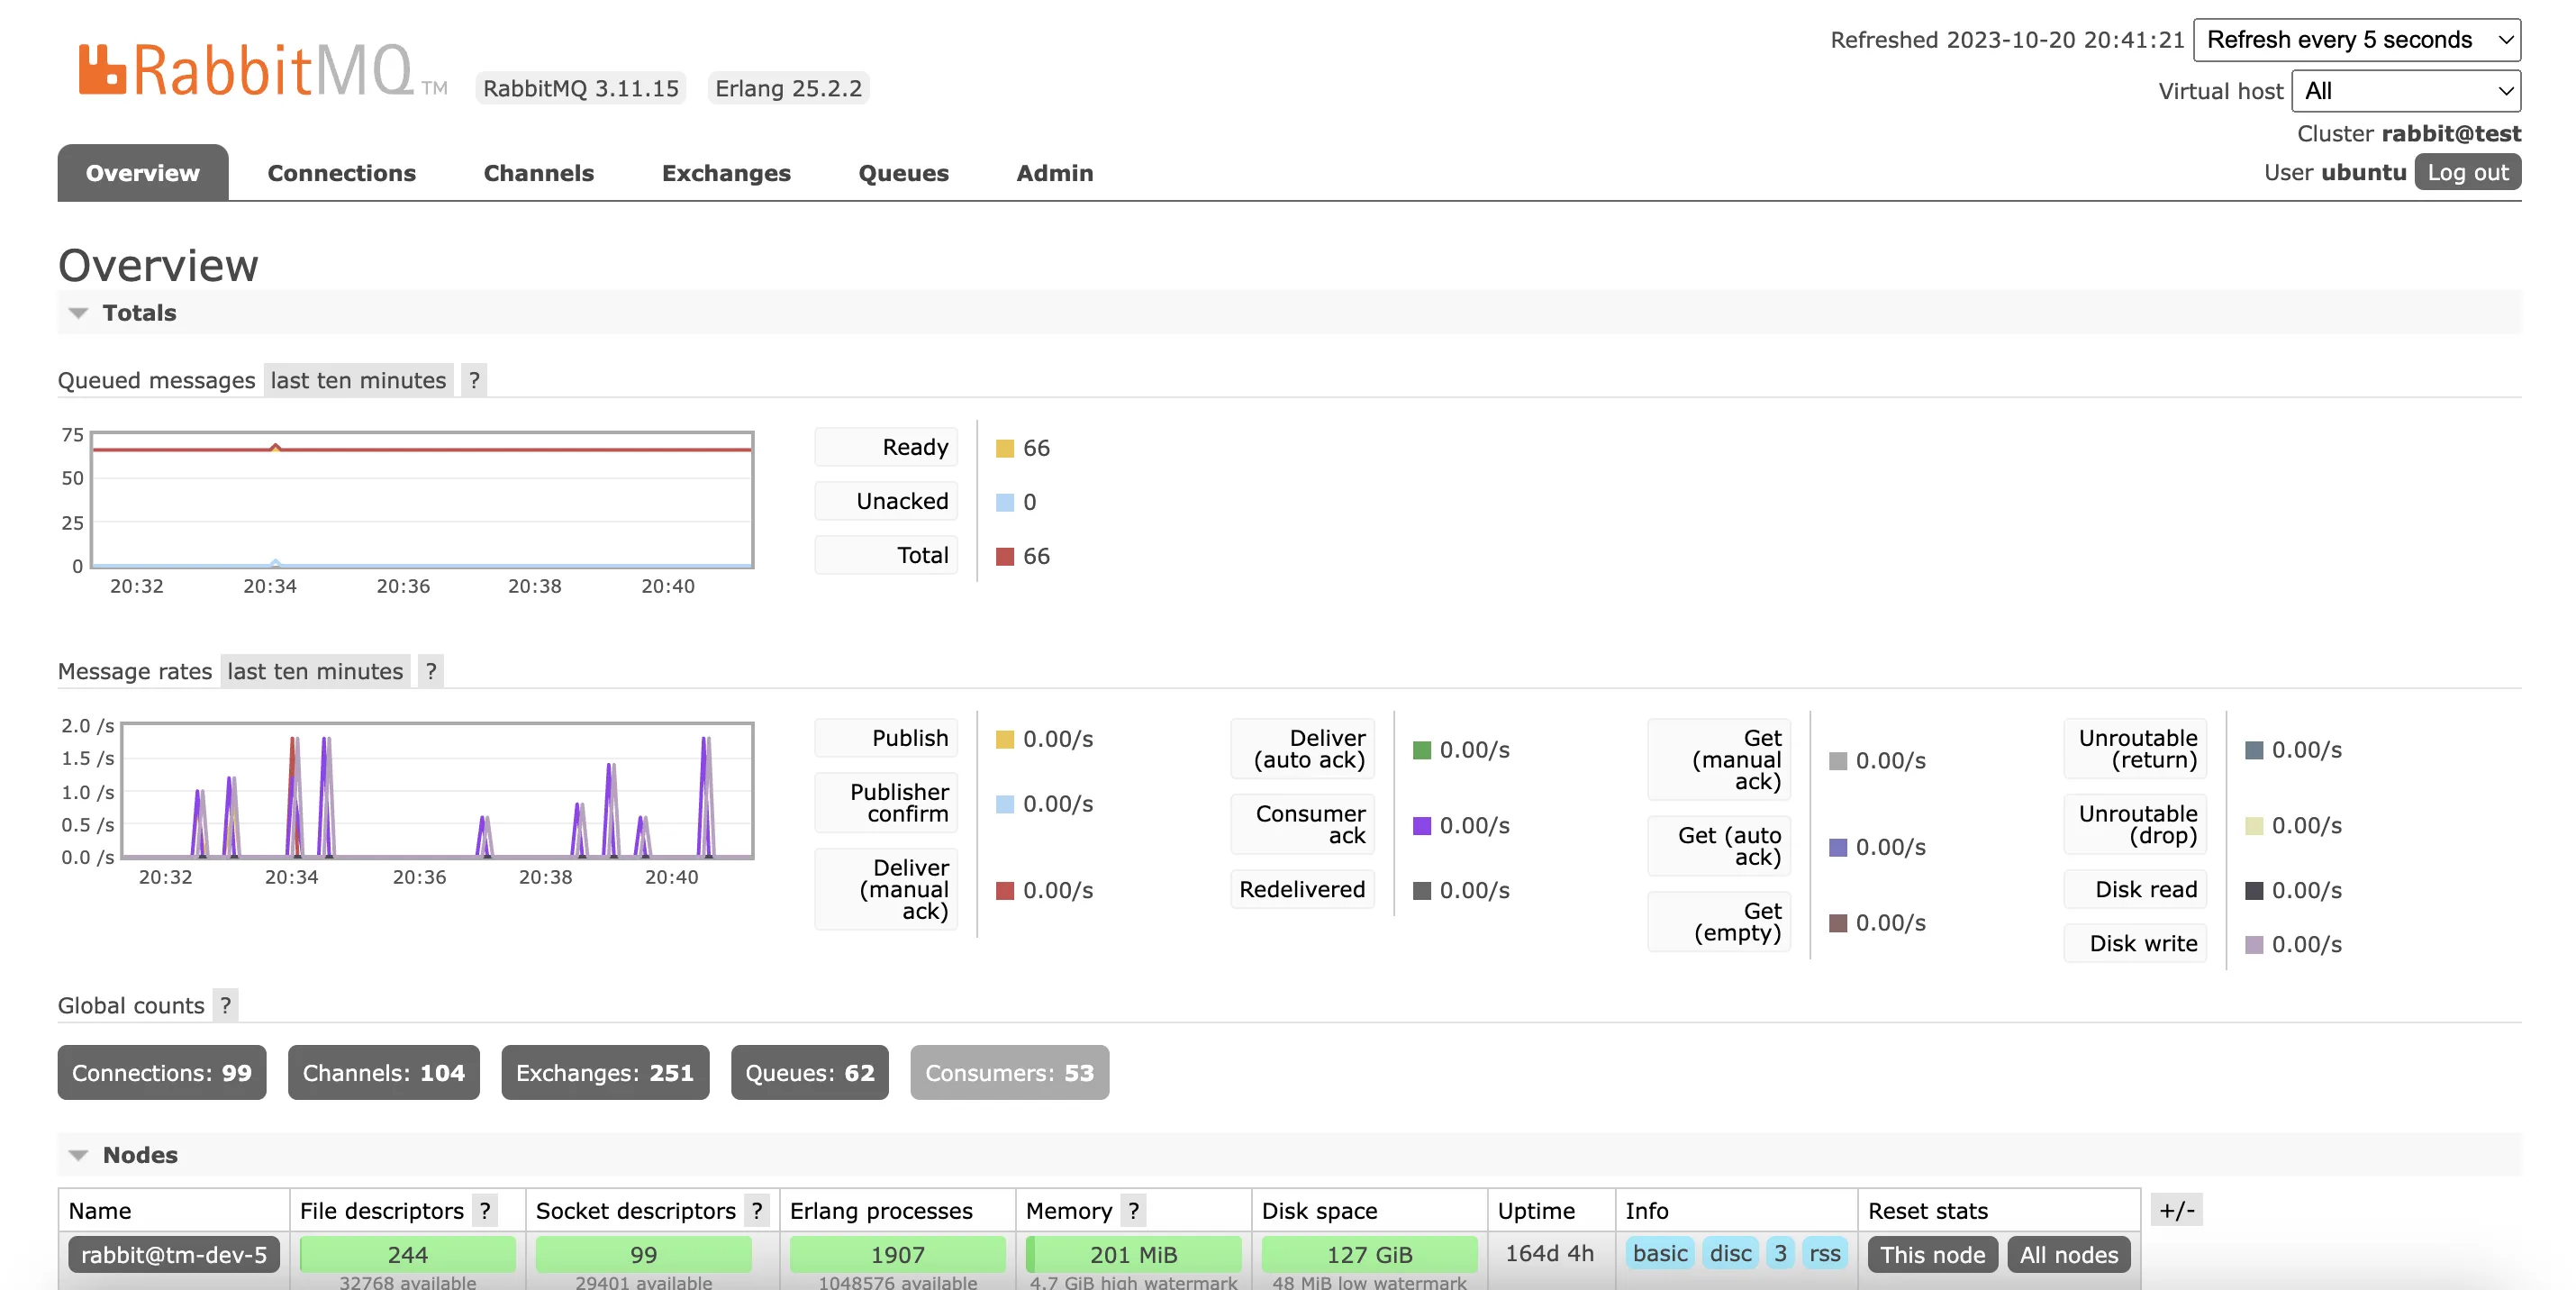
Monitoring CPU, memory, and disk usage on RabbitMQ nodes helps maintain their health and prevents resource exhaustion. You can either check the "Nodes" section in the web-based interface or programmatically through API /api/nodes.
This provides an overview of resource consumption. It includes params like File descriptors, Socket descriptors, Memory, Disk space, and Erlang processes with values such as used and max available.
RabbitMQ nodes consume varying amounts of memory and disk space, and resource usage can reach critical levels. If memory is exhausted, the operating system's "OOM killer" may terminate the node, while low disk space can impair internal operations.
To prevent these scenarios, RabbitMQ uses resource watermarks(refer to the screenshot attached) to block connections that publish messages when memory or disk space reaches critical thresholds. Connections that publish messages are blocked, preventing system instability, while connections that only consume messages remain unaffected.
This blocking state is visible within the built-in monitoring tools; however, the responsibility for configuring notifications regarding these blocked connections falls to the user.

3. Connection Metrics
These metrics track the state and activity of client connections, including
Open Rates - This metric tracks how quickly new connections are established with the RabbitMQ server. Monitoring this helps you detect sudden spikes in connection attempts, which could indicate increased traffic or potential issues with clients trying to connect.
Close Rates - An increase in connection closures can signal problems, such as excessive connection churn or disruptions in client-server interactions. This metric is essential for identifying any instability in the system.
Heartbeat Failures - Heartbeats are essential for maintaining the connection's health. Frequent heartbeat failures suggest communication problems between clients and the RabbitMQ server. Monitoring this metric is crucial for ensuring reliable connections.
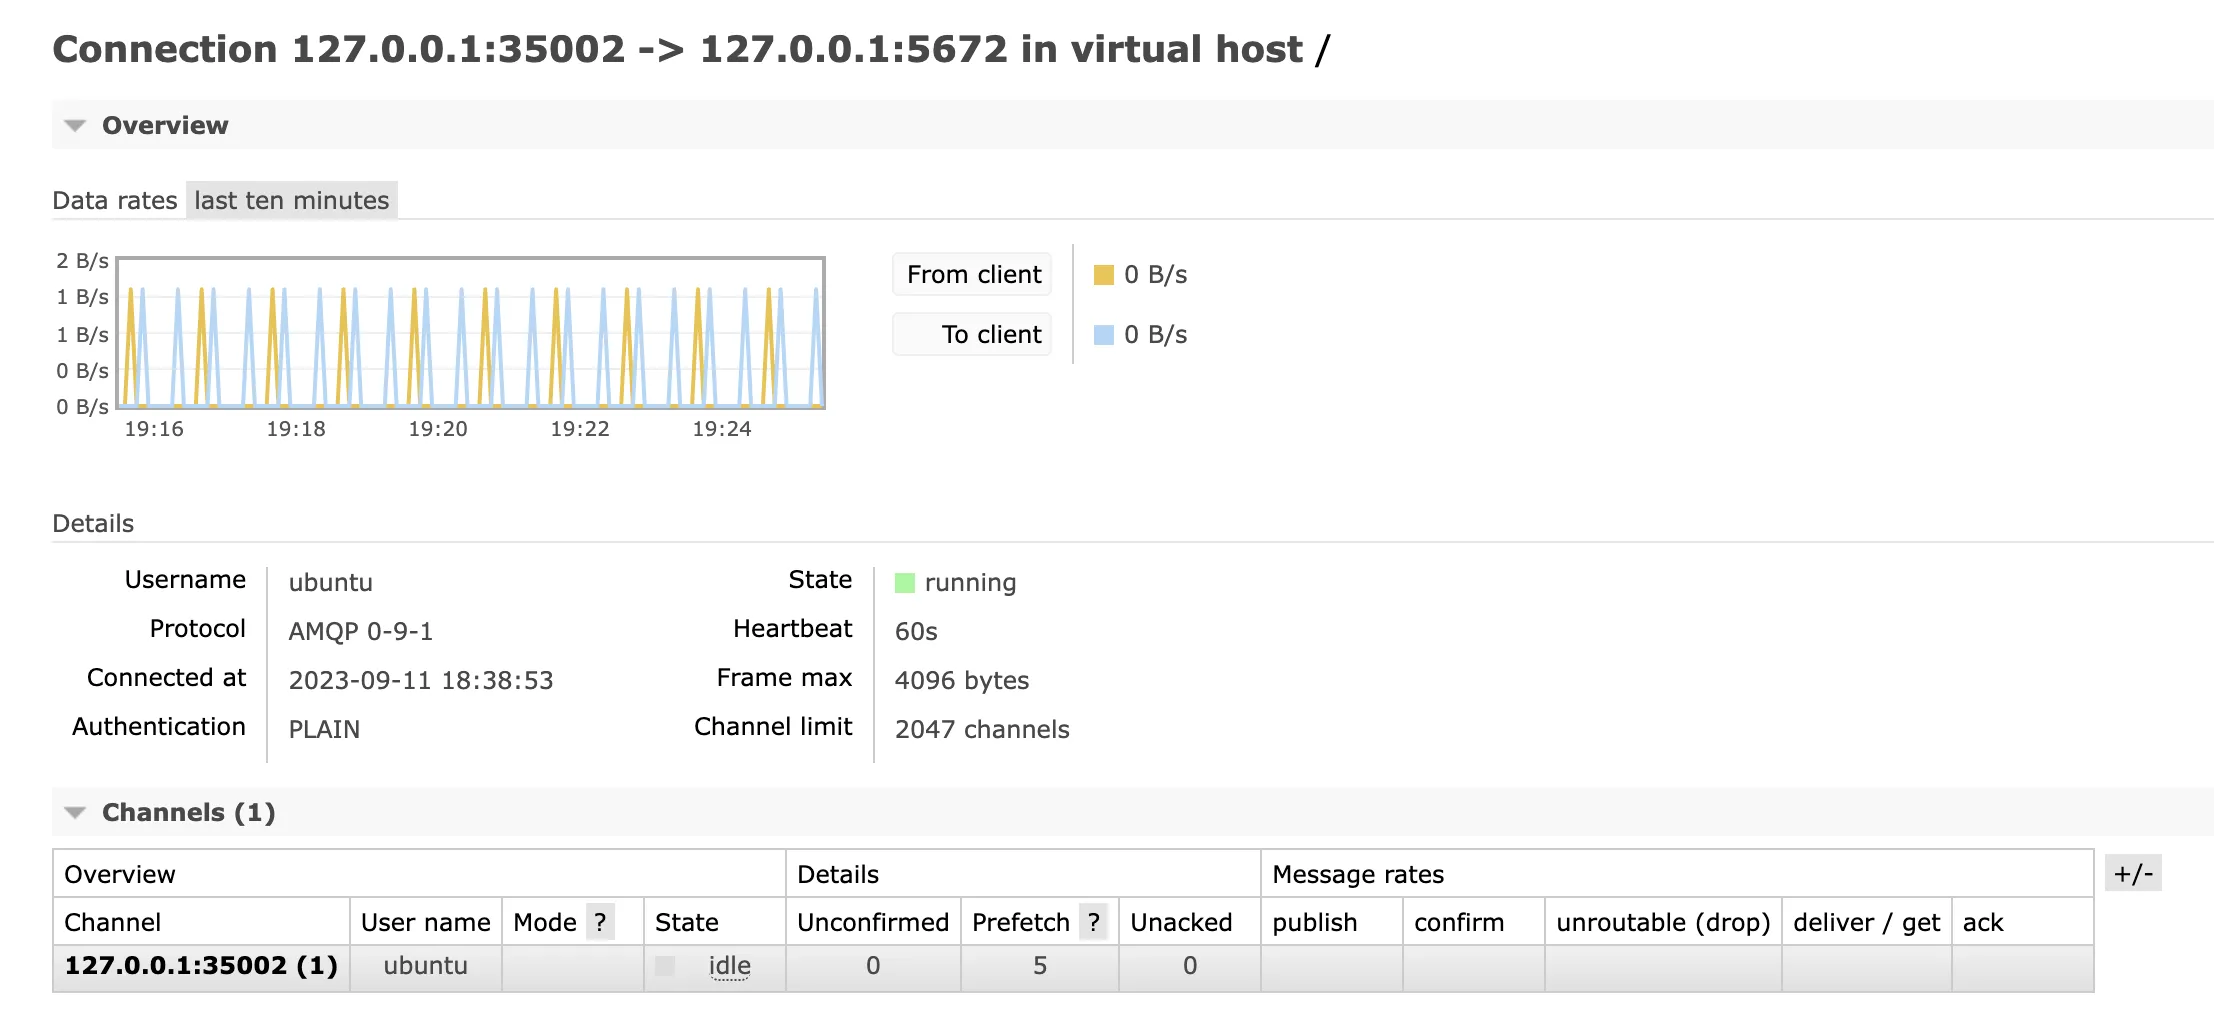
You can either check the "Connections" tab in the web-based interface or programmatically through API /api/connections.
API furnishes connection information, covering aspects like state, heartbeat, publish rate, subscription rate, and whatnot. However, it's the user's responsibility to establish alerting mechanisms for tracking rising connection numbers and identifying connection failures. A centralized monitoring tool like SigNoz can help you set up alerts on critical RabbitMQ metrics.

Latency and Reliability
1. Message Latency
Message latency, in simpler terms, gauges the time it actually takes for a message to make its journey from the producer, the one who sent it, to the consumer, the one meant to receive it.
To monitor message latency, you can set up custom metrics using native RabbitMQ tools. You will need to calculate message latency by comparing the time a message spends in the "Ready" state to its time in the "Unacknowledged" state. This helps you assess the efficiency of message processing in your RabbitMQ system.
Or with custom monitoring, you can create timestamp fields in your messages or use message properties and track the time it takes for messages to be consumed by consumers in your applications.
2. Queue Depth
Queue depth is essentially a measure of how many messages are currently piled up in a queue. This count includes all messages, whether they're ready to be processed or still awaiting acknowledgment.
RabbitMQ's native tools, such as the management plugin or Management API, allow you to view queue depths for all your queues. The "Queue" section of the web interface provides insights into individual queue depths, while the /api/queues endpoint in the Management API offers programmatic access.

3. Message Acknowledgment Times
Acknowledgment times represent how long it takes for messages to be acknowledged by consumers after being delivered. Utilize RabbitMQ's built-in management plugin or Management API to access message acknowledgment times.
Examine acknowledgment rates within the "Queue" section of the web-based management interface or the /api/queues endpoint through the Management API.

System Health
System health, in the context of RabbitMQ and messaging systems, refers to the overall well-being and reliability of the messaging infrastructure. A healthy system is one that operates efficiently, maintains high availability, and delivers messages reliably.
1. Efficient Resource Usage
In the world of a healthy messaging system, resources like CPU, memory, and disk space are utilized just right, not gobbled up or wasted. This keeps the system running smoothly and avoids slowdowns or breakdowns. You will get it in the deployed VMs with commands like:
$ htop
$ df -h
2. Fault Tolerance
In the world of computing systems, you can’t ensure that something bad will not happen. So you must prepare your systems to be prepared as much as you can.
Just imagine you're watching a gymnast perform incredible flips and somersaults on a balance beam. You're in awe of their skill and precision, but what's truly remarkable is their ability to recover when they stumble or make a minor mistake.
It can gracefully handle errors and mishaps without causing a complete breakdown. Replication, clustering, and backup servers are some of the ways to make your system fault-proof and avoid the doom’s day.
Custom Metrics
Apart from some standard monitoring and metrics, engineers use custom metrics centric to their use cases and safeguard their system where it really matters.
Message Traceability
In the world of software development and debugging, there are times when you need to keep a close eye on every message being published and delivered. RabbitMQ comes to the rescue with a feature called the firehose. It's like having a special channel where you can see everything that's going on.
Imagine this firehose as a tool in the hands of an administrator. They can switch it on for specific parts of the system, kind of like turning on a camera to record events. When it's on, you get notifications for every message - whether it's published or delivered. It's like a backstage pass to see what's happening behind the scenes.
Now, here's the catch: when this feature is off, it doesn't mess with the system's speed or performance. But, when it's on, you might notice things slowing down a bit. That's because it's working extra hard to make sure you get all those notifications. Think of it like turning on a high-speed camera; it might slow things down a tad, but you'll catch every detail.
Conclusion
In the fast-paced world of data-driven applications, the reliability and efficiency of your messaging infrastructure are mission-critical. This article has taken you on a journey through RabbitMQ monitoring, emphasizing why it's not just a "nice-to-have" but an absolute necessity to prevent any unwelcome surprises.
We've unraveled RabbitMQ's role as a message broker, explored its significance in keeping data flowing seamlessly, and peeked into the various design patterns it supports. Our deep dive into key metrics covered four important areas: operational, latency and reliability, system health, and custom metrics. Think of these metrics as your trusty allies in ensuring that your RabbitMQ-based systems operate flawlessly.
In a world where messages are the lifeblood of your distributed applications, RabbitMQ monitoring stands guard, offering insights into the pulse of your system. So, remember to keep a close watch on your message queues, harness the capabilities of RabbitMQ, and construct robust, efficient, and resilient data pipelines. Your applications will run smoothly, and your users will experience uninterrupted, hassle-free services.
But as mentioned earlier, in-built RabbitMQ monitoring tools have shortcomings. You can not retain the metrics, and it may impact the performance of your RabbitMQ cluster. For robust monitoring, you need a centralized monitoring tool like SigNoz.
Monitoring RabbitMQ with SigNoz
SigNoz is a full-stack application performance monitoring tool that can be used to monitor your RabbitMQ clusters. It is open-source and built to support OpenTelemetry natively. It provides metrics, logs, and traces under a single pane of glass. For RabbitMQ monitoring, you can build a customized dashboard and set up alerts on critical metrics.
Getting started with SigNoz
SigNoz Cloud is the easiest way to run SigNoz. Sign up for a free account and get 30 days of unlimited access to all features.
You can also install and self-host SigNoz yourself since it is open-source. With 24,000+ GitHub stars, open-source SigNoz is loved by developers. Find the instructions to self-host SigNoz.
Further Reading

