How To Monitor RabbitMQ Metrics With OpenTelemetry
RabbitMQ metrics monitoring is important to ensure that RabbitMQ is performing as expected and to identify and resolve problems quickly. In this tutorial, you will install OpenTelemetry Collector to collect RabbitMQ metrics and then send the collected data to SigNoz for monitoring and visualization.

In this tutorial, we cover:
- A Brief Overview of RabbitMQ
- A Brief Overview of OpenTelemetry
- What is OpenTelemetry Collector?
- How does OpenTelemetry Collector collect data?
- RabbitMQ Metrics and attributes that you can collect with OpenTelemetry
- Prerequisites
- Setting up SigNoz
- Setting Up OpenTelemetry Collector
- Monitoring with SigNoz Dashboard
- Conclusion
A Brief Overview of RabbitMQ
RabbitMQ is a critical component of many modern architectures. It is used to decouple applications and provide reliable messaging between them. In this article, we’ve discussed in detail how RabbitMQ is monitored using the built-in tools. We recommend checking out that article to get a hold of the basics of RabbitMQ monitoring, why it is so important, and how to do basic monitoring using built-in tools.
In a nutshell, RabbitMQ is a message broker. It acts as an intermediary between applications that send messages and applications that receive messages. It ensures that messages are delivered reliably and efficiently.
A Brief Overview of OpenTelemetry
OpenTelemetry is a set of APIs, SDKs, libraries, and integrations aiming to standardize the generation, collection, and management of telemetry data(logs, metrics, and traces). It is backed by the Cloud Native Computing Foundation and is the leading open-source project in the observability domain.
The data you collect with OpenTelemetry is vendor-agnostic and can be exported in many formats. Telemetry data has become critical in observing the state of distributed systems. With microservices and polyglot architectures, there was a need to have a global standard. OpenTelemetry aims to fill that space and is doing a great job at it thus far.
In this tutorial, you will use OpenTelemetry Collector to collect RabbitMQ metrics.
What is OpenTelemetry Collector?
OpenTelemetry Collector is a stand-alone service provided by OpenTelemetry. It can be used as a telemetry-processing system with a lot of flexible configurations to collect and manage telemetry data.
It can understand different data formats and send it to different backends, making it a versatile tool for building observability solutions.
Read our complete guide on OpenTelemetry Collector
How does OpenTelemetry Collector collect data?
A receiver is how data gets into the OpenTelemetry Collector. Receivers are configured via YAML under the top-level receivers tag. There must be at least one enabled receiver for a configuration to be considered valid.
Here’s an example of an otlp receiver:
receivers:
  otlp:
    protocols:
      grpc:
      http:
An OTLP receiver can receive data via gRPC or HTTP using the OTLP format. There are advanced configurations that you can enable via the YAML file.
Here’s a sample configuration for an otlp receiver.
receivers:
  otlp:
    protocols:
      http:
        endpoint: "localhost:4318"
        cors:
          allowed_origins:
            - http://test.com
            # Origins can have wildcards with *, use * by itself to match any origin.
            - https://*.example.com
          allowed_headers:
            - Example-Header
          max_age: 7200
You can find more details on advanced configurations here.
After configuring a receiver, you must enable it. Receivers are enabled via pipelines within the service section. A pipeline consists of a set of receivers, processors, and exporters.
The following is an example pipeline configuration:
service:
  pipelines:
    metrics:
      receivers: [otlp, prometheus]
      exporters: [otlp, prometheus]
    traces:
      receivers: [otlp, jaeger]
      processors: [batch]
      exporters: [otlp, zipkin]
Now that you understand how OpenTelemetry collector collects data let’s see what RabbitMQ metrics can be collected.
RabbitMQ Metrics and attributes that you can collect with OpenTelemetry
The following metrics and resource attributes for RabbitMQ can be collected by Opentelemetry Collector.
Metrics
Collectors provide many metrics that you can use to monitor how your RabbitMQ server is performing. Currently, all metrics types are ‘Sum’ with value type ‘Integer,’ which essentially means it comes in the cumulative sum instead of the raw data of each message separately.
| Metric | Description | Metric Name |
|---|---|---|
| Consumer Count | The number of consumers currently reading from the queue. | rabbitmq.consumer.count |
| Messages Published | The number of messages published to a queue. | rabbitmq.message.published |
| Messages Delivered | The number of messages delivered to consumers. | rabbitmq.message.delivered |
| Messages Dropped | The number of messages dropped as unroutable. | rabbitmq.message.dropped |
| Messages Acknowledged | The number of messages acknowledged by consumers. | rabbitmq.message.acknowledged |
| Messages Current | The total number of messages currently in the queue. | rabbitmq.message.current |
You can find the list of supported metrics here.
Resource Attributes
Resource attributes help you identify and filter RabbitMQ metrics based on a particular node, queue, etc.
These resource attributes are enabled by default:
| Name | Description | Values | Enabled |
|---|---|---|---|
| rabbitmq.node.name | The name of the RabbitMQ node. | Any Str | true |
| rabbitmq.queue.name | The name of the RabbitMQ queue. | Any Str | true |
| rabbitmq.vhost.name | The name of the RabbitMQ vHost. | Any Str | true |
Now, let’s go through the steps for collecting these metrics with OpenTelemetry.
Prerequisites
This tutorial assumes that the OpenTelemetry Collector is installed on the same host as the RabbitMQ instance.
Preparing RabbitMQ Servers for OpenTelemetry
Before you can install and run OpenTelemetry Collector on your RabbitMQ servers, you need to prepare them by performing the following steps:
Step 1: Enable management plugin
The OpenTelemetry Collector communicates with the RabbitMQ management plugin to collect telemetry data. To enable the management plugin, you can use the following command:
rabbitmq-plugins enable rabbitmq_management
Step 2: Add a user for monitoring
The OpenTelemetry Collector needs to have permission to access the RabbitMQ management plugin. You can create a dedicated user for OpenTelemetry and grant it the necessary permissions based on your requirements. To create a user for OpenTelemetry, you can use the RabbitMQ management UI at *_http://_{node-hostname}\*:15672/.**
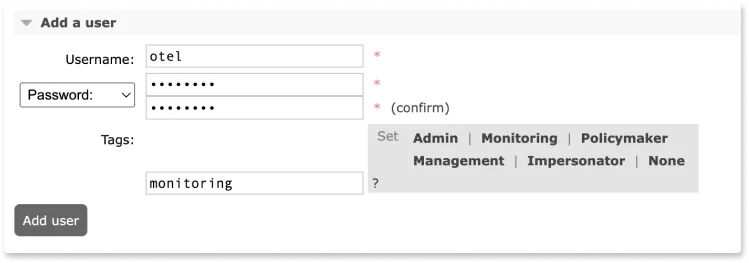
You will need to add this user in the configuration file of the OpenTelemetry collector later.
If RabbitMQ is not on the same server as OpenTelemetry Collector
If RabbitMQ is not on the same server as OpenTelemetry Collector, then you should do an extra step to open port 15672.
It is strongly advised not to open this port to the public. You can open it for specific IPs or private cloud only.
Open TCP port 15672
This step is needed if your RabbitMQ and OpenTelemetry service are not on the same server. The OpenTelemetry SDK for RabbitMQ communicates with the RabbitMQ management plugin over TCP port 15672. Therefore, you need to open this port on all of the RabbitMQ nodes in your cluster.
To open TCP port 15672 on a Linux server, you can use the following command:
sudo ufw allow 15672/tc
If you are using some firewall for your VMs to block inbound traffic there, you would need to allow 15672 port.
Once you have completed these preparations, you can install and run the OpenTelemetry Collector.
Setting up SigNoz
You need a backend to which you can send the collected data for monitoring and visualization. SigNoz is an OpenTelemetry-native APM that is well-suited for visualizing OpenTelemetry data.
SigNoz cloud is the easiest way to run SigNoz. You can sign up here for a free account and get 30 days of unlimited access to all features.
You can also install and self-host SigNoz yourself. Check out the docs for installing self-host SigNoz.
Setting Up OpenTelemetry Collector
The OpenTelemetry Collector offers various deployment options to suit different environments and preferences. It can be deployed using Docker, Kubernetes, Nomad, or directly on Linux systems. You can find all the installation options here.
We are going to discuss the manual installation here and resolve any hiccups that come in the way.
Step 1 - Downloading OpenTelemetry Collector
Download the appropriate binary package for your Linux or macOS distribution from the OpenTelemetry Collector releases page. We are using the latest version available at the time of writing this tutorial.
For MACOS (arm64):
curl --proto '=https' --tlsv1.2 -fOL https://github.com/open-telemetry/opentelemetry-collector-releases/releases/download/v0.116.0/otelcol-contrib_0.116.0_darwin_arm64.tar.gz
Step 2 - Extracting the package
Create a new directory named otelcol-contrib and then extract the contents of the otelcol-contrib_0.116.0_darwin_arm64.tar.gz archive into this newly created directory with the following command:
mkdir otelcol-contrib && tar xvzf otelcol-contrib_0.116.0_darwin_arm64.tar.gz -C otelcol-contrib
Step 3 - Setting up the Configuration file
Create a config.yaml file in the otelcol-contrib folder. This configuration file will enable the collector to connect with RabbitMQ and have other settings like at what frequency you want to monitor the instance.
Go into the directory:
cd otelcol-contrib
Create config.yaml in folder otelcol-contrib with the below content in it.
receivers:
  otlp:
    protocols:
      grpc:
        endpoint: localhost:4317
      http:
        endpoint: localhost:4318
  hostmetrics:
    collection_interval: 30s
    scrapers:
      cpu: {}
      disk: {}
      load: {}
      filesystem: {}
      memory: {}
      network: {}
      paging: {}
      process:
        mute_process_name_error: true
        mute_process_exe_error: true
        mute_process_io_error: true
      processes: {}
  rabbitmq:
    endpoint: http://localhost:15672
    username: <RABBITMQ_USERNAME>
    password: <RABBITMQ_PASSWORD>
    collection_interval: 30s
processors:
  batch:
    send_batch_size: 1000
    timeout: 10s
  # Ref: https://github.com/open-telemetry/opentelemetry-collector-contrib/blob/main/processor/resourcedetectionprocessor/README.md
  resourcedetection:
    detectors: [env, system, ec2] # include ec2 for AWS, gcp for GCP and azure for Azure.
    # Using OTEL_RESOURCE_ATTRIBUTES envvar, env detector adds custom labels.
    timeout: 2s
    override: false
    system:
      hostname_sources: [os] # alternatively, use [dns,os] for setting FQDN as host.name and os as fallback
exporters:
  otlp:
    endpoint: "ingest.{region}.signoz.cloud:443" # replace {region} with your region
    tls:
      insecure: false
    headers:
      "signoz-ingestion-key": "<SIGNOZ_INGESTION_KEY>"
  debug:
    verbosity: detailed
service:
  telemetry:
    metrics:
      address: localhost:8888
  pipelines:
    metrics:
      receivers: [otlp, rabbitmq]
      processors: [batch]
      exporters: [otlp]
    metrics/hostmetrics:
      receivers: [hostmetrics]
      processors: [resourcedetection, batch]
      exporters: [otlp]
You would need to replace the following details for the config to work properly:
- Endpoint for your RabbitMQ instance. For this tutorial: endpoint: http://localhost:15672
- Details of username that can be used for monitoring. (set in prerequisites section) username:
<RABBITMQ_USERNAME>password:<RABBITMQ_PASSWORD> - Under exporters, configure the
endpointfor SigNoz cloud along with the ingestion key undersignoz-ingestion-key. You can find these settings in the SigNoz dashboard.
Also note how we have set up the pipeline in the service section of the config. We have added rabbitmq in the receiver section of metrics and set the exporter to otlp.
Step 4 - Running the collector service
Every Collector release includes an otelcol executable that you can run. Since we’re done with configurations, we can now run the collector service with the following command.
From the otelcol-contrib, run the following command:
./otelcol-contrib --config ./config.yaml
If you want to run it in the background -
./otelcol-contrib --config ./config.yaml &> otelcol-output.log & echo "$\!" > otel-pid
Step 5 - Debugging the output
If you want to see the output of the logs, we’ve just set up for the background process. You may look it up with:
tail -f -n 50 otelcol-output.log
tail 50 will give the last 50 lines from the file otelcol-output.log
You can stop the collector service with the following command:
kill "$(< otel-pid)"
Monitoring with SigNoz Dashboard
Once the above setup is done, you will be able to access the metrics in the SigNoz dashboard. You can go to the Dashboards tab and try adding a new panel. You can learn how to create dashboards in SigNoz here.
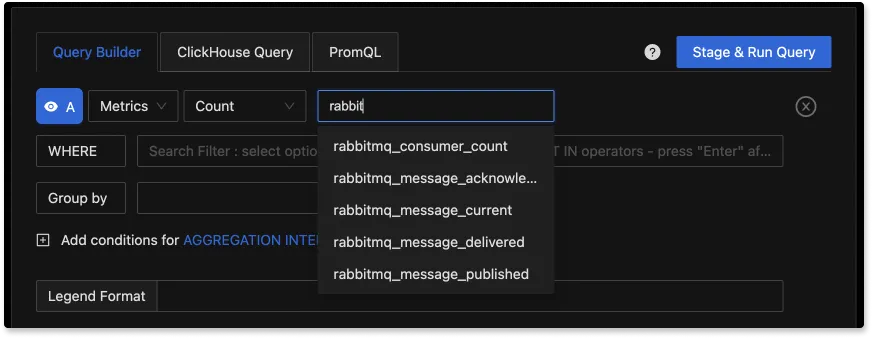
You can easily create charts with query builder in SigNoz. Here are the steps to add a new panel to the dashboard.
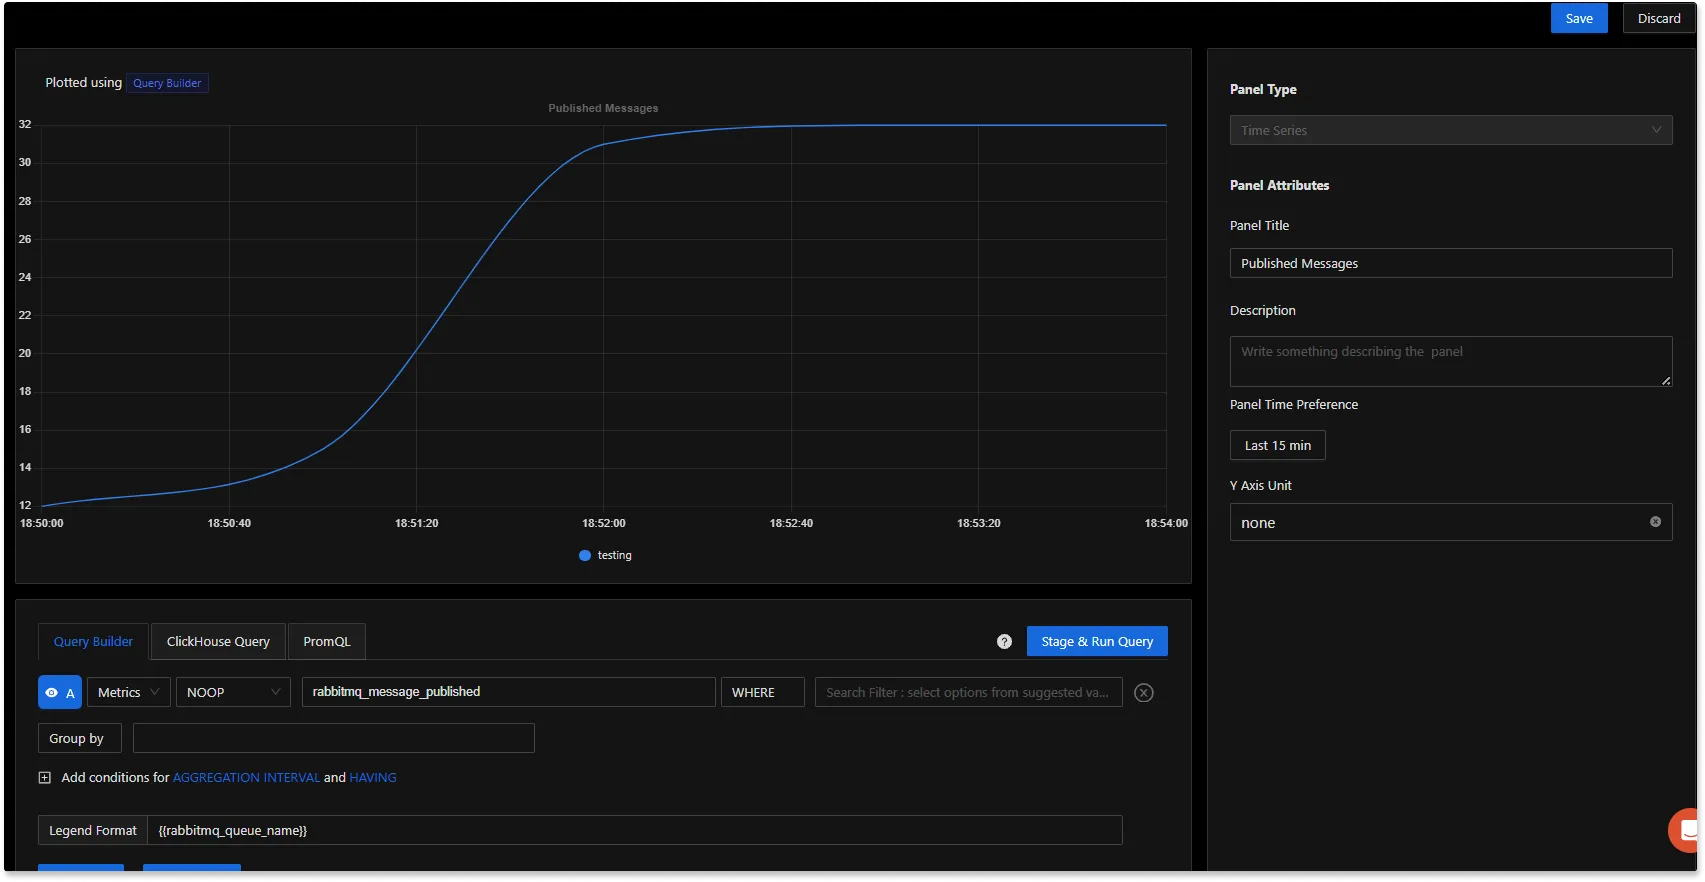
You can write queries to create charts on the RabbitMQ metrics data and add it to a dashboard.
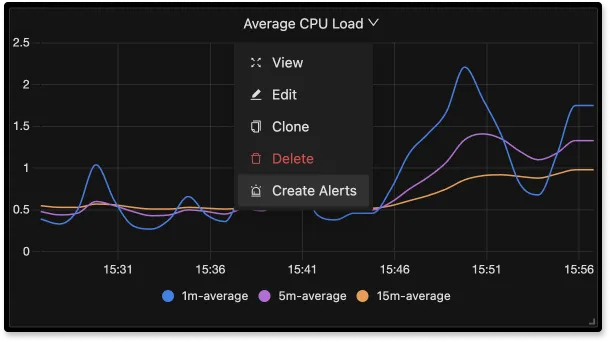
You can also create alerts on any metric. Learn how to create alerts here.
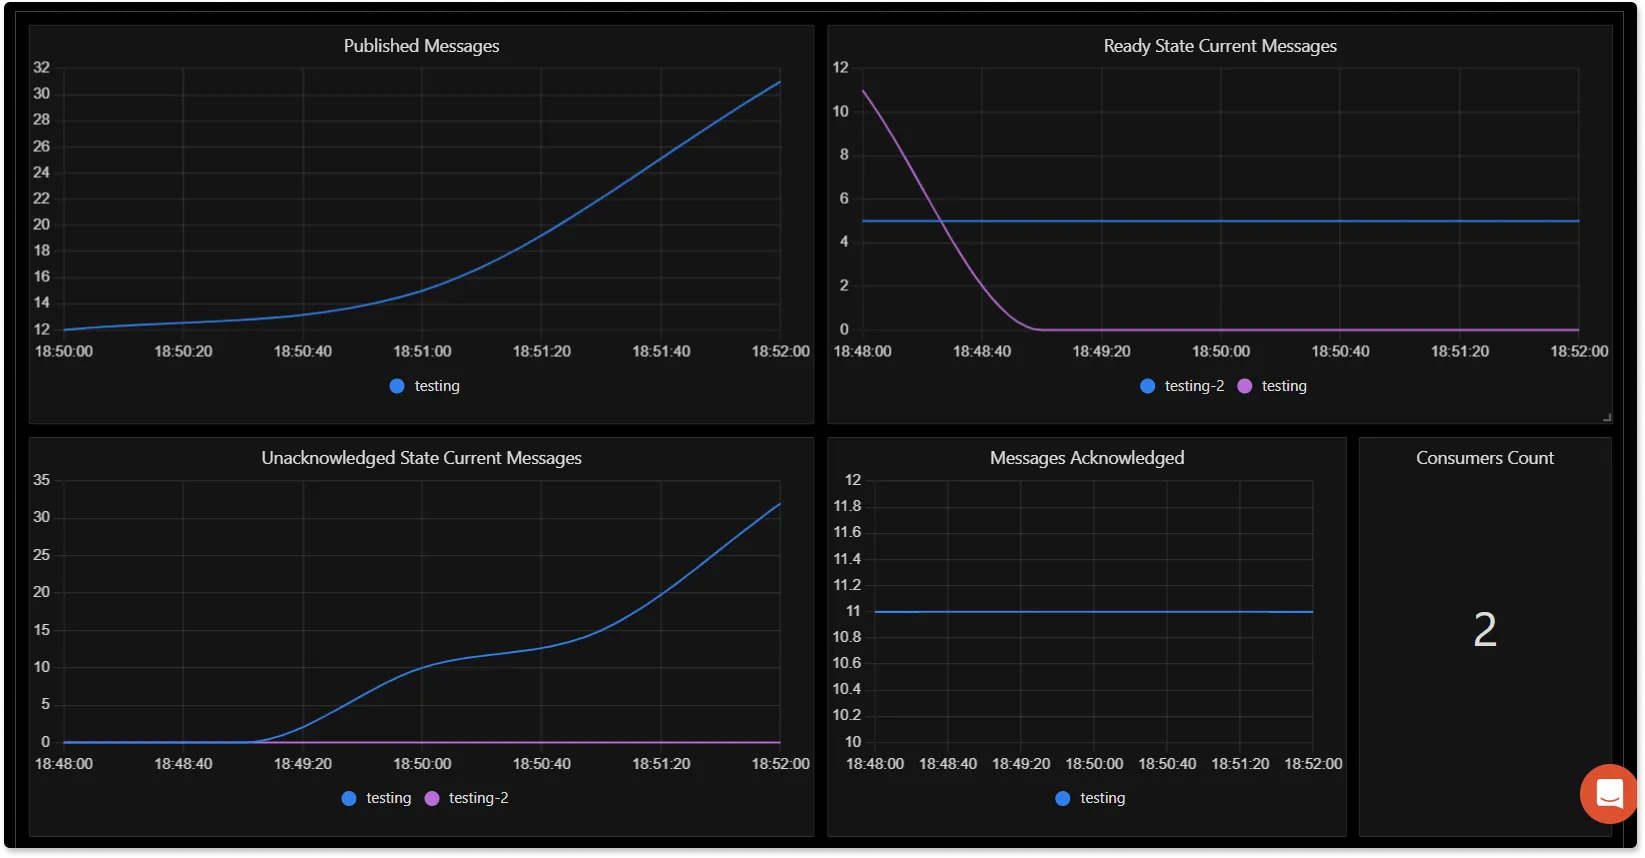
If you want to get started quickly with RabbitMQ monitoring, you can load this Rabbitmq JSON in SigNoz dashboard and get started.
Conclusion
In this tutorial, you installed an OpenTelemetry Collector to collect RabbitMQ metrics and sent the collected data to SigNoz for monitoring and alerts.
Visit our complete guide on OpenTelemetry Collector to learn more about it. OpenTelemetry is quietly becoming the world standard for open-source observability, and by using it, you can have advantages like a single standard for all telemetry signals, no vendor lock-in, etc.
SigNoz is an open-source OpenTelemetry-native APM that can be used as a single backend for all your observability needs.
Further Reading
