Using SigNoz MCP for Dashboard Automation
Dashboards are one of the fundamental parts of observability. They give you visibility into how your services are performing, what's healthy, and what isn't. But building them is a different story. Setting one up properly means:
- Clicking through menus to add each panel individually
- Knowing the right metric names and attribute keys upfront
- Writing queries and picking the right visualization type for each signal
- Scoping everything correctly to the service you care about
That's a lot of manual work you tend to put off until you really need it.
That delay has real consequences. A new service goes to production without proper monitoring because nobody had time to build the dashboard before the release. Or an incident starts and the on-call engineer doesn't have the exact panels they're looking for. During an active incident, every minute spent clicking through the UI to set up a focused view is a minute not spent on the actual investigation. Dashboards exist to give you visibility, but there's often a lot of friction to build them.
This is the friction the MCP is designed to remove: turning dashboard setup from a manual UI task into a prompt-driven workflow.
The SigNoz MCP changes this by letting you create dashboards through plain English. Instead of navigating the UI, identifying attribute names, and configuring panels one by one, you describe what you want and the MCP builds it directly in your SigNoz instance. The result is a live dashboard with real data, ready to use immediately.
In this post, we'll walk through two specific use cases: creating a monitoring dashboard for a new service from a single prompt, and spinning up a focused incident dashboard in the middle of an active incident.
The Problem with Manual Dashboard Creation
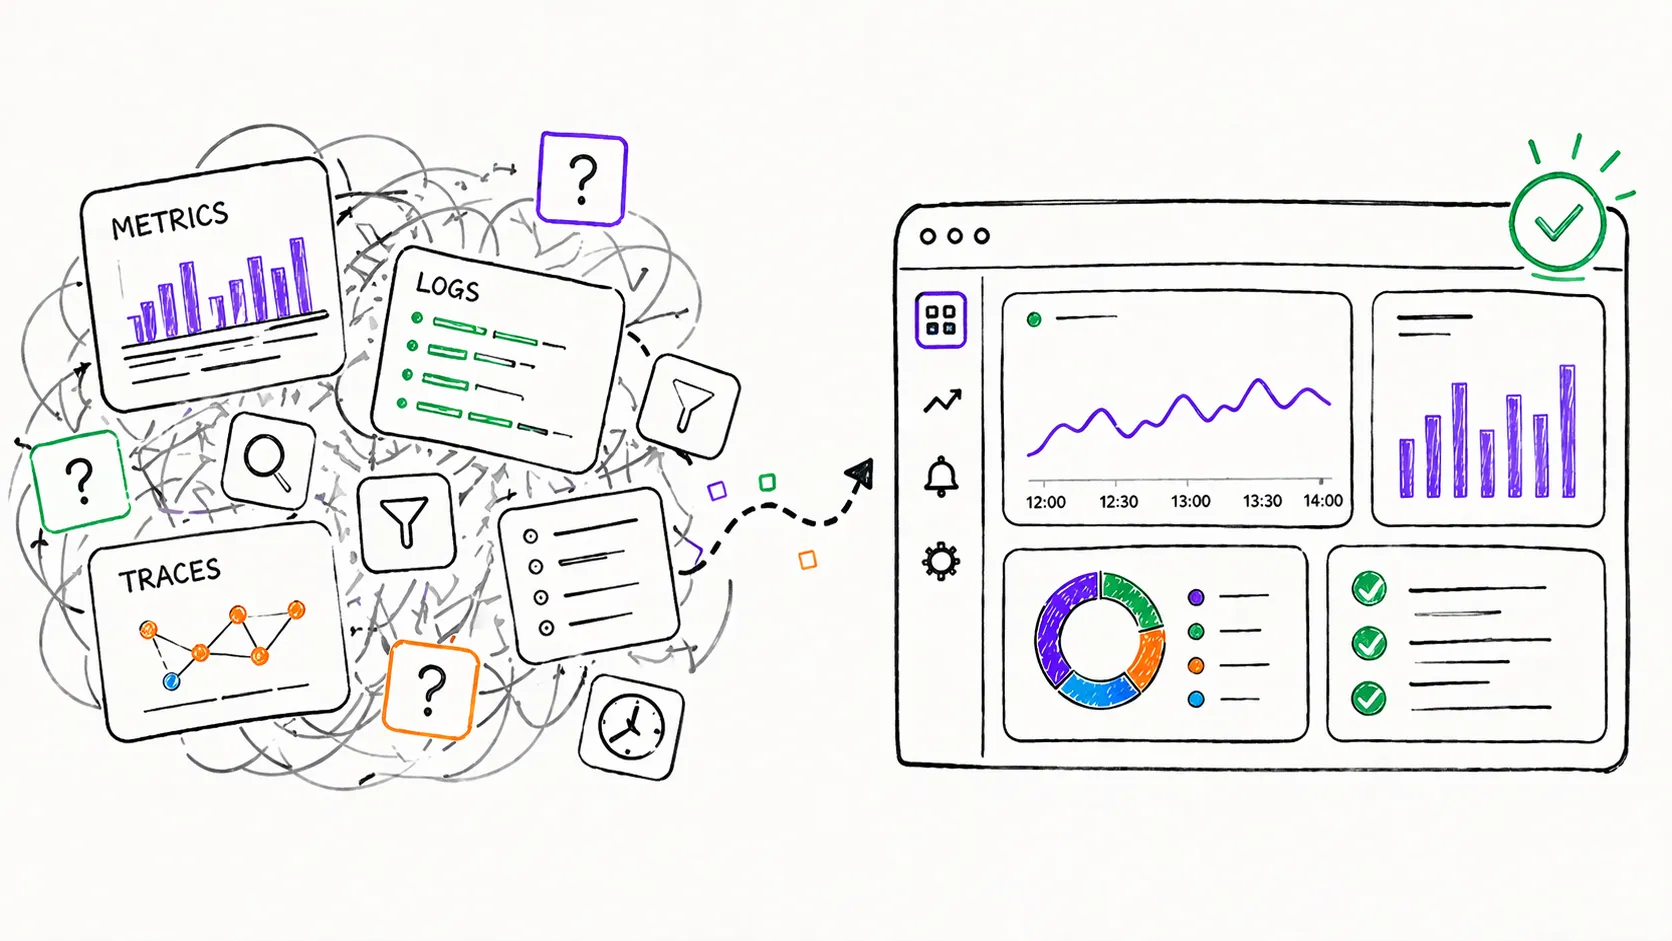
Building a dashboard from scratch is time-consuming. Before you write a single query, you need to know:
- Which metrics, logs, and traces your service is emitting
- What they're named and their specific attributes
Then for each panel, you need to:
- Configure it individually
- Set the right time ranges
- Pick the right visualization type
- Scope everything correctly to the service you want to monitor
For teams running multiple services, this doesn't scale well. Every new service that gets deployed is another dashboard that needs to be built.
The result is predictable. Dashboards usually get built reactively after something breaks and someone realizes there's no visibility. New services go unmonitored for longer than they should because nobody had the time to set up proper panels before the release. And during incidents, engineers end up working from whatever dashboard already exists rather than one specific to what's actually failing.
Teams know they need better dashboard coverage. The friction of building them manually is what gets in the way.
Creating Dashboards from Natural Language
Use this when a new service has just shipped and you need a first-pass monitoring dashboard quickly.
When a new service gets deployed, there are some things you immediately need to know:
- Is it healthy?
- What's the error rate?
- How is latency looking?
Getting answers to those questions without a dashboard means manually filtering through metrics and traces every time you want to check. But as we've established, building that dashboard takes time you often don't have right at the moment of a release.
With the SigNoz MCP, the workflow is a single prompt. You ask the MCP to confirm the service is sending data, find its relevant metrics, and create a dashboard with the panels you need:
Check if the recommendations service is sending telemetry to SigNoz.
Then create a monitoring dashboard for it with panels for error rate, p99 latency,
request throughput, and any other signals worth tracking for this type of service.
The MCP first verifies the service is actually ingesting telemetry, a useful check that catches instrumentation issues before you assume your new service is being monitored correctly. Then it:
- Discovers the right metric, trace, and log names automatically
- Constructs the correct query formulas for each panel
- Creates the dashboard directly in your SigNoz instance
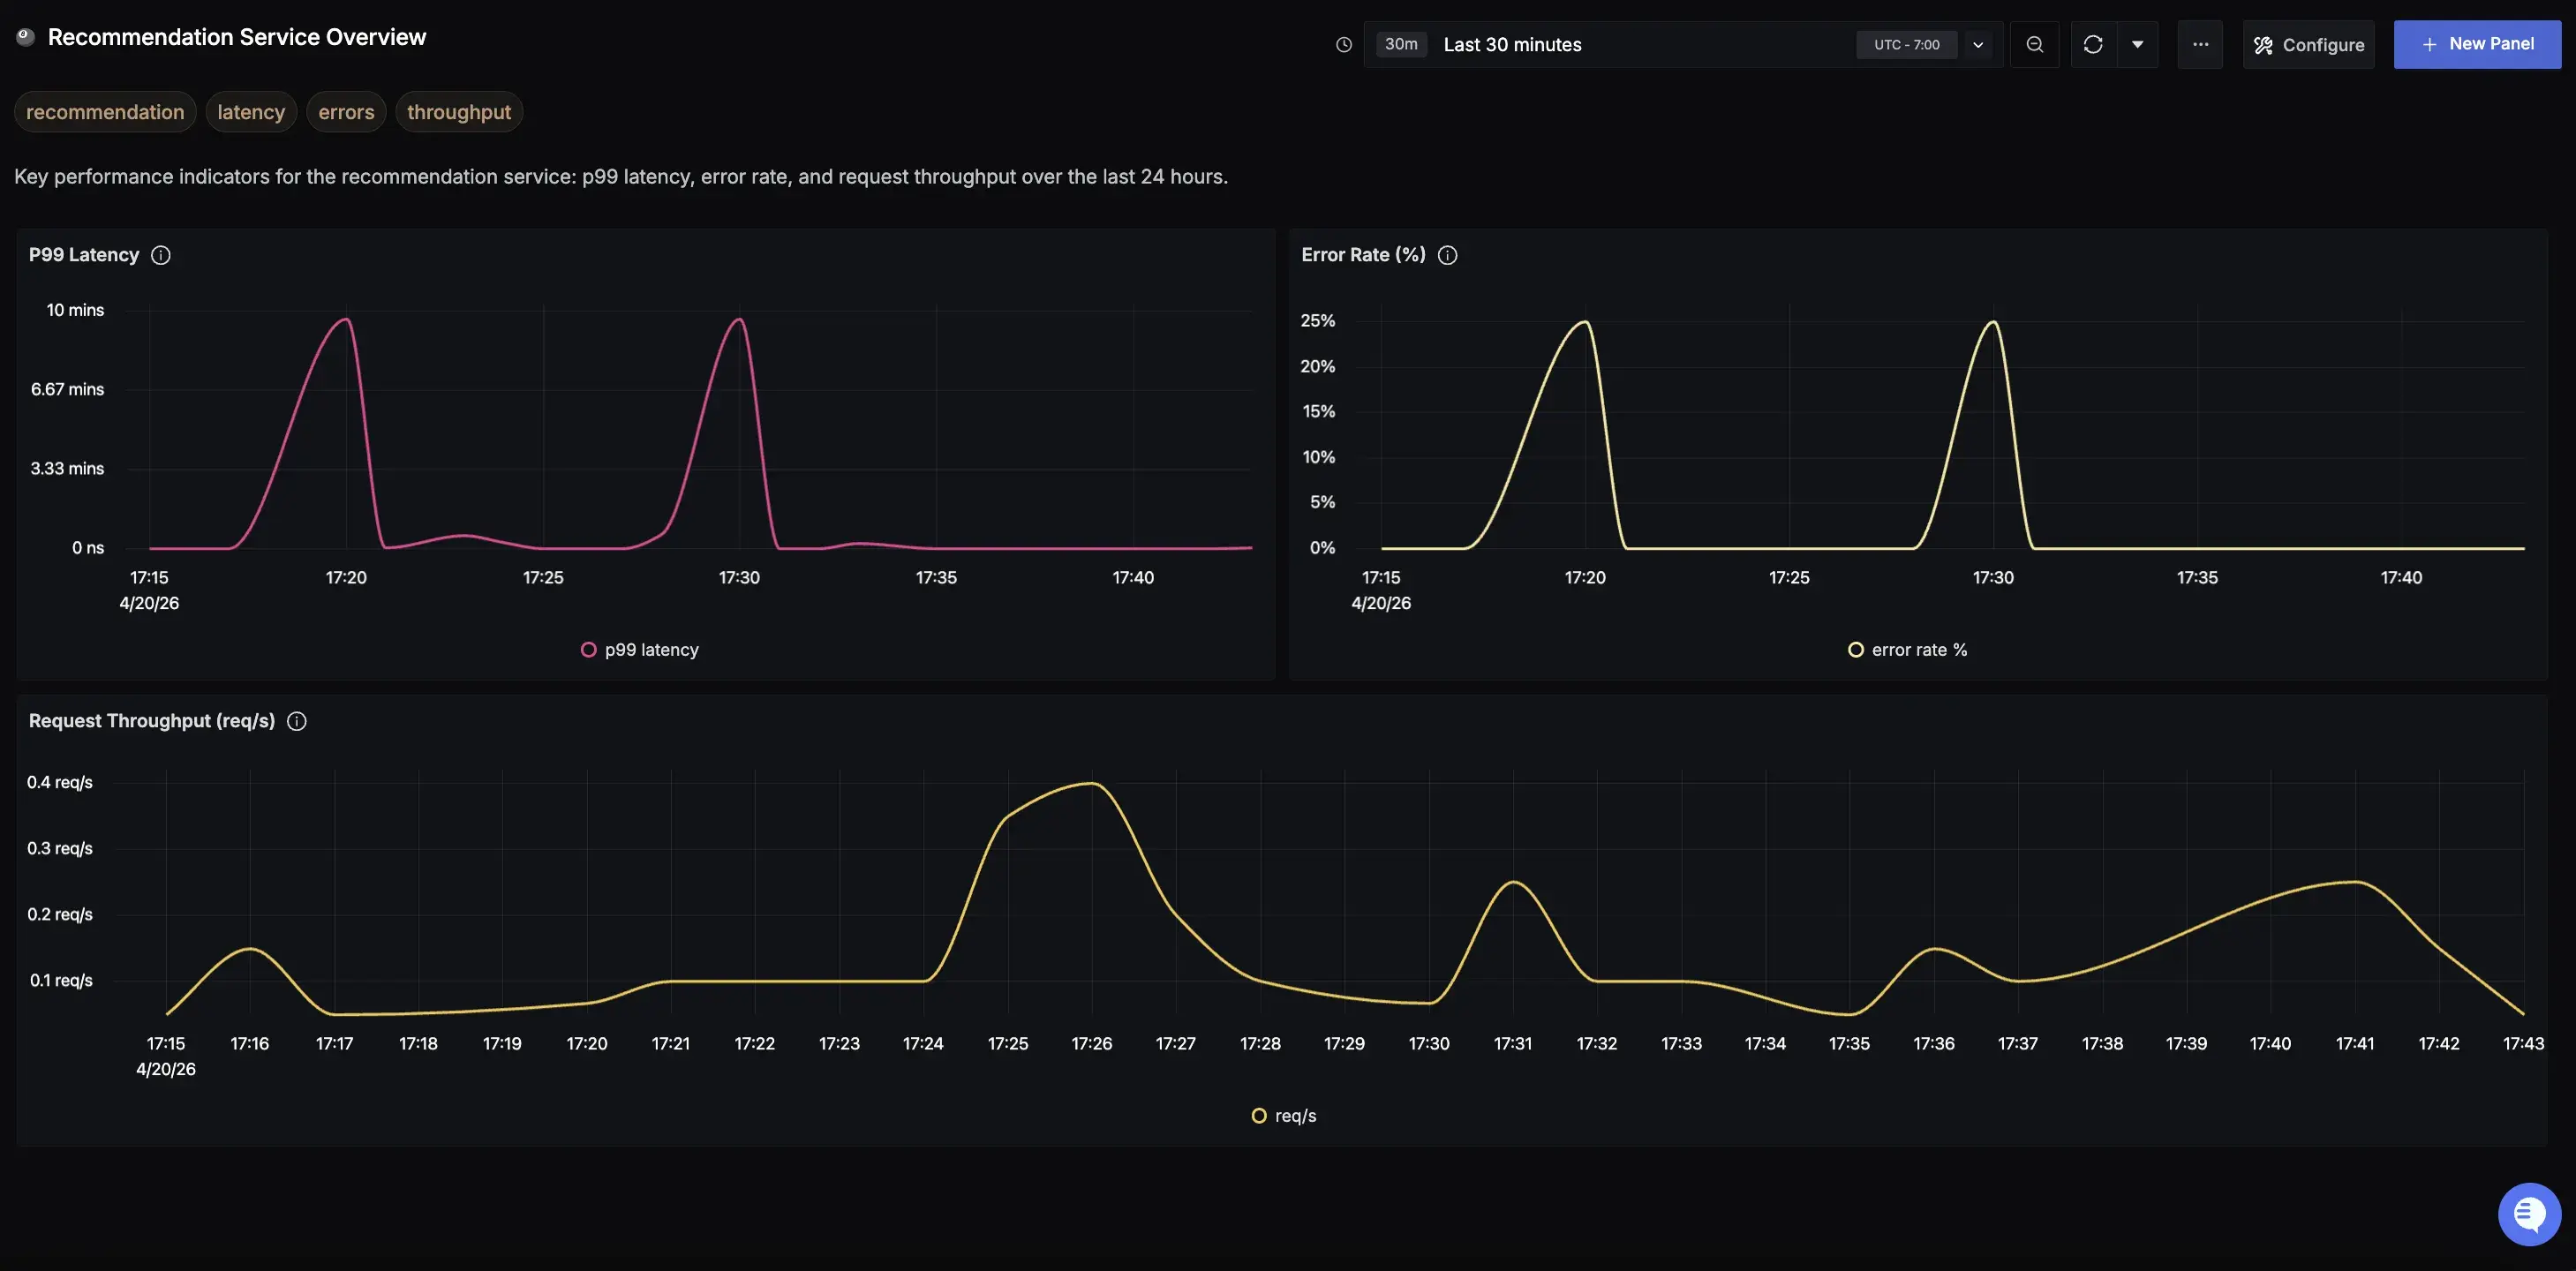
If you're not sure where to start, you can also ask the AI to reason on what the most important panels would be for your service. Based on the telemetry your service is sending, it can suggest what's worth monitoring, whether that's golden signals like error rate, latency, and throughput, or more specific metrics relevant to what your service actually does.
You don't need to come in with a list of panels already in mind.
You can generate a dashboard built specifically for the service you asked about, with panels configured against its actual data. All showing real metrics, ready to use immediately.
The whole process takes seconds rather than the 20-30 minutes it would take to build the same dashboard manually. And because the MCP handles telemetry data discovery and query construction automatically, you don't need to know the exact metric names or formula syntax upfront. You just describe what you want to see.
Spinning Up an Incident Dashboard on the Fly
The great thing about dashboards is it allows you to monitor everything you need at a glance. The issue is these dashboards are often too general for specific incidents. During an incident, you want to hone in on a specific signal. But you're looking for it in a dashboard that wasn't designed for the failure you're dealing with. Meanwhile, every minute spent configuring a more focused view is a minute not spent on the actual investigation.
This is where a purpose-built incident dashboard makes a real difference. It allows for a focused view scoped to the specific incident, showing exactly what's relevant:
- Current error rate against baseline
- Failing operations
- Dependency health
- Infrastructure metrics
Normally, creating such a dashboard would take around 30 minutes. But now it's achievable with a single prompt.
With the SigNoz MCP, you describe what you need and it builds it:
The checkout service is throwing errors and latency has spiked. Create an incident dashboard
scoped to this service. Include current error rate vs baseline, the top failing operations,
the health of any services it depends on, and the relevant infrastructure metrics.
The MCP:
- Analyzes the service
- Identifies its dependencies automatically
- Structures the dashboard around what's actually relevant to the incident
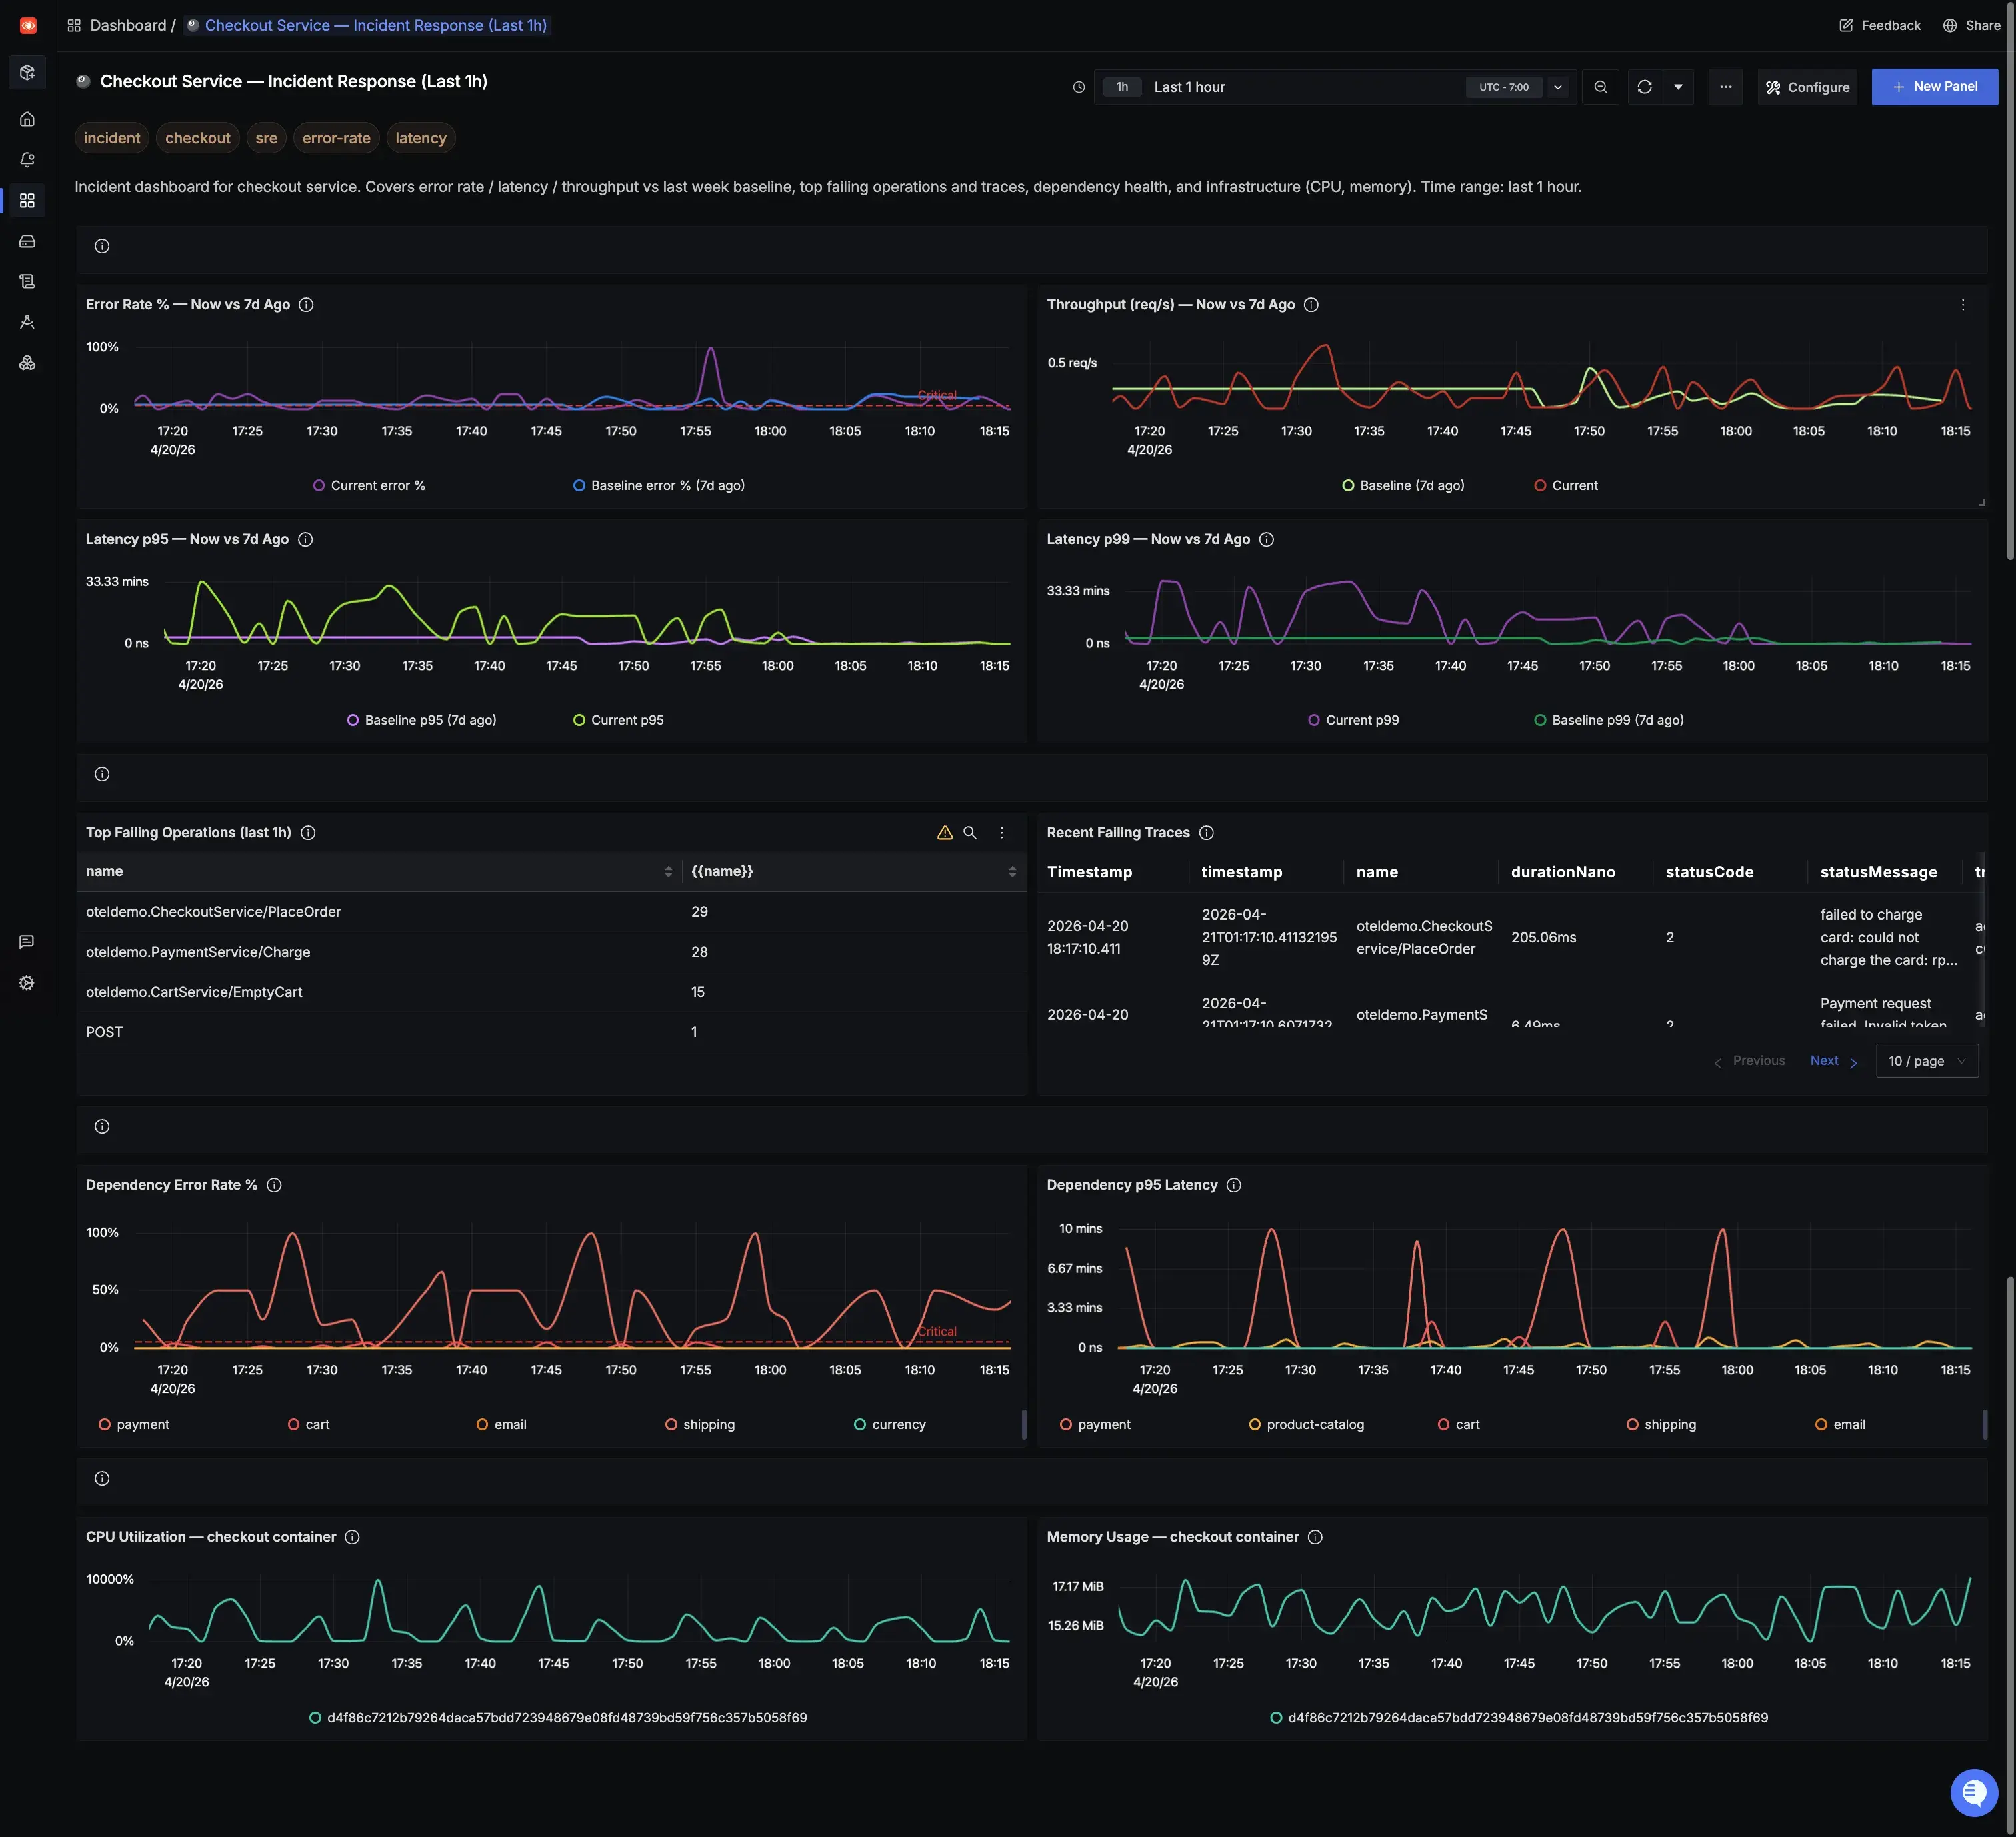
If a service is throwing errors, the MCP identifies other services that it depends on and builds dependency health panels for all of them without you needing to list them out. You can now create detailed, incident-specific dashboards in seconds, even in the middle of an active incident without any manual effort.
Putting It Together: Dashboards When You Need Them
The SigNoz MCP allows you to change the way you approach dashboards. Dashboards stop being something you plan, build, and maintain in advance, and become something you generate on demand for exactly what you need at any given moment.
That shift matters because the moments when you need a good dashboard are also the moments when you have no time to build one. A new service just shipped. An incident just started. These are exactly the situations where dashboard coverage is most critical and manual creation is least practical.
When the friction of building a dashboard drops to a single prompt, the coverage gap closes. New services get monitored from day one because spinning up a dashboard takes seconds. Incidents get better visibility because a detailed view can be created on the spot. And teams stop making the tradeoff between moving fast and having proper observability. Because with the SigNoz MCP, you don't have to choose.
Getting Started
To try these workflows yourself, connect your AI assistant to SigNoz using the MCP server. Setup takes a few minutes and works with any compatible AI assistant.


