Using SigNoz MCP for Incident Response
When an incident starts, the clock starts. Every minute between an alert firing and a root cause identified is another minute users are affected, SLAs are at risk, and engineers are under pressure.
The challenge is that incidents rarely come with clear labels. An alert fires on a service, but the service that's alerting is often not the service that's broken:
- Errors propagate upstream. A failure in a downstream dependency surfaces as an error in every service that calls it.
- Latency hides in span trees. A slow response rarely points to the service returning it. The time is being spent somewhere deeper in the call chain.
- Multiple alerts obscure scope. Several alerts firing at once makes it hard to know whether you're dealing with one cascading failure or several independent ones.
Getting to the root cause means moving quickly through layers of telemetry data. All while under pressure, with dashboards and query interfaces that assume you already know what you're looking for. That is where investigations slow down.
The SigNoz MCP changes the interface for incident response. Instead of navigating to the right dashboard and constructing the right query, you describe what you're investigating in plain English and get a structured answer directly from your telemetry data. The same investigation that used to require 20 to 30 minutes of dashboard navigation can now start with a few focused prompts. It's faster, more focused, and accessible to anyone on the team regardless of how well they know the system.
In this post, we'll walk through three specific use cases that cover the most common incident response scenarios: identifying where errors originate in your stack, tracing the source of a latency spike, and determining whether multiple firing alerts are one incident or several.
The Cost of Slow Incident Response
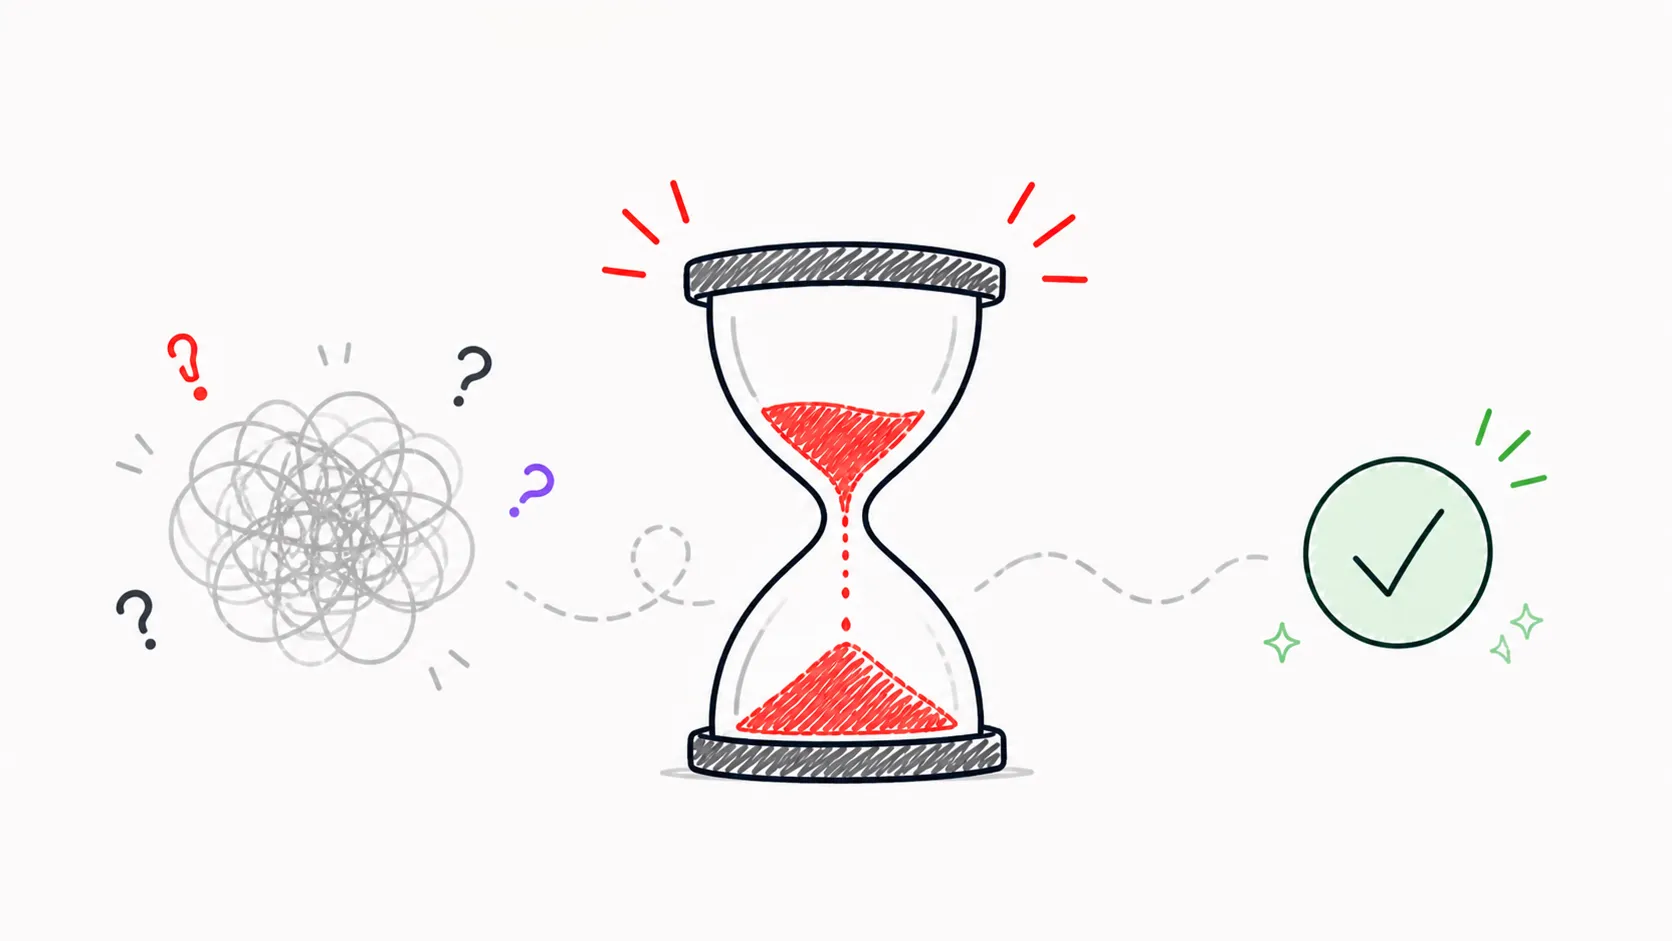
Incident response has a compounding cost. The longer an incident runs, the more users are affected, the more engineers get pulled in, and the harder it becomes to maintain a clear picture of what's actually happening. A 5 minute investigation with a clear root cause looks very different from a 45 minute war room where three teams are debugging in parallel, each working from a different assumption about what's broken.
The investigation itself is often where the most time gets lost. And it's not because of incompetent engineers but rather the tools they're working with requiring context that's hard to have under pressure.
- Which service do I filter by?
- What's the right time window?
- Which metric shows what I need?
These aren't difficult questions in general, but during an active incident, every minute spent on these is a minute not spent on the actual problem.
There's also a compounding effect on the team. Slow investigations mean longer incidents, longer incidents mean more stress, and more stress means more mistakes.
Engineers who deal with long incident investigations lose time and confidence in their ability to respond quickly, which makes the next incident harder before it even starts.
The three use cases in this post address the most common reasons investigations stall.
- Error origin: not knowing which service in the call chain is actually broken
- Latency source: not being able to quickly identify a latency bottleneck
- Alert scope: not having a fast way to determine whether multiple firing alerts are related or independent
Each one represents a point in a typical incident where the investigation slows down, and where the SigNoz MCP can compress that time significantly.
Identifying Where Errors Originate in Your Stack
When an error rate alert fires, the instinct is to look at the service that's alerting. But in a distributed system, the service surfacing the error is rarely the service causing it. Errors propagate upstream through call chains. For example, a database failure becomes a service failure and eventually a frontend 500. The alert tells you where the error ended up, not where it started.
Finding where it started is the real investigation. And doing that manually means pulling up traces, clicking through span trees, and following the call chain service by service until you find the failure point. Under the time pressure of an active incident, that process is slow and error prone.
With the SigNoz MCP you start by grouping the errors to find the dominant pattern:
Show me errors for the frontend service in the last 15 minutes grouped by operation.This immediately narrows the focus. Instead of looking at hundreds of errors across dozens of operations, you can see which single operation accounts for the majority of failures. That's where the investigation goes next.
From there you pull a trace for that specific operation to see the full call chain:
Show me the span breakdown for a trace with that error. I want to see where in the call chain it failed.More often than not, the service that's alerting is healthy. The failure is one or two hops downstream and the span tree shows you exactly where.
Once you know which downstream service is failing, a final prompt checks its dependencies:
Show me what downstream services or databases that service calls. Check if there are any slow queries or timeouts.This surfaces the error rates and latency patterns that reveal the root cause.
All you need is three prompts from alert to root cause, without any dashboard navigation, manual trace filtering, or guessing which service to look at next.
Tracing the Source of a Latency Spike
Latency problems are harder to investigate than errors. An error has a clear signal: a span returns a non-200 status, an exception gets thrown, a log line says something failed. Latency is subtler. Everything is working, requests are completing successfully, but something somewhere is slow, causing a degraded user experience.
The challenge is that latency in a distributed system is rarely where you expect it. A slow frontend response might have nothing to do with the frontend. The time is being spent somewhere in the call chain like a database query that's taking longer than it should or a downstream service that's under load. Finding it means looking at the span breakdown for the slow requests and identifying which specific operation is consuming the most time.
With the SigNoz MCP you start by asking for the top operations on the slow service:
Show me the top operations for the checkout service ranked by p99 latency. Which endpoints are slowest?This gives you a ranked view of where latency is concentrated across the service. From there you drill into the slowest operation to see the full span breakdown:
Show me the span breakdown for a slow trace on that endpoint. Which spans are taking the most time?The span tree tells you exactly where the time is going, whether it's a downstream service call, a database query, or something internal to the service itself. If the slow span is a downstream call, you go one level deeper:
Show me the error rate and p99 latency for that downstream dependency over the last 30 minutes.This confirms whether the dependency is consistently slow or spiking intermittently, which tells you whether you're looking at a sudden issue or a gradual drift that's been building over time.
The investigation follows the latency to its source, one prompt at a time, without needing to know upfront which service or dependency to look at.
Determining if Multiple Alerts Are One Incident or Several
Multiple alerts firing simultaneously is a common yet confusing moment in incident response. Three services are alerting at once, all within minutes of each other. Do you escalate to three different teams and start three separate investigations? Or is this one cascading failure from a single root cause that will resolve when you fix one thing?
Splitting the investigation across three teams when it's actually one root cause triples the coordination for no reason. And if you treat three separate incidents as one cascade when they're actually independent, you'll end up fixing one thing and wondering why the other two alerts are still firing.
The SigNoz MCP lets you answer that question before committing to an investigation path. You start by getting a clear picture of what's actually firing:
Find all currently firing alerts. When did each one start firing?Timing is the first signal. Alerts that started firing within seconds of each other are likely related. An alert that's been firing for hours before the others is almost certainly independent.
For the alerts that appear related, you can then check whether the services share a dependency:
Check if these services share a common dependency or if one service calls the other. Pull recent error traces to see if they're related.The trace data shows the call relationships between services like which ones are calling which, and whether a failure in one is propagating to the others. If the same failing span appears across traces from multiple services, you have your answer: one root cause.
For alerts that started at a different time, you verify whether the current incident is contributing to their errors or whether they're truly independent:
What percentage of errors on this service in the last 15 minutes are caused by the cascade from the other failing service?If the overlap is small, it's a separate incident that needs its own investigation. If it's large, fixing the root cause will clear it too.
You're able to get a clear, evidence-based answer to the question every incident needs answered first. How many fires are we dealing with, and where do we focus?
Putting It Together: From Alert to Root Cause
The three use cases in this post cover common scenarios that slow down incident response:
- Error origin: not knowing which service in the call chain is actually broken
- Latency source: not being able to quickly identify where latency is coming from
- Alert scope: not having a fast way to determine whether multiple firing alerts are related or independent
They share a common pattern. You start with incomplete information like an alert, a service name, a set of firing notifications, and the investigation is the process of translating that into something you can act on. The SigNoz MCP compresses that process by letting you move through the investigation conversationally, following the signal from one prompt to the next rather than navigating between dashboards and constructing queries from scratch at each step.
The speed difference matters most under pressure. When an incident is active and users are affected, the load of working through a traditional observability interface is significant. The MCP lowers that load, allowing you to describe what you're looking for rather than figuring out how to ask for it. That means:
- Faster investigations
- Clearer thinking under pressure
- Less time between alert and resolution
This doesn't replace deep system knowledge or good engineering judgment. But it does mean that the time spent on navigation, query construction, and manual correlation — the parts of incident response that don't require judgment, just familiarity with the tool — gets reduced. What's left is the actual thinking: understanding what the data means and deciding what to do about it.
Getting Started
To try these workflows yourself, connect your AI assistant to SigNoz using the MCP server. Setup takes a few minutes and works with any compatible AI assistant.


