Using SigNoz MCP for Log and Trace Investigation
Logs and traces are the most detailed source of truth you have in a distributed system. When something goes wrong, they contain the full picture:
- which service failed
- which line of code threw the error
- how long each step in the request took
- what the system state was at the moment of failure
The signals are all there. The challenge has always been getting to them quickly.
Traditional log and trace investigation assumes you already know where to look. You need to know
- which service to filter by
- which fields to query on
- the specific time window
If you're investigating an unfamiliar service or a problem that spans multiple services, you spend the first part of every investigation just setting up this context yourself before you can start actually analyzing anything.
SigNoz makes this easier than most tools. Traces, logs, and metrics are correlated out of the box via OpenTelemetry, so you're not jumping between disconnected systems to piece together what happened. But even with that correlation in place, you still need to know which service to open, which filters to apply, and what to look for. The interface is powerful, but navigation and filtering are still manual.
The SigNoz MCP changes that dynamic. Instead of navigating to the right service and constructing the right filters, you describe what you're looking for in plain English and the MCP does the navigation for you. You start from a symptom or a known failure and it finds the relevant logs, traces, and correlated signals automatically.
In this post we'll walk through two specific use cases: exploring logs without writing a single query, and tracing a failing request end-to-end across multiple services.
The Problem with Traditional Log and Trace Investigation
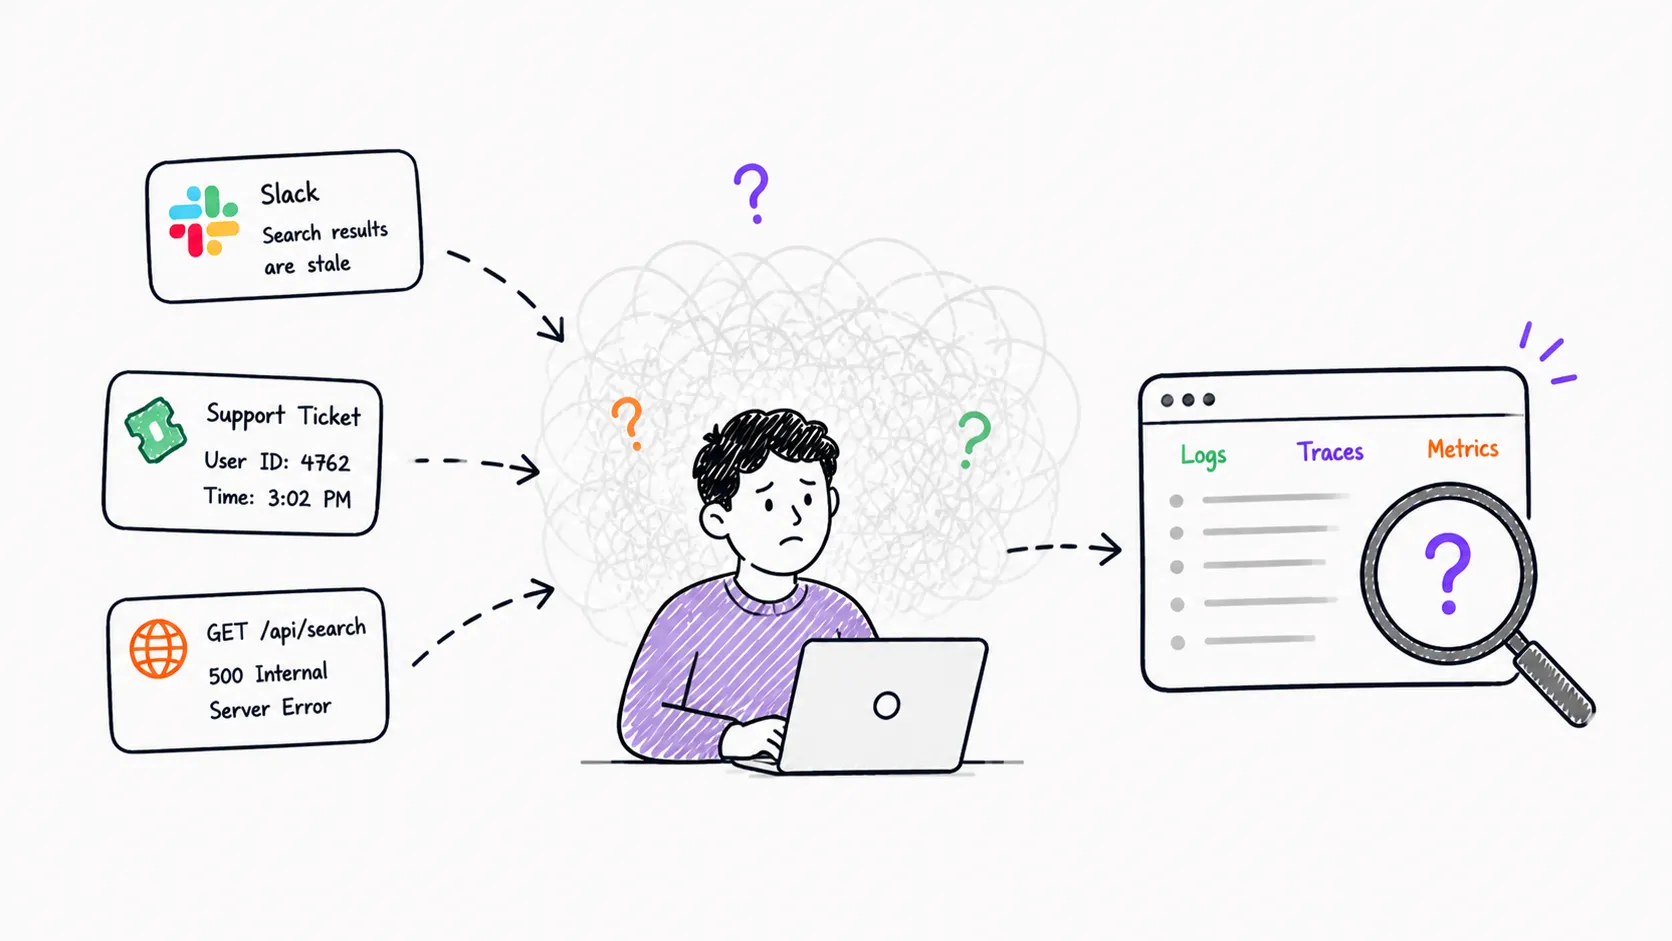
The hard part of log and trace investigation is usually not missing data. It is missing starting context: the service name, the right fields, the time window, or the trace ID. In practice, that starting point often looks vague:
- Slack message: "search results are stale"
- Support ticket: a user ID and a timestamp
- Endpoint: returning 500s
None of these give you a service name to filter by, a field name to query on, or a log pattern to search for. You have to fetch that context through investigation, but observability tools assume you already have it before you start.
This creates a frustrating loop. You open your observability tool, try a query, get too many results or the wrong ones, refine the filter, try again. If you're investigating a service you don't own or haven't worked with before, that loop takes longer because you don't know the field names, the log format, or which operations matter. By the time you have enough to start making progress, you've already spent 15-20 minutes on navigation rather than investigation.
Traces have a slightly different problem. The data in a distributed trace is highly detailed. It’s a full call chain across every service involved in a request, with timing and error information at every step. But those details are only accessible if you have a trace ID to start from, or know exactly which service and time window to search. A support ticket that says "checkout was broken at 3pm" doesn't give you any specifics about the exact trace ID. It simply gives you a starting point for a manual search.
SigNoz's native OTel integration means traces, logs, and metrics are already correlated. The MCP builds on that by removing the remaining friction of querying, filtering, and navigation that still require manual effort even when the data is in one place.
Exploring Logs Without Writing a Single Query
Most log investigations start with a symptom rather than a service. The reports typically just describe the problem rather than providing a specific service name, a log pattern, or a query to run.
The traditional approach is to take that description and translate it into a query yourself. You pick a service you think might be involved, write a filter, see what comes back, and iterate from there. If you know the system well, this works. But when you don't, it's slow and uncertain.
With the SigNoz MCP, you start from the symptom directly:
Show me recent error or warning logs from any service related to search indexing or index lag in the last 6 hours.And immediately get all logs matching what you're searching for:
Found 34 logs matching across 2 services:

1. 14:52:11 WARN  search-indexer - "Index lag exceeds threshold: 4h12m behind head (threshold: 15m)"
2. 14:47:03 WARN  search-indexer - "Index lag exceeds threshold: 4h07m behind head (threshold: 15m)"
3. 14:42:01 WARN  search-indexer - "Index lag exceeds threshold: 4h02m behind head (threshold: 15m)"
4. 14:22:18 WARN  search-indexer - "Consumer group rebalance completed, partition assignment unchanged"
5. 13:15:44 WARN  search-indexer - "Batch processing rate: 12 events/sec (normal: ~340 events/sec)"
...
You don’t have to specify a service or write a query or filter. The MCP is automatically able to query through all relevant logs across the relevant time frames and find exactly what you’re looking for.
From there, the investigation follows naturally. Each response points to the next question, and each prompt gets more specific as the picture becomes clearer:
Show me logs from that service that mention 'skip', 'drop', 'malformed', or 'invalid'.Show me how many of those warnings occurred per hour over the last 24 hours.Show me deployment or config change logs from the upstream service around the time the spike started.Each prompt builds on the last. You follow the signal rather than constructing the full query upfront. The MCP handles:
- service discovery
- filtering
- aggregation
All you have to do is keep asking the next logical question until you have a root cause.
You can follow the natural language log exploration guide to set this up for your own services.
Tracing a Failing Request End-to-End
Your endpoint is returning 500s, an alert fired, and all you know is that something is broken. You need to find the failing request, understand the full call chain, and surface the correlated logs, all without a trace ID to start from.
With the SigNoz MCP, a single prompt handles all of it:
Find the latest failed /checkout trace and show me the full span tree with the error. Also show matching error logs.The assistant gives you a complete picture with the trace, the span tree, and the correlated logs, all in one response:
Latest failed /checkout trace
Trace ID: a1b3adef15df29b119e5379dee016ff0
Duration: ~8.95s  |  Status: HTTP 500

Span tree:
└─ POST /api/checkout                    frontend-proxy    ERROR 500
   └─ POST /api/checkout (server)        frontend          ERROR 500
      └─ CheckoutService/PlaceOrder      checkout          ERROR
         ├─ prepareOrderItems...         checkout          ok
         │  ├─ CartService/GetCart       cart              ok
         │  ├─ GetProduct                product-catalog   ok
         │  ├─ CurrencyService/Convert   currency          ok
         │  └─ shipping /get-quote       shipping          ok
         └─ PaymentService/Charge        checkout          ERROR ← failure
            └─ PaymentService/Charge     payment           ERROR
               status: "Payment request failed. Invalid token.
                        app.loyalty.level=gold"

Matching logs:
22:29:09.542  payment  info  Charge request received
22:29:09.543  payment  warn  Payment request failed. Invalid token. app.loyalty.level=gold

Stack trace:
Error: Payment request failed. Invalid token. app.loyalty.level=gold
at module.exports.charge (/usr/src/app/charge.js:37:13)The span tree shows the full call chain across every service: cart, product catalog, currency, shipping all return clean. The failure originates at a single point: PaymentService/Charge. The correlated logs, surfaced automatically through SigNoz's native OTel integration, go one level deeper. A stack trace pointing directly to charge.js line 37, with a specific error message that reveals the failure is scoped to gold-tier loyalty users.
You didn't need a trace ID. And you didn't manually filter traces or search for logs separately. All you needed was one prompt to get the failing trace, the full span tree, the correlated logs, and a stack trace, giving you everything you need to open a PR and fix the bug.
Putting It Together: Investigations That Start from a Question
The two use cases in this post cover different starting points:
- a vague symptom in a message
- a known failure with no trace ID at all
But they share the same underlying pattern. You start with something incomplete, and the MCP does the work of translating your plain English into queries against your telemetry data.
What this enables:
- Start from a symptom — no service name or trace ID required
- No query syntax — describe what you're looking for in plain English
- Any engineer can investigate services they don't own
The SigNoz MCP removes the context-gathering step. The correlation between traces, logs, and metrics that SigNoz provides natively through OpenTelemetry does the heavy lifting, and the MCP makes accessing it conversational rather than manual, so any engineer can investigate any part of the stack.
Getting Started
To try these workflows yourself, connect your AI assistant to SigNoz using the MCP server. Setup takes a few minutes and works with any compatible AI assistant.


