Using SigNoz to Monitor Your Kubernetes Cluster
Kubernetes and OpenTelemetry are both CNCF projects, and both are closely associated with modern microservice architecture. Despite their connection, there isn’t a single cohesive solution to monitoring your Kubernetes cluster with OpenTelemetry.
Large teams that use complex clusters in production have generally ended up building their own tools for monitoring both their infrastructure and application code. See Intuit’s talk from the recent Open Source Summit on how they built tools to easily summarize golden signals.
Building a system to collect, tabulate, manage, and display your observability data from scratch doesn’t make much sense for a mid sized team, or one that doesn’t have a dedicated developer experience and operations team. SigNoz is an open source tool to do just that. This piece is a complete guide on using SigNoz on your Kubernetes cluster. This includes:
- running SigNoz as a service within your own cluster →
- monitoring your applications running on your cluster →
- Monitoring the status of your cluster within a Signoz dashboard →
If you only want to do one of the things listed above, there are individual guides (linked above) that will be more useful, this is intended as a start-to-finish guide.
Step 1 - Running Signoz within your cluster
Install SigNoz on Kubernetes with Helm
Add the SigNoz Helm repository to your client with name signoz by running the following command:
helm repo add signoz https://charts.signoz.io
Verify that the repository is accessible to the Helm CLI by entering the following command:
helm repo list
You should see the following listed:
signoz [https://charts.signoz.io](https://charts.signoz.io/)
If you have a large number of helm charts installed, use helm repo list | grep signoz
Use the kubectl create ns command to create a new namespace. We’ll use platform for your new namespace.
kubectl create ns platform
Run the following command to install the chart with the release name my-release and namespace platform This will install the latest stable version of SigNoz.
helm --namespace platform install my-release signoz/signoz
Expected output
NAME: my-release
LAST DEPLOYED: Mon May 23 20:34:55 2022
NAMESPACE: platform
STATUS: deployed
REVISION: 1
NOTES:
1. You have just deployed SigNoz cluster:

- frontend version: '0.8.0'
- query-service version: '0.8.0'
- alertmanager version: '0.23.0-0.1'
- otel-collector version: '0.43.0-0.1'
- otel-collector-metrics version: '0.43.0-0.1'
If you use kubectl -n platform get pods you will see a list like this one
NAME                                                        READY   STATUS    RESTARTS   AGE
chi-signoz-cluster-0-0-0                                    1/1     Running   0          8m21s
clickhouse-operator-8cff468-n5s99                           2/2     Running   0          8m55s
my-release-signoz-alertmanager-0                            1/1     Running   0          8m54s
my-release-signoz-frontend-78774f44d7-wl87p                 1/1     Running   0          8m55s
my-release-signoz-otel-collector-66c8c7dc9d-d8v5c           1/1     Running   0          8m55s
my-release-signoz-otel-collector-metrics-68bcfd5556-9tkgh   1/1     Running   0          8m55s
my-release-signoz-query-service-0                           1/1     Running   0          8m54s
my-release-zookeeper-0                                      1/1     Running   0          8m54s
If you want to start reporting sample data right away, you can follow these instructions to run a demo application that reports traces immediately.
Step 2 - Reporting data to your SigNoz instance
To send data about your application to SigNoz, you can just use the Otel collector as an opentelemetry endpoint, and follow the OpenTelemetry guides for your language to report data. This will involve a good deal of configuration, and probably only makes sense if you’re already using OpenTelemetry and just want to use SigNoz as a replacement for your previous endpoint.
For most users, you’ll want to use the SigNoz Kubernetes Operator to both send infrastructure metrics and automatically instrument your installed application.
Make sure that your SigNoz cluster is up and running
Install cert-manager with kubectl apply -f https://github.com/cert-manager/cert-manager/releases/download/v1.12.0/cert-manager.yaml
Suggestion: Make sure Golang is installed for telemetrygen
Set up OpenTelemetry Operator
To install the operator in the existing K8s cluster:
kubectl apply -f [https://github.com/open-telemetry/opentelemetry-operator/releases/download/v0.116.0/opentelemetry-operator.yaml](https://github.com/open-telemetry/opentelemetry-operator/releases/download/v0.116.0/opentelemetry-operator.yaml)
Once the opentelemetry-operator deployment is ready, we can proceed with creation of OpenTelemetry Collector (otelcol) instance and enabling automatic instrumentation of our applications.
A note on language confusion: what is a collector
When first using OpenTelemetry, it’s possible to get a bit hung up on the language of a collector. The term is intentionally indeterminate, since a collector may exist on the same server as the data being generated or very close to where the data is being received. In the OpenTelemetry project a collector can receive, process, or export data.

From the OpenTelemetry documentation, showing just how much the collector can do
For our purposes, we’ll have a SigNoz collector gathering data within our cluster. If we’re not just reporting data within our own cluster, it would be good to use a first collector to filter, batch, and compress our data before it’s sent to our SigNoz instance.
Deploying an OpenTelemetry Collector
The following is a ‘simplest possible’ version of the collector
kubectl apply -f - <<EOF
apiVersion: opentelemetry.io/v1alpha1
kind: OpenTelemetryCollector
metadata:
  name: simplest
spec:
  mode: deployment
  config: |
    receivers:
      otlp:
        protocols:
          grpc:
          http:
    processors:
      batch:
    exporters:
      debug:
    service:
      pipelines:
        traces:
          receivers: [otlp]
          processors: [batch]
          exporters: [debug]
EOF
There are other methods for deploying the collector, including a sidecar version where you can have a collector available on all the pods you select. More detail is available in our documentation on deployment modes.
Auto-Instrumenting your Application
With the Kubernetes Operator running you can apply an annotation to your pods to enable automatic instrumentation for Java, NodeJS, Python, and .Net.
First, you’ll need to create an instance of Instrumentation which sends OTLP data to SigNoz endpoint:
kubectl apply -f - <<EOF
apiVersion: opentelemetry.io/v1alpha1
kind: Instrumentation
metadata:
  name: my-instrumentation
spec:
  exporter:
    endpoint: http://my-release-signoz-otel-collector.platform.svc.cluster.local:4317
  propagators:
    - tracecontext
    - baggage
    - b3
  sampler:
    type: parentbased_traceidratio
    argument: "0.25"
  java:
    image: ghcr.io/open-telemetry/opentelemetry-operator/autoinstrumentation-java:latest
  nodejs:
    image: ghcr.io/open-telemetry/opentelemetry-operator/autoinstrumentation-nodejs:latest
  python:
    image: ghcr.io/open-telemetry/opentelemetry-operator/autoinstrumentation-python:latest
  dotnet:
    image: ghcr.io/open-telemetry/opentelemetry-operator/autoinstrumentation-dotnet:latest
EOF
Instrumentation consists of following properties:
exporter.endpoint- (optional) The address where telemetry data is to be sent in OTLP format, see “Addressing data” belowpropagators- Enables all data sources to share an underlying context mechanism for storing state and accessing data across the lifespan of a transaction.sampler- Mechanism to control the noise and overhead introduced by reducing the number of samples of traces collected and sent to the backend. OpenTelemetry provides two types: StaticSampler and TraceIDRatioBased.- Language properties i.e.
java,nodejs,pythonanddotnet- custom images to be used for auto-instrumentation with respect to the languages as set in the pod annotation.
Next you’ll just need to add an annotation to the pod to add instrumentation. For example:
instrumentation.opentelemetry.io/inject-java: "true" — for Java
See the state of OpenTelmetry language libraries to keep track of which languages may soon add more auto-instrumentation features.
Addressing data
The way you report data to your cluster will depend on whether you’re running your workload in the same cluster or not. If not, find the IP address for your collector with kubectl describe pod -n [collector pod name]
When reporting data to an IP address you’ll either need to configure the TLS certificate and private key for the SigNoz collector or set the configuration flag --set otelInsecure=true.
For reporting data within your cluster, you can use the DNS name for the collector, which should be http://my-release-signoz-otel-collector.platform.svc.cluster.local:4317
Step 3 - Kubernetes Infrastructure Metrics
Along with application metrics, it’s also vital to keep tack of infrastructure statistics for your cluster. The k8s-infra chart was installed along with our SigNoz instance in Step 1, but if you’ve skipped this step or are trying to monitor a second cluster, use
helm install my-release signoz/k8s-infra  \
  --set otelCollectorEndpoint=<IP-or-Endpoint-of-SigNoz-OtelCollector>:4317
See ‘Addressing data’, above, for populating the endpoint setting.
Your first K8s infra dasbhoard
Kubernetes infrastructure information won’t show up on the default dashboards within SigNoz. To view performance data:
- Copy this json with the dashboard configuration
- Access your SigNoz interface, go to Dashboards>New Dashboard>Import JSON
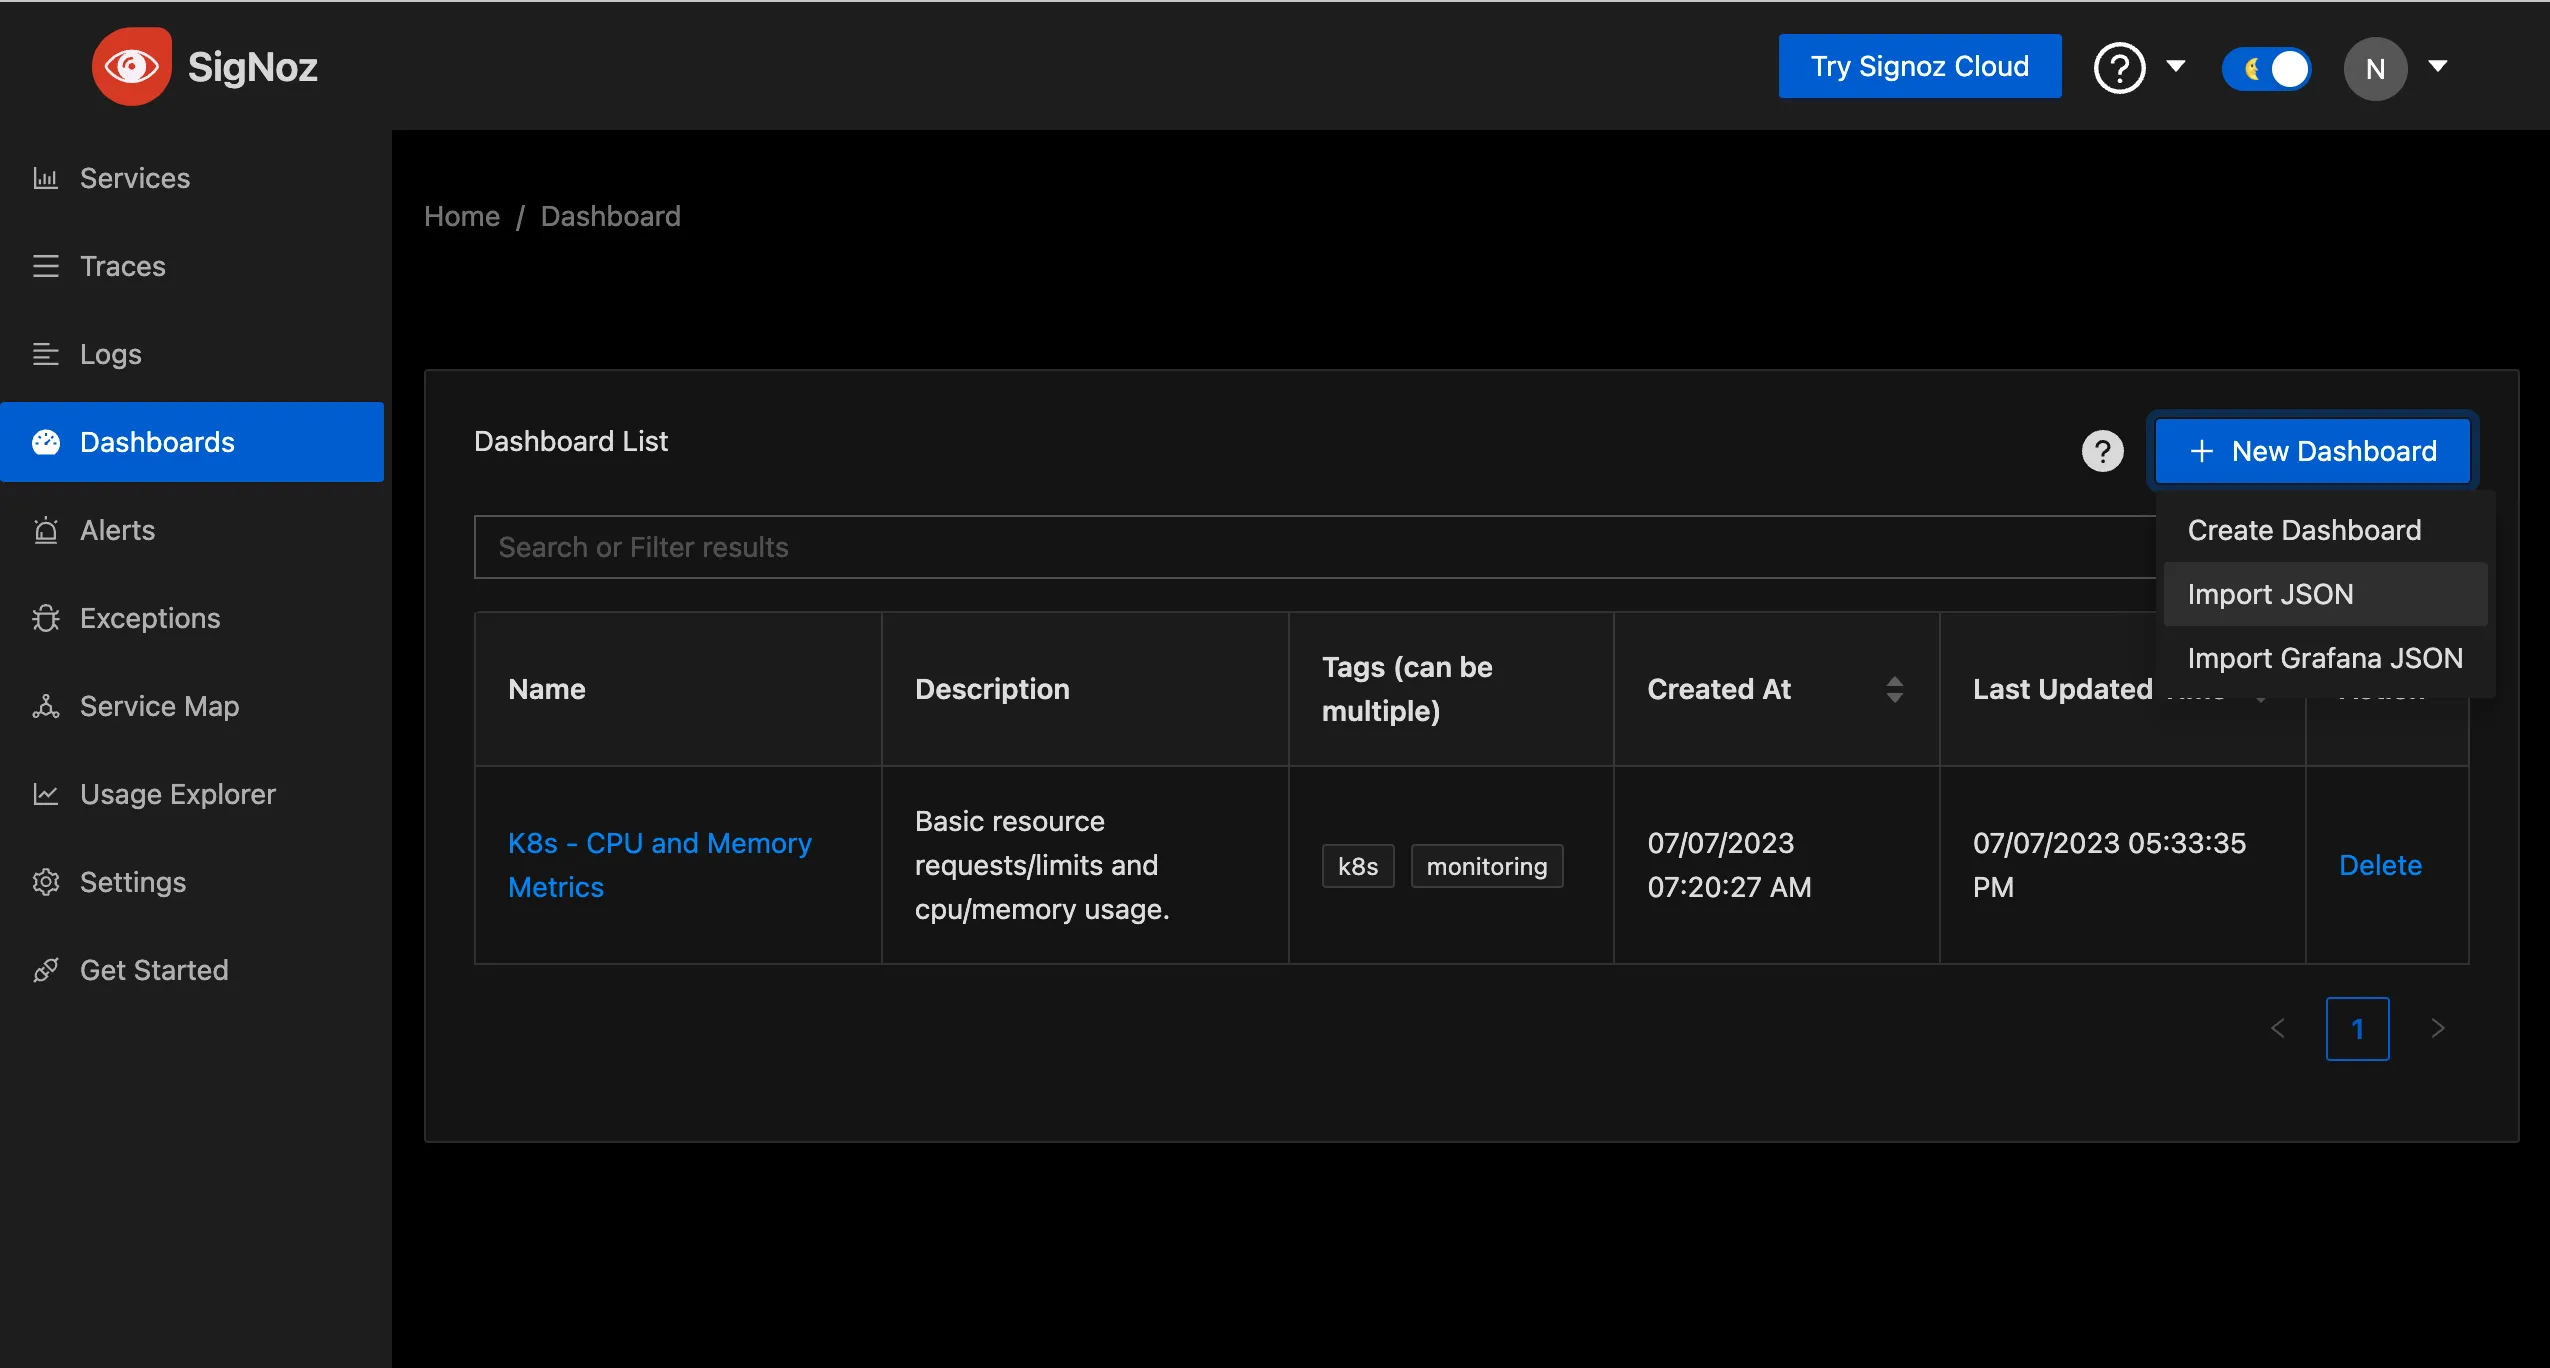
- Paste in your JSON, save, and view your cluster’s data.
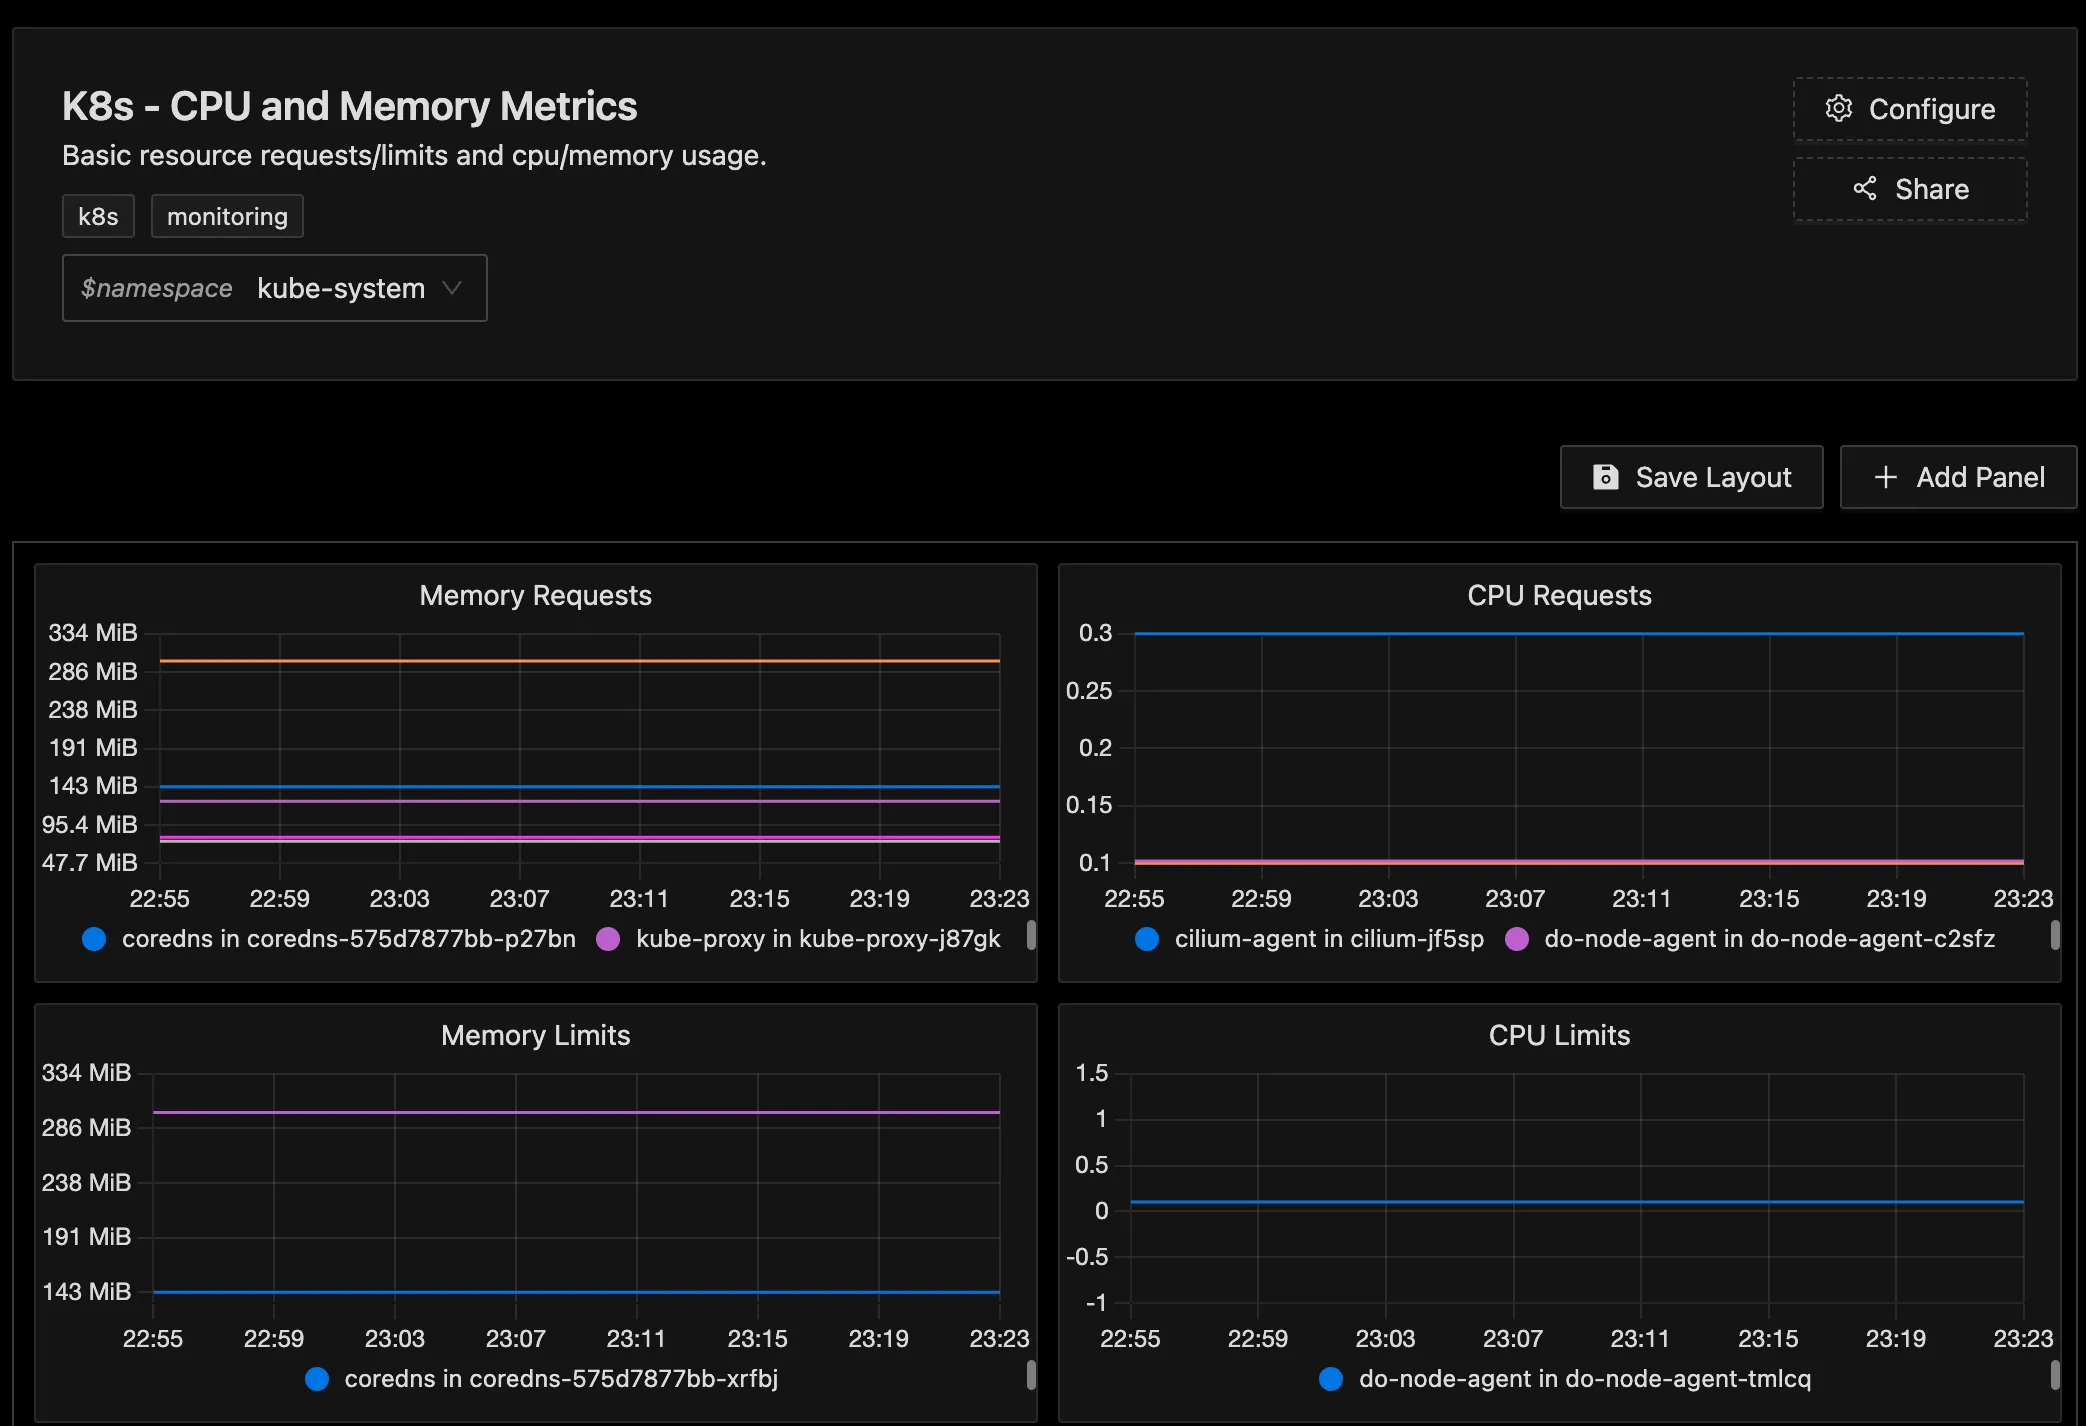
don’t forget to select a namespace to view!
Wrapping up
Now that you've got basic metrics flowing both from your cluster infrastructure and your application on your Kubernetes cluster, you can go further with our operating kubernetes guide. If you're excited about SigNoz and want to go deeper, join the SigNoz slack to be part of this awesome open source community!
