Kubernetes Cluster Monitoring with OpenTelemetry | Complete Tutorial
For a more comprehensive, modern, and automated guide using the official OpenTelemetry Helm charts, check out our new definitive tutorial: Kubernetes Observability with OpenTelemetry.
Monitoring Kubernetes cluster metrics ensures your containerized infrastructure operates as it should. By tracking essential indicators like CPU utilization, memory consumption, and pod/node statuses, you gain insights to proactively address issues, optimize resources, and maintain overall health. In this tutorial, you will configure OpenTelemetry Collector to collect Kubernetes cluster metrics and send them to SigNoz for monitoring and visualization.

In this tutorial, we cover:
- What is a Kubernetes cluster?
- What is OpenTelemetry
- What is OpenTelemetry Collector?
- How does OpenTelemetry Collector collect data?
- Collecting Kubernetes Cluster Metrics with OpenTelemetry Collector
- Setting up SigNoz
- Creating manifest files
- Monitoring Kubernetes cluster metrics with SigNoz dashboard
- Reference: Metrics and Attributes for Kubernetes Cluster supported by OpenTelemetry
- Conclusion
If you want to jump straight into implementation, start with this prerequisites section.
What is a Kubernetes cluster?
A Kubernetes cluster is a set of nodes (physical or virtual machines) that run containerized applications orchestrated by Kubernetes. Kubernetes, often abbreviated as K8s, is an open-source container orchestration platform designed to automate the deployment, scaling, and management of containerized applications. It provides a framework for efficiently running multiple containers across a cluster of machines.
What is OpenTelemetry
OpenTelemetry is a set of APIs, SDKs, libraries, and integrations aiming to standardize the generation, collection, and management of telemetry data(logs, metrics, and traces). It is backed by the Cloud Native Computing Foundation and is the leading open-source project in the observability domain.
The data you collect with OpenTelemetry is vendor-agnostic and can be exported in many formats. Telemetry data has become critical in observing the state of distributed systems. With microservices and polyglot architectures, there was a need to have a global standard. OpenTelemetry aims to fill that space and is doing a great job at it thus far.
What is OpenTelemetry Collector?
OpenTelemetry Collector is a stand-alone service provided by OpenTelemetry. It can be used as a telemetry-processing system with a lot of flexible configurations that gather and process observability data, such as traces, metrics, and logs, from different parts of a software system. It then sends this data to chosen destinations, allowing for centralized analysis and monitoring. The collector simplifies the task of collecting and exporting telemetry data in cloud-native environments.
How does OpenTelemetry Collector collect data?
Data collection in OpenTelemetry Collector is facilitated through receivers. Receivers are configured via YAML under the top-level receivers tag. To ensure a valid configuration, at least one receiver must be enabled.
Below is an example of an otlp receiver:
receivers:
  otlp:
    protocols:
      grpc:
      http:
The OTLP receiver accepts data through gRPC or HTTP in the OTLP format. There are advanced configurations that you can enable via the YAML file.
Here’s a sample configuration for an otlp receiver:
receivers:
  otlp:
    protocols:
      http:
        endpoint: "localhost:4318"
        cors:
          allowed_origins:
            - http://test.com
            # Origins can have wildcards with *, use * by itself to match any origin.
            - https://*.example.com
          allowed_headers:
            - Example-Header
          max_age: 7200
You can find more details on advanced configurations here.
Once a receiver is configured, it needs to be enabled to start the data flow. This involves setting up pipelines within a service. A pipeline acts as a streamlined pathway for data, outlining how it should be processed and where it should go. A pipeline comprises the following:
- Receivers: These are entry points for data into the OpenTelemetry Collector, responsible for collecting data from various sources and feeding it into the pipeline.
- Processors: After data is received, processors manipulate, filter, or enhance the data as needed before it proceeds further in the pipeline. They provide a way to customize the data according to specific requirements.
- Exporters: After processing, the data is ready for export. Exporters define the destination for the data, whether it's an external monitoring system, storage, or another service. They format the data appropriately for the chosen output.
Below is an example pipeline configuration:
service:
  pipelines:
    metrics:
      receivers: [otlp, prometheus]
      processors: [batch]
      exporters: [otlp, prometheus]
Here’s a breakdown of the above metrics pipeline:
- Receivers: This pipeline is configured to receive metrics data from two sources: OTLP and Prometheus. The
otlpreceiver collects metrics using both gRPC and HTTP protocols, while theprometheusreceiver gathers metrics from Prometheus. - Processors: Metrics data is processed using the
batchprocessor. This processor likely batches metrics before exporting them, optimizing the data flow. - Exporters: Metrics processed through this pipeline are exported to both OTLP and Prometheus destinations. The
otlpexporter sends data to an endpoint specified in the configuration, and theprometheusexporter handles the export of metrics to a Prometheus-compatible destination.
Collecting Kubernetes Cluster Metrics with OpenTelemetry Collector
In this section, you will learn how Kubernetes cluster metrics can be collected with the OpenTelemetry Collector and how to visualize the collected metrics in Signoz.
Prerequisites
- A Kubernetes cluster
- A SigNoz cloud account
Setting up SigNoz
You need a backend to which you can send the collected data for monitoring and visualization. SigNoz is an OpenTelemetry-native APM that is well-suited for visualizing OpenTelemetry data.
SigNoz cloud is the easiest way to run SigNoz. You can sign up here for a free account and get 30 days of unlimited access to all features.
You can also install and self-host SigNoz yourself. Check out the docs for installing self-host SigNoz.
Creating manifest files
In a Kubernetes environment, manifest files are utilized for deploying various Kubernetes resources. Several manifest files will be created to deploy the OpenTelemetry Collector within a Kubernetes cluster:
- configmap
- service account
- cluster role
- cluster role binding
- deployment
These files serve as a declarative configuration, defining the desired state of the resources such as deployments, services, and config maps, facilitating the efficient deployment and management of the OpenTelemetry Collector components in a Kubernetes environment.
Configmap
A ConfigMap is an API resource that provides a way to store configuration data in key-value pairs. ConfigMaps are often used to store non-sensitive configuration information, such as configuration files, environment variables, or any configuration data that your application needs.
Here, a configmap will be used for the OpenTelemetry Collector setup. In your terminal, create a configmap.yml file and paste the below content:
apiVersion: v1
kind: ConfigMap
metadata:
  name: otelcontribcol
  labels:
    app: otelcontribcol
data:
  config.yaml: |
    receivers:
      k8s_cluster:
        collection_interval: 10s
    exporters:
      debug:
      otlp:
        endpoint: "ingest.{region}.signoz.cloud:443"
        tls:
          insecure: false
        timeout: 20s # Adjust the timeout value as needed
        headers:
          "signoz-ingestion-key": "<SIGNOZ_INGESTION_KEY>"
    service:
      pipelines:
        metrics:
          receivers: [k8s_cluster]
          exporters: [debug, otlp]
        logs/entity_events:
          receivers: [k8s_cluster]
          exporters: [debug, otlp]This above manifest sets up OpenTelemetry instrumentation for collecting Kubernetes-related metrics and logs. It uses a custom "otlp" exporter to send the collected data to a specified endpoint with additional authentication through a provided ingestion key.
This configuration sets up OpenTelemetry instrumentation for collecting Kubernetes-related metrics and logs. It uses a custom "otlp" exporter to send the collected data to a specified endpoint with additional authentication through a provided ingestion key.
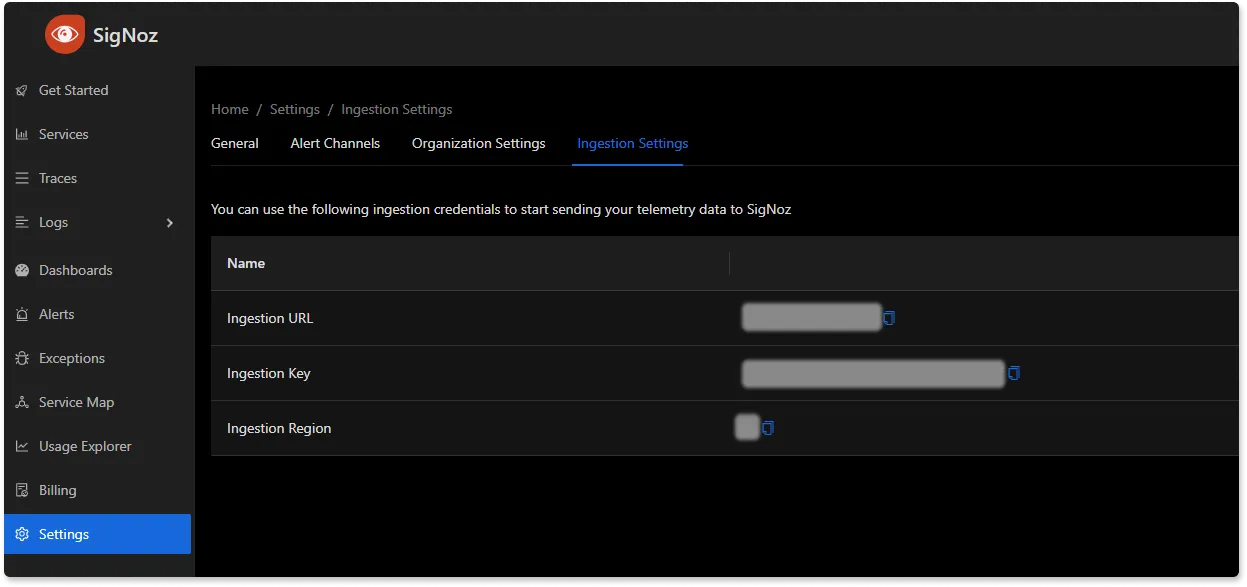
Replace {region} with the region for your SigNoz cloud account and <SIGNOZ_INGESTION_KEY> with the ingestion key for your account. You can find these settings in the SigNoz dashboard under Settings > Ingestion Settings.
Create the configmap:
kubectl apply -f configmap.yml
Service Account
A ServiceAccount is a Kubernetes object that provides an identity for processes running in a Pod. It defines the permissions and access scope for the processes within the cluster.
In your terminal, create a serviceaccount.yml file and paste the below content:
apiVersion: v1;
kind: ServiceAccount;
metadata: labels: app: otelcontribcol;
name: otelcontribcol;
The above configuration defines a ServiceAccount named "otelcontribcol" which provides an identity for pods or processes running within the cluster and can be referenced by other Kubernetes objects, such as Deployments or Pods, to define the set of permissions and access scope for those objects.
Create the service account:
kubectl apply -f serviceaccount.yml
Cluster Role
A ClusterRole is a set of permissions that can be assigned to resources within a Kubernetes cluster. It defines what actions are allowed on which resources in the cluster.
In your terminal, create a clusterrole.yml file and paste the below content:
apiVersion: rbac.authorization.k8s.io/v1
kind: ClusterRole
metadata:
  name: otelcontribcol
  labels:
    app: otelcontribcol
rules:
- apiGroups:
  - ""
  resources:
  - events
  - namespaces
  - namespaces/status
  - nodes
  - nodes/spec
  - pods
  - pods/status
  - replicationcontrollers
  - replicationcontrollers/status
  - resourcequotas
  - services
  verbs:
  - get
  - list
  - watch
- apiGroups:
  - apps
  resources:
  - daemonsets
  - deployments
  - replicasets
  - statefulsets
  verbs:
  - get
  - list
  - watch
- apiGroups:
  - extensions
  resources:
  - daemonsets
  - deployments
  - replicasets
  verbs:
  - get
  - list
  - watch
- apiGroups:
  - batch
  resources:
  - jobs
  - cronjobs
  verbs:
  - get
  - list
  - watch
- apiGroups:
    - autoscaling
  resources:
    - horizontalpodautoscalers
  verbs:
    - get
    - list
    - watch
Create the cluster role:
kubectl apply -f clusterrole.yml
Cluster Role Binding
A ClusterRoleBinding binds a ClusterRole to a user, group, or service account within the entire cluster. It grants the defined set of permissions to the specified identity.
In your terminal, create a clusterrolebinding.yml file and paste the below content:
apiVersion: rbac.authorization.k8s.io/v1
kind: ClusterRoleBinding
metadata:
  name: otelcontribcol
  labels:
    app: otelcontribcol
roleRef:
  apiGroup: rbac.authorization.k8s.io
  kind: ClusterRole
  name: otelcontribcol
subjects:
- kind: ServiceAccount
  name: otelcontribcol
  namespace: default
In the provided configuration, the ClusterRoleBinding establishes a connection between the previously defined ClusterRole and the ServiceAccount. This binding ensures that the permissions and access rights specified in the ClusterRole are associated with the ServiceAccount, allowing it to perform actions within the cluster as defined by the role.
Create the cluster role binding:
kubectl apply -f clusterrolebinding.yml
Deployment
A Deployment is a Kubernetes resource that defines how to create, update, and scale a set of Pods. It ensures the desired number of replicas are running and manages rolling updates.
In your terminal, create a deployment.yml file and paste the below content:
apiVersion: apps/v1
kind: Deployment
metadata:
  name: otelcontribcol
  labels:
    app: otelcontribcol
spec:
  replicas: 1
  selector:
    matchLabels:
      app: otelcontribcol
  template:
    metadata:
      labels:
        app: otelcontribcol
    spec:
      serviceAccountName: otelcontribcol
      containers:
      - name: otelcontribcol
        image: otel/opentelemetry-collector-contrib
        args: ["--config", "/etc/config/config.yaml"]
        volumeMounts:
        - name: config
          mountPath: /etc/config
        imagePullPolicy: IfNotPresent
      volumes:
        - name: config
          configMap:
            name: otelcontribcol
The provided Deployment configuration creates an instance of the "otelcontribcol" application within the cluster. The deployment specifies one replica, associates it with the ServiceAccount created earlier, and mounts the ConfigMap created earlier as a volume that will be used to set up the OpenTelemtry Collector within the Deployment.
Create the deployment:
kubectl apply -f deployment.yml
The deployment will create a replica set which in turn creates a pod based on the desired number of replicas. Fetch the logs of the pod to confirm that the OpenTelemetry Collector is working fine. The log output should be as below:
Users-MacBook-Pro-2:k8s demo$ kubectl logs otelcontribcol-764d65d6d5-mkv97
2023-11-27T23:32:56.927Z        info    service@v0.89.0/telemetry.go:85 Setting up own telemetry...
2023-11-27T23:32:56.929Z        info    service@v0.89.0/telemetry.go:202        Serving Prometheus metrics      {"address": ":8888", "level": "Basic"}
2023-11-27T23:32:56.929Z        info    exporter@v0.89.0/exporter.go:275        Development component. May change in the future.        {"kind": "exporter", "data_type": "metrics", "name": "debug"}
2023-11-27T23:32:56.930Z        info    exporter@v0.89.0/exporter.go:275        Development component. May change in the future.        {"kind": "exporter", "data_type": "logs", "name": "debug"}
2023-11-27T23:32:56.935Z        info    service@v0.89.0/service.go:143  Starting otelcol-contrib...     {"Version": "0.89.0", "NumCPU": 12}
2023-11-27T23:32:56.935Z        info    extensions/extensions.go:34     Starting extensions...
2023-11-27T23:32:56.972Z        info    k8sclusterreceiver@v0.89.0/receiver.go:53       Starting shared informers and wait for initial cache sync.      {"kind": "receiver", "name": "k8s_cluster", "data_type": "logs"}
2023-11-27T23:32:56.973Z        info    service@v0.89.0/service.go:169  Everything is ready. Begin running and processing data.
2023-11-27T23:32:57.075Z        info    k8sclusterreceiver@v0.89.0/receiver.go:74       Completed syncing shared informer caches.       {"kind": "receiver", "name": "k8s_cluster", "data_type": "logs"}
You can find more information on OpenTelemetry Kubernetes receiver here.
Monitoring Kubernetes cluster metrics with SigNoz dashboard
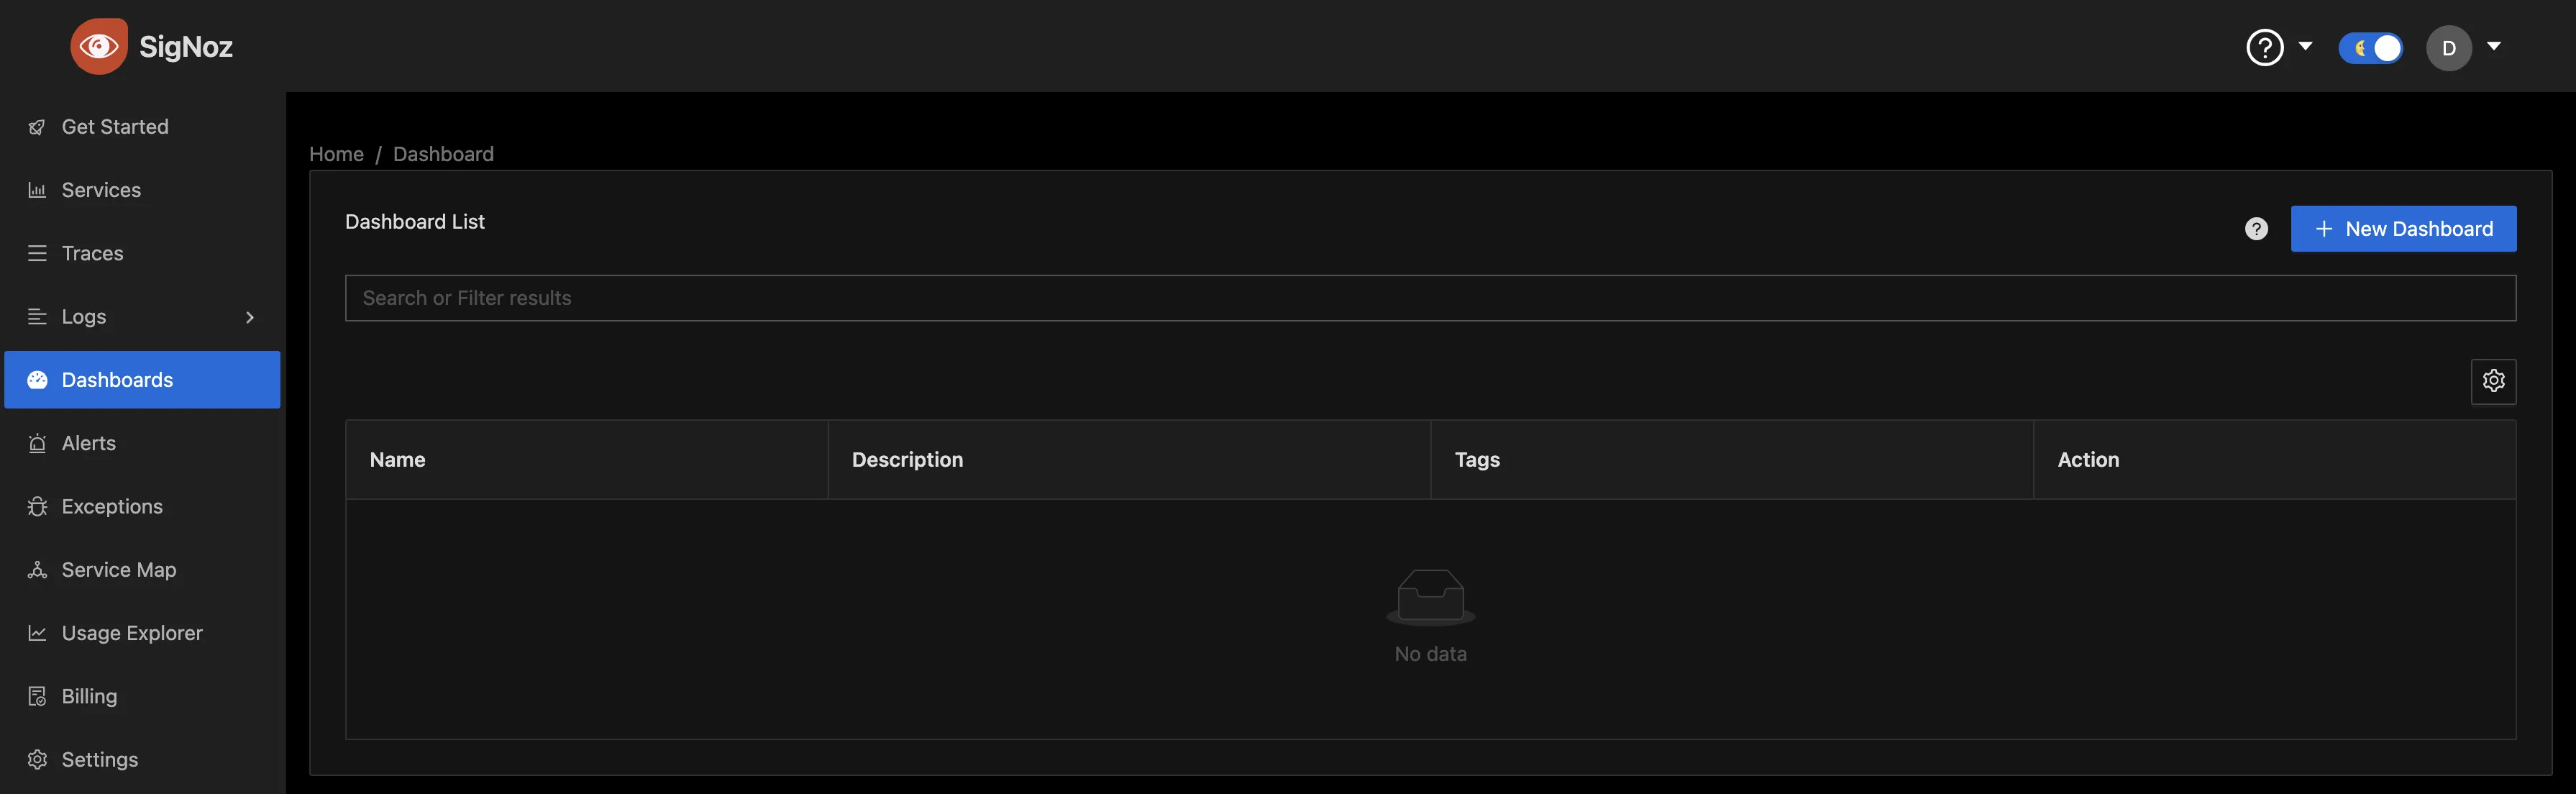
Once the collector service has been started successfully, navigate to your SigNoz Cloud account and access the "Dashboard" tab. Click on the “New Dashboard” button to create a new dashboard.
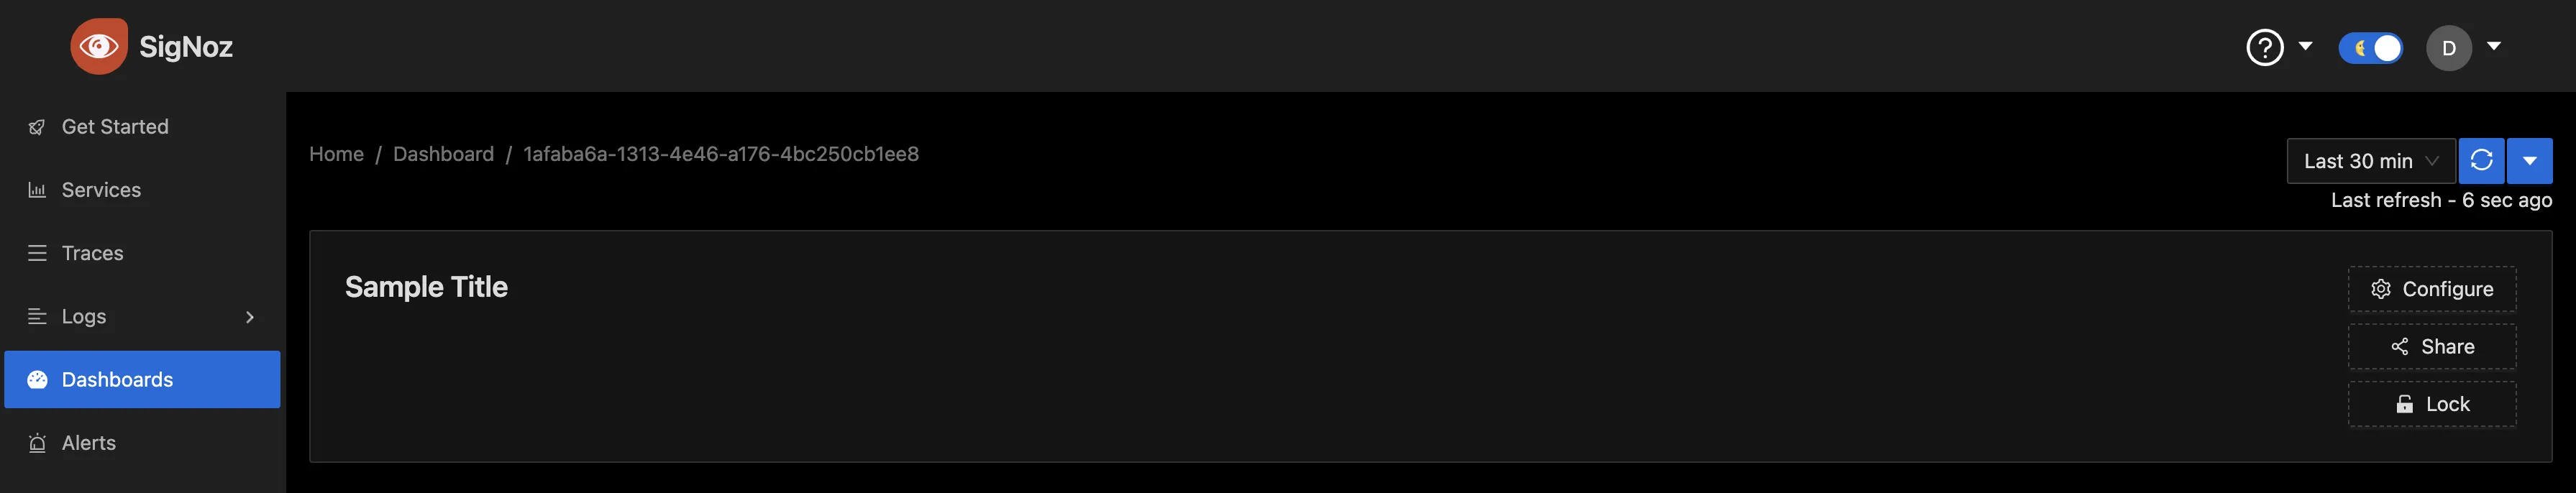
To give the dashboard a name, click on “Configure.”
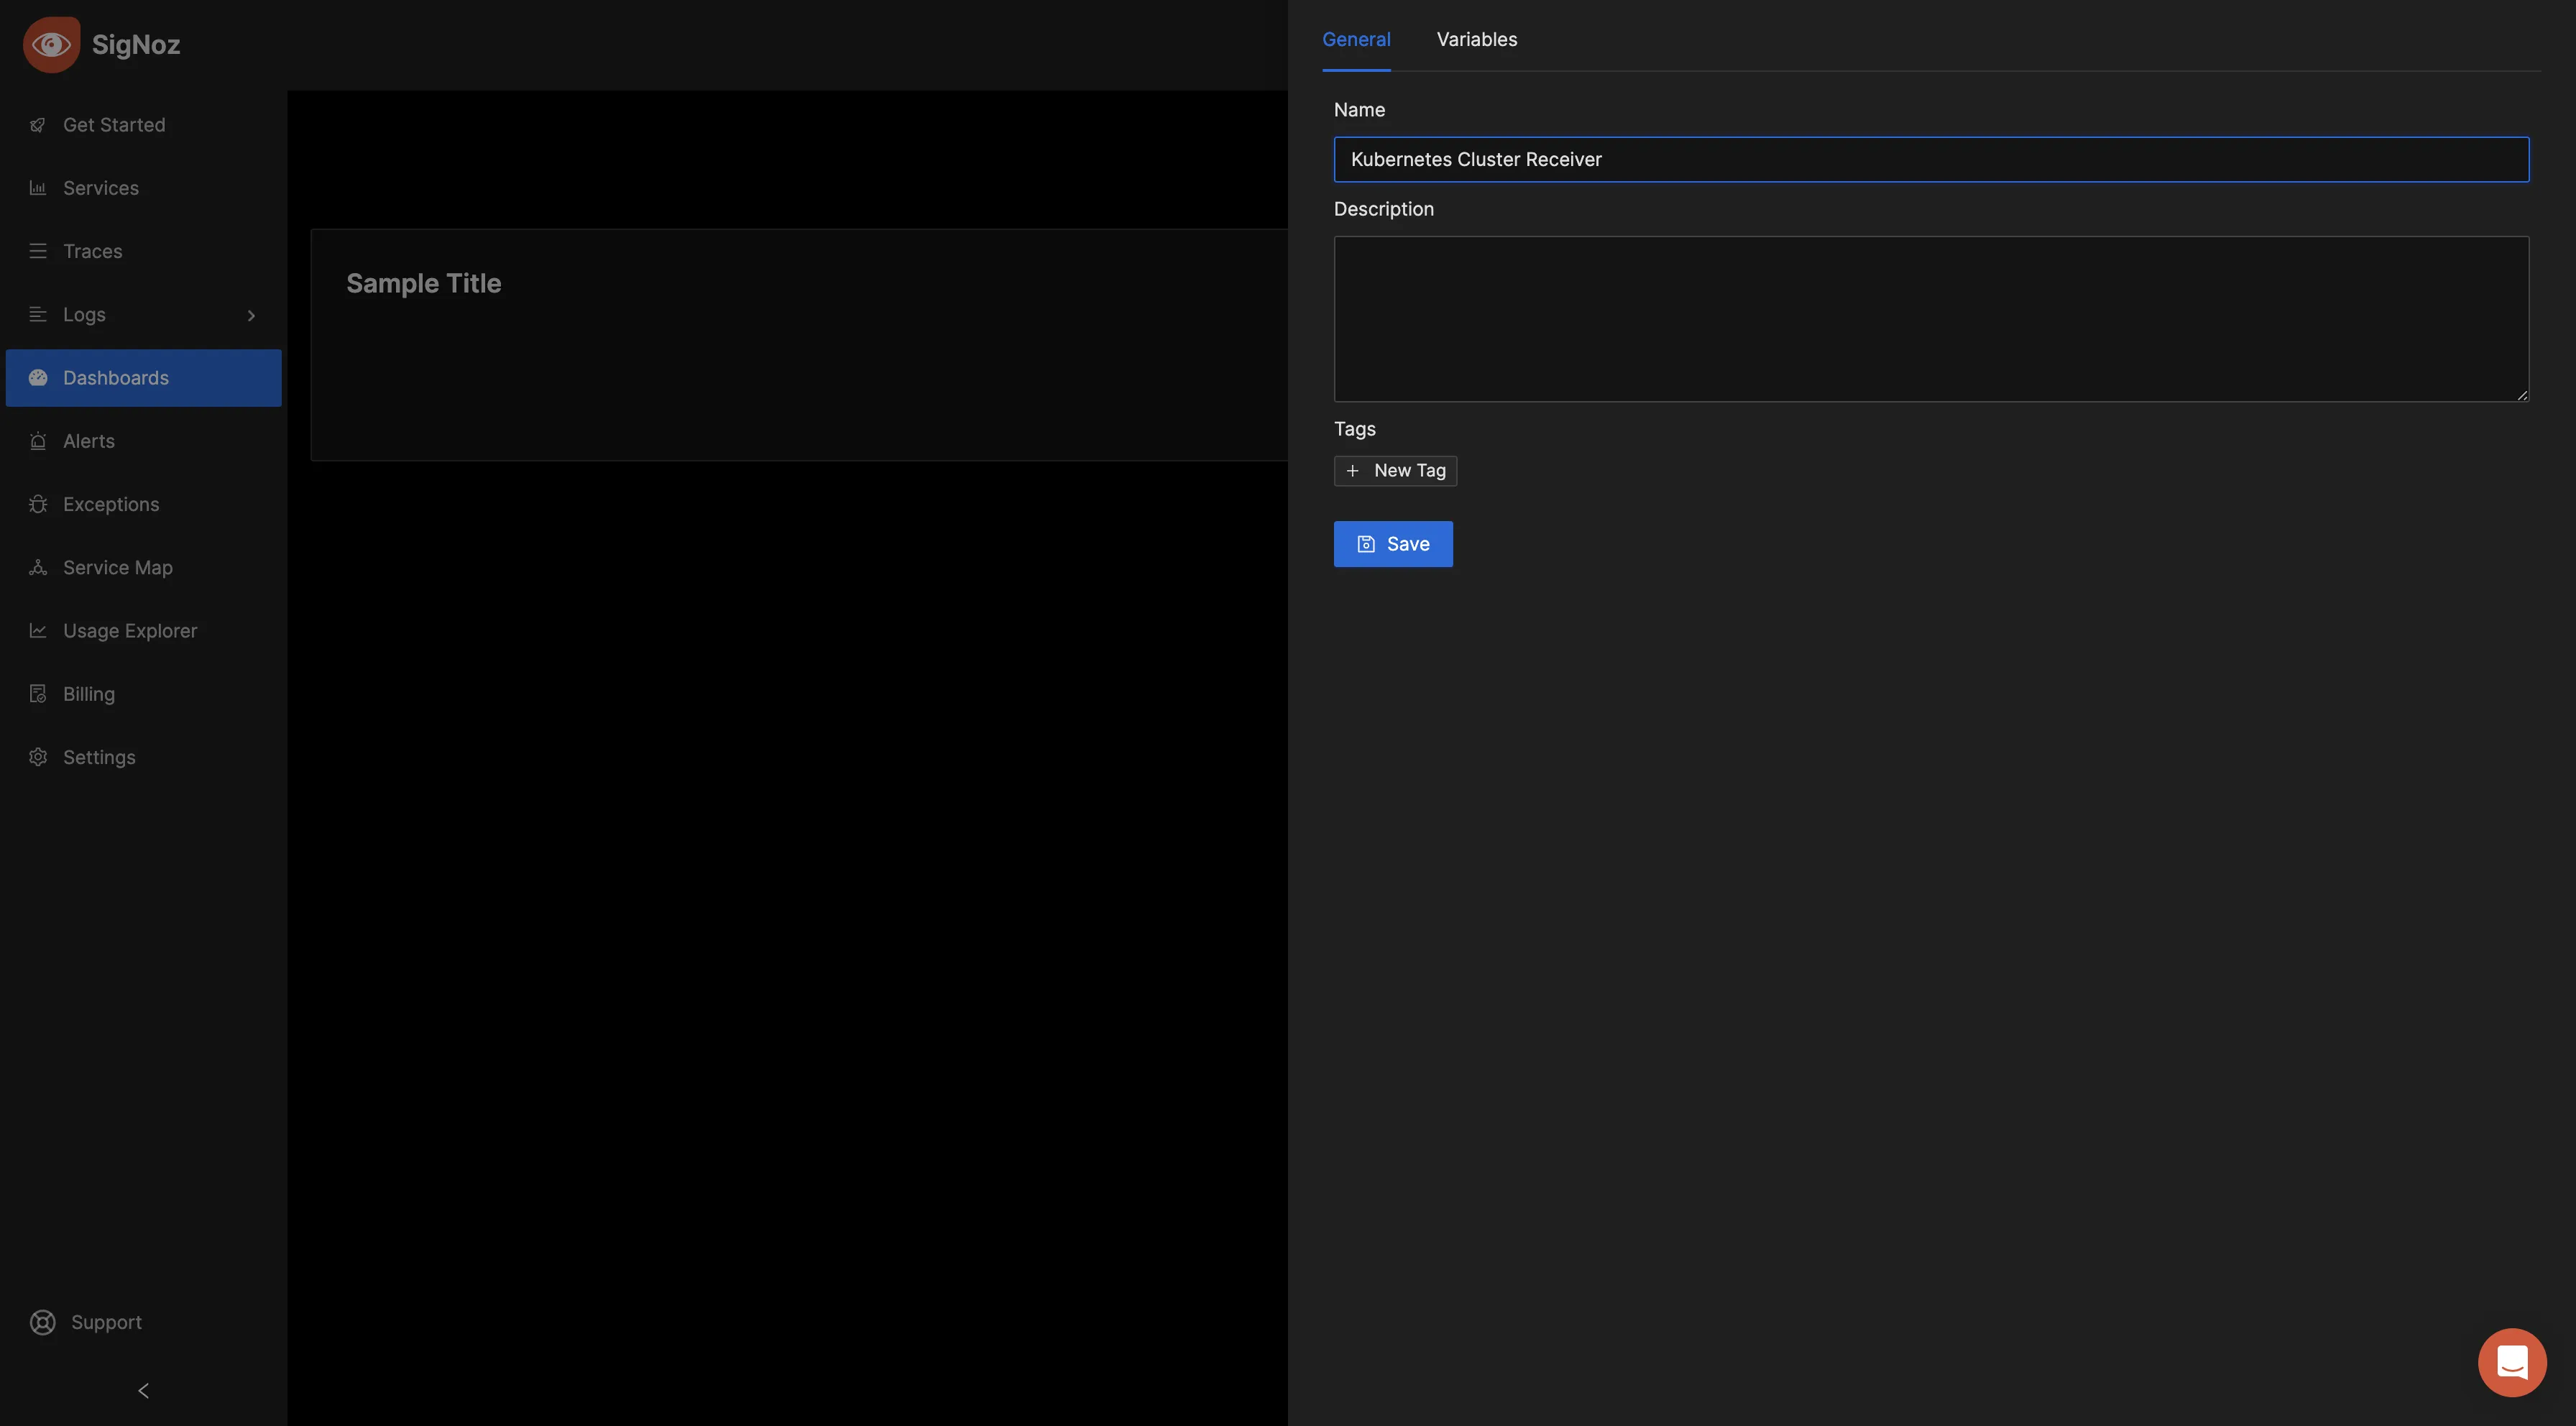
Enter your preferred dashboard name in the "Name" input box and save the changes.
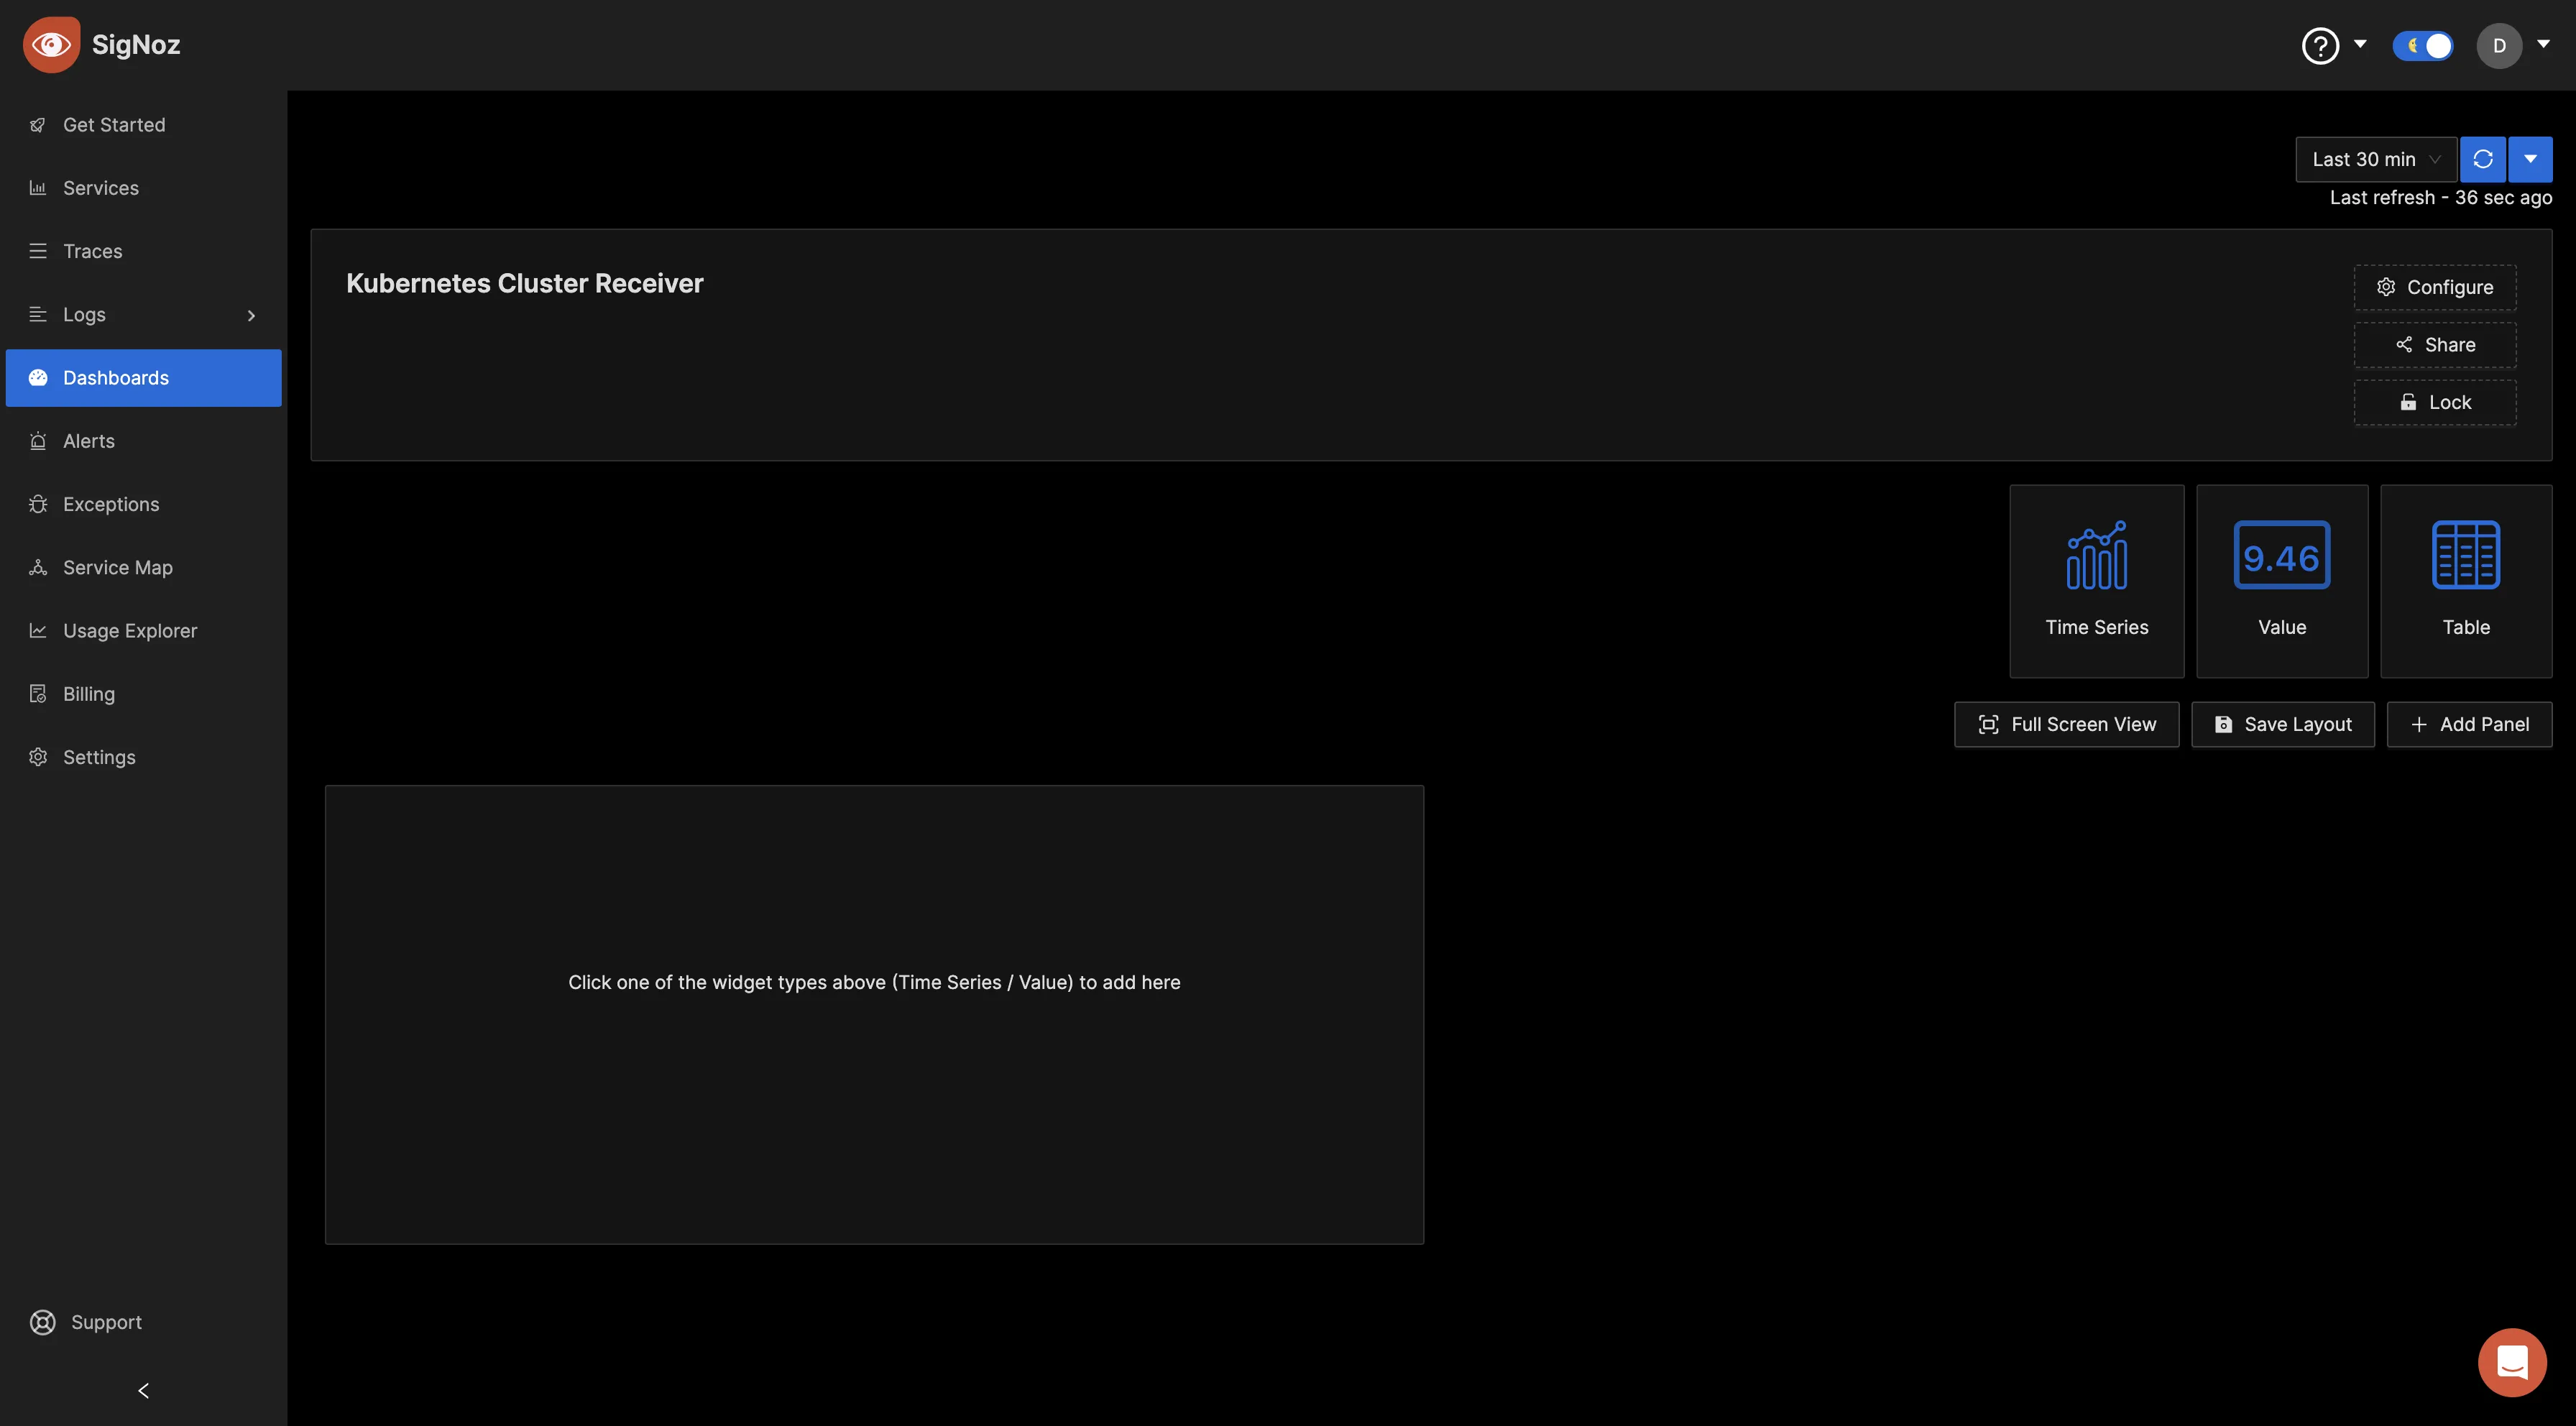
Now, you can create various panels for your dashboard. There are three visualization options to display your data: Time Series, Value, and Table formats. Choose the format that best suits your preferences, depending on the metric you want to monitor. You can opt for the "Time Series" visualization for the initial metric.
In the "Query Builder" tab, enter "k8s," and you should see various Kubernetes metrics. This confirms that the OpenTelemetry Collector is successfully collecting the Kubernetes cluster metrics and forwarding them to SigNoz for monitoring and visualization.
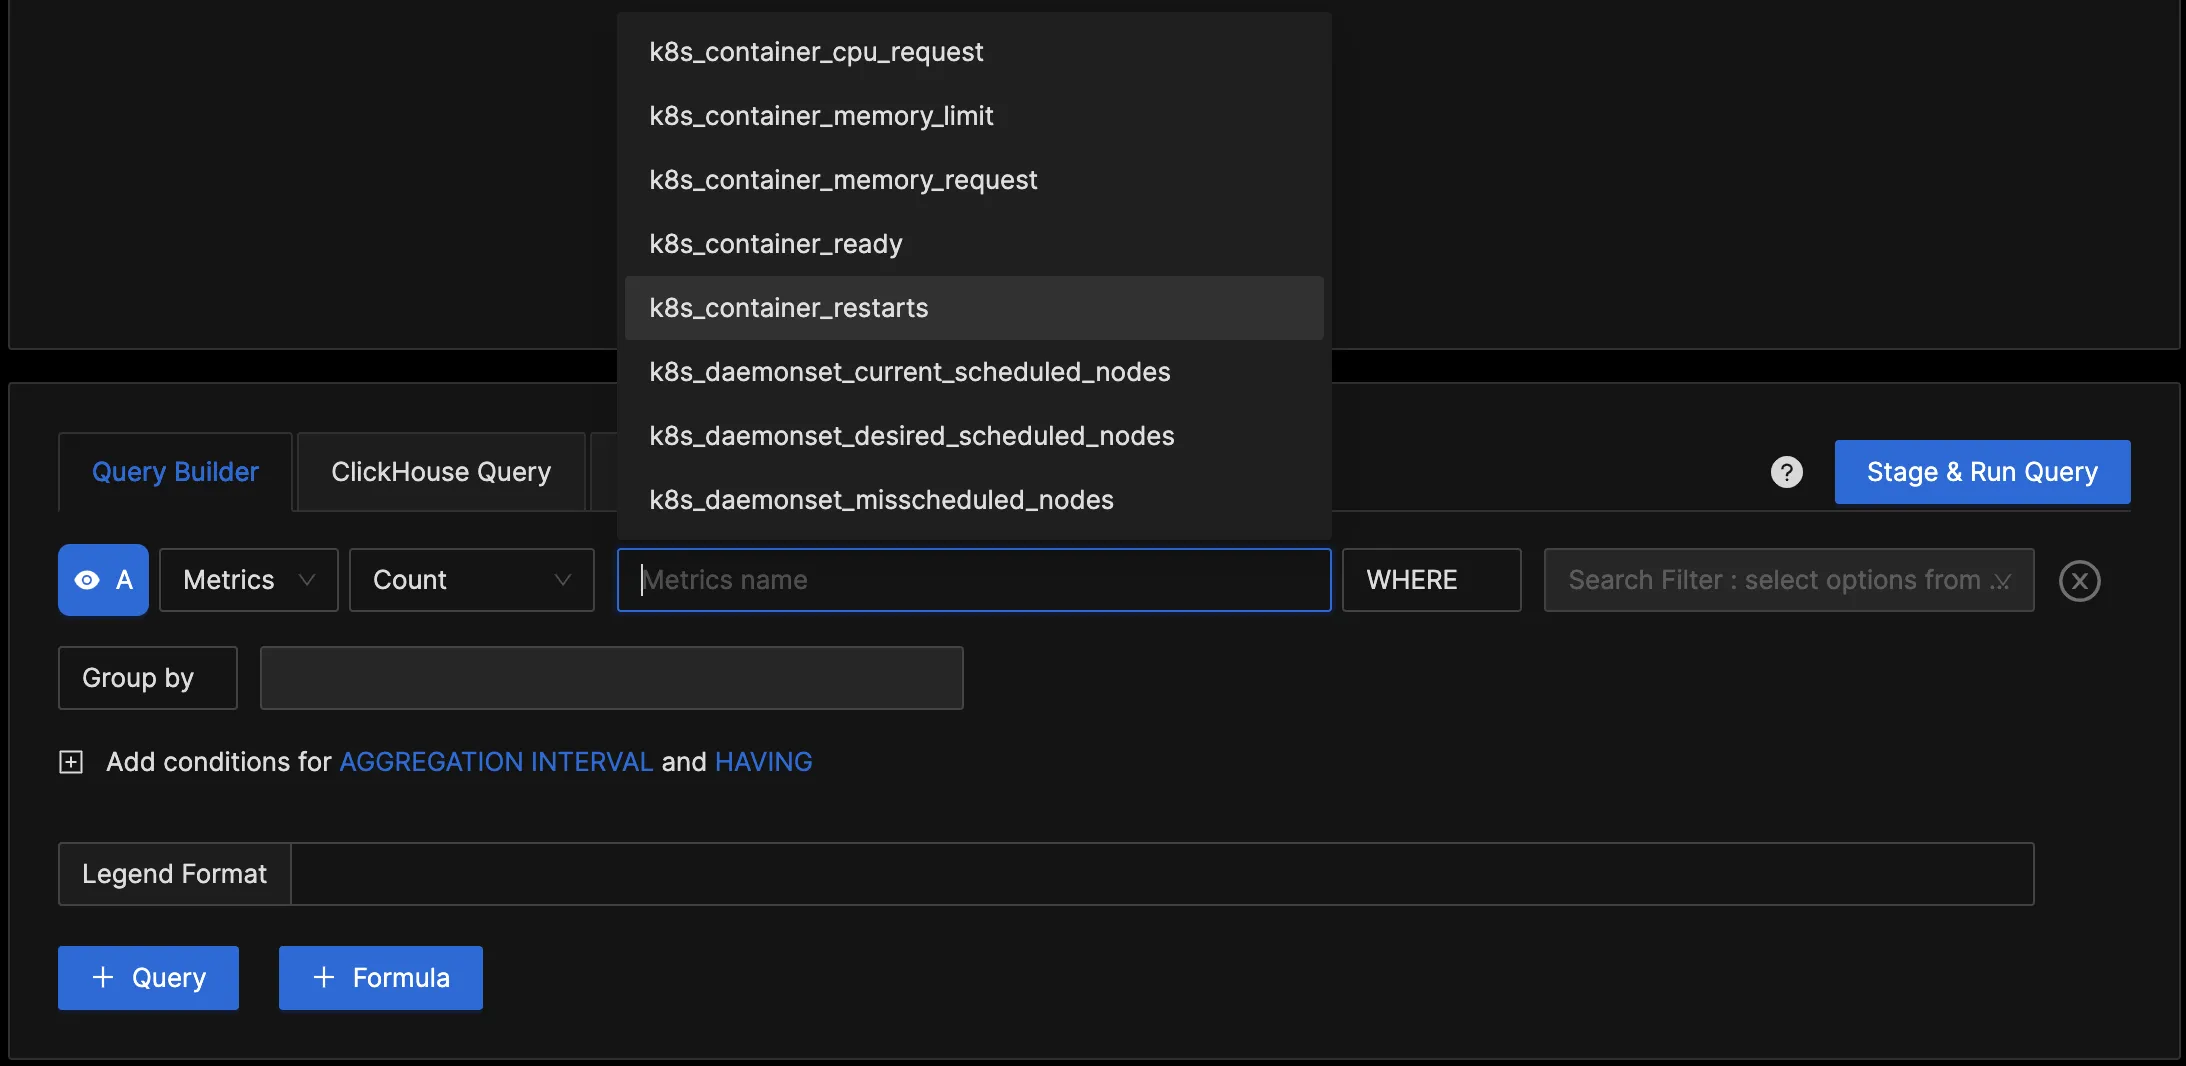
You can query the collected metrics using the query builder and create panels for your dashboard.
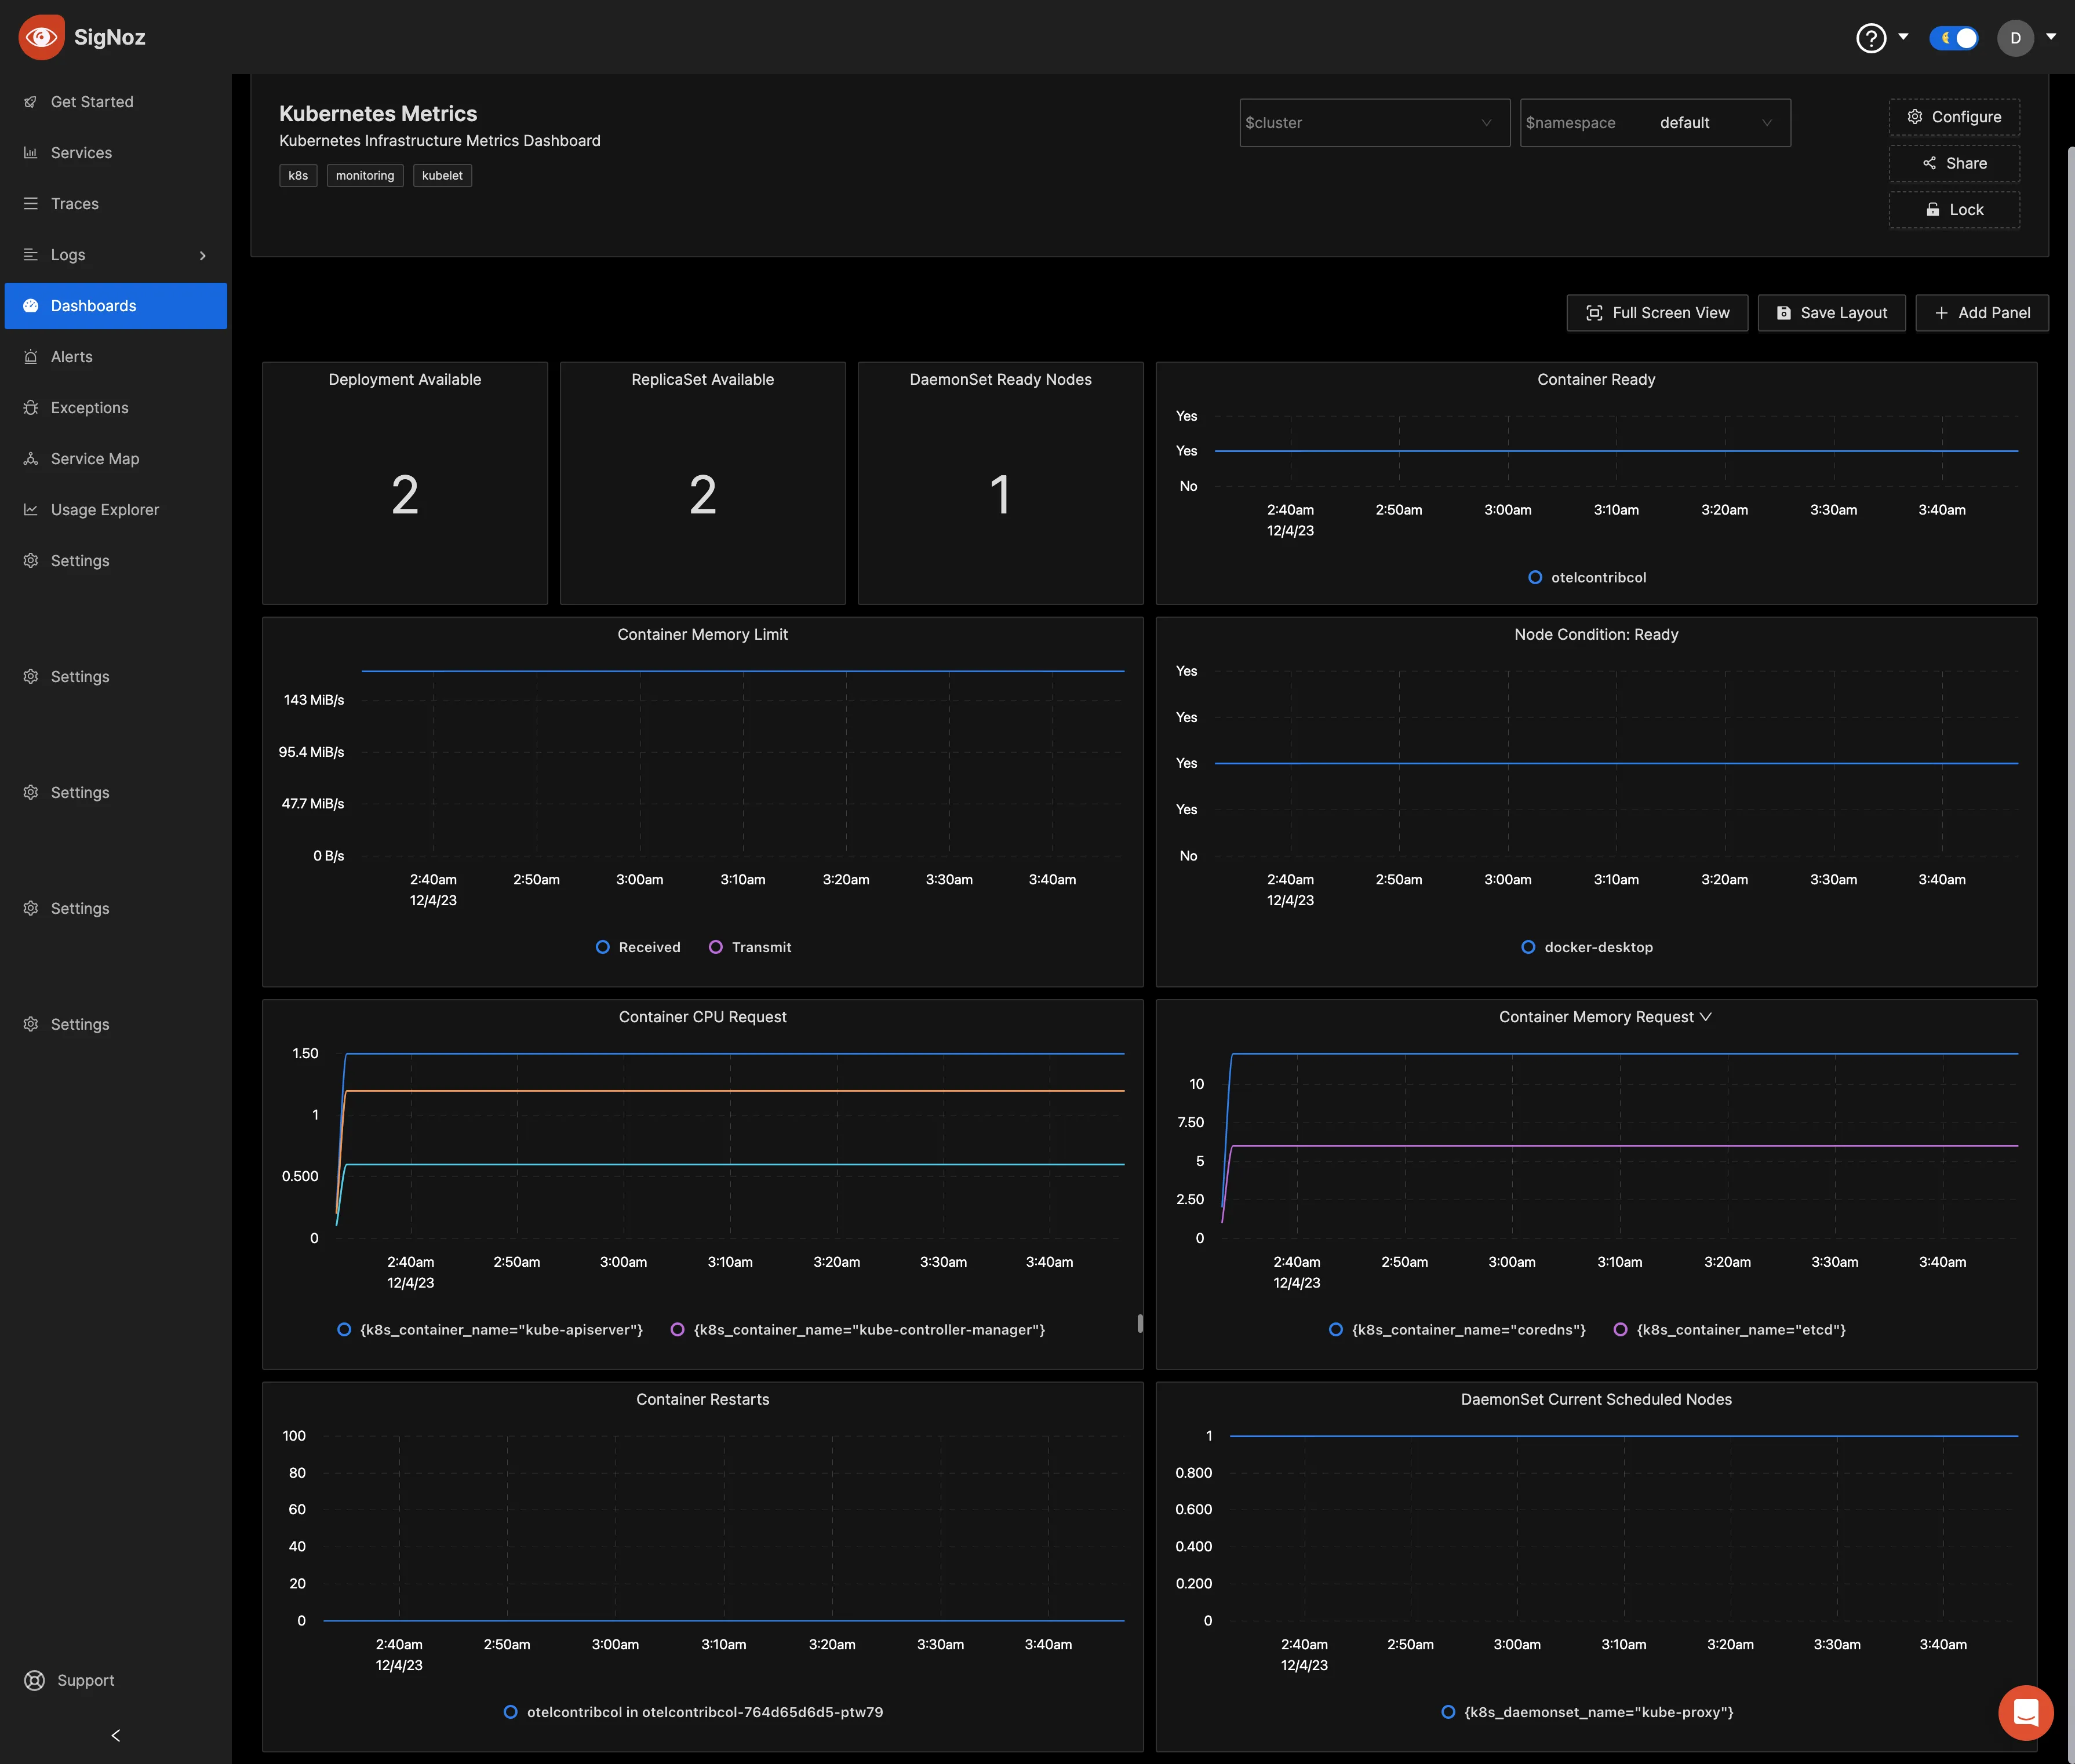
Visit the SigNoz documentation to learn more about creating dashboards and running queries.
Besides just setting up dashboards to monitor your Kubernetes cluster metrics, you can create alerts for the different metrics you query. Click on the drop-down of the panel from your dashboard, and then click on “Create Alerts”.
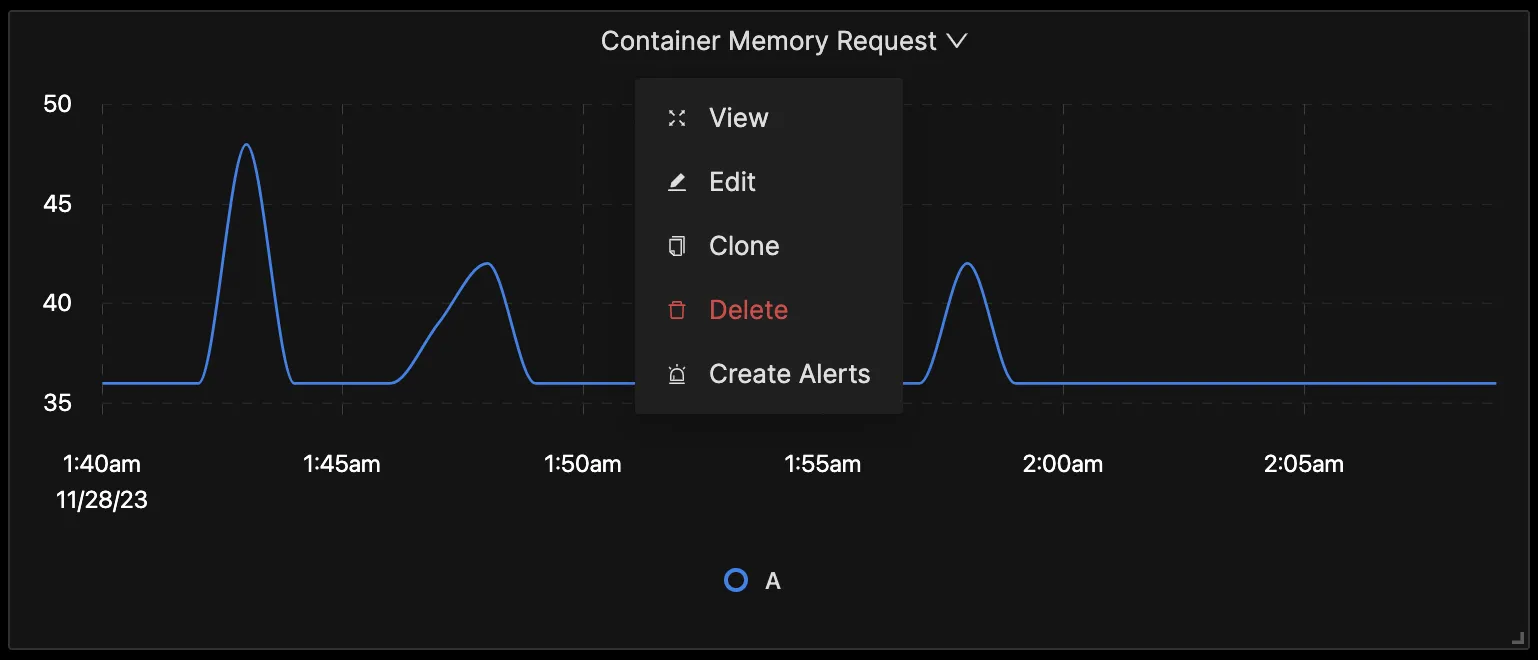
It will take you to the alerts page; from there, you can create the alerts.
Reference: Metrics and Attributes for Kubernetes Cluster supported by OpenTelemetry
The following metrics and resource attributes for the Kubernetes cluster can be collected by the OpenTelemetry Collector.
Metrics
These metrics are enabled by default. Collectors provide many metrics that you can use to monitor how your Kubernetes cluster and its resources are performing or if something is not right.
Key Terms for Metrics & Attributes
- Metric Name: The name of the metric is a unique identifier that distinguishes it from other metrics. It helps in referencing and organizing various metrics on SigNoz as well.
- Metric Type: The type of metric defines the kind of data it represents. The metric type indicates the type of data that the metric measures. some common metric types include gauge, counter, sum, and histogram.
- Value Type: The value type indicates the type of data that is used to represent the value of the metric. Some common value types are integer and double.
- Unit: The unit specifies the measurement unit associated with the metric. It helps in interpreting and comparing metric values, including Bytes, NONE, etc.
| Metrics | Description | Metrics Name | Metric Type | Value Type | Unit |
|---|---|---|---|---|---|
| Container CPU Limit | Maximum CPU limit assigned to a container | k8s.container.cpu_limit | Gauge | Double | {cpu} |
| Container CPU Request | CPU resources requested by a container | k8s.container.cpu_request | Gauge | Double | {cpu} |
| Container Ephemeral Storage Limit | Maximum ephemeral storage limit for a container | k8s.container.ephemeralstorage_limit | Gauge | Int | By |
| Container Ephemeral Storage Request | Ephemeral storage requested by a container | k8s.container.ephemeralstorage_request | Gauge | Int | By |
| Container Memory Limit | Maximum memory limit assigned to a container | k8s.container.memory_limit | Gauge | Int | By |
| Container Memory Request | Memory resources requested by a container | k8s.container.memory_request | Gauge | Int | By |
| Container Ready | Indicates if a container is ready | k8s.container.ready | Gauge | Int | |
| Container Restarts | Number of restarts for a container | k8s.container.restarts | Gauge | Int | {restart} |
| Container Storage Limit | Maximum storage limit for a container | k8s.container.storage_limit | Gauge | Int | By |
| Container Storage Request | Storage resources requested by a container | k8s.container.storage_request | Gauge | Int | By |
| CronJob Active Jobs | Number of active jobs for a CronJob | k8s.cronjob.active_jobs | Gauge | Int | {job} |
| DaemonSet Current Scheduled Nodes | Number of nodes currently scheduled by a DaemonSet | k8s.daemonset.current_scheduled_nodes | Gauge | Int | {node} |
| DaemonSet Desired Scheduled Nodes | Desired number of nodes to be scheduled by a DaemonSet | k8s.daemonset.desired_scheduled_nodes | Gauge | Int | {node} |
| DaemonSet Misscheduled Nodes | Number of nodes misscheduled by a DaemonSet | k8s.daemonset.misscheduled_nodes | Gauge | Int | {node} |
| DaemonSet Ready Nodes | Number of nodes ready in a DaemonSet | k8s.daemonset.ready_nodes | Gauge | Int | {node} |
| Deployment Available | Number of available pods in a Deployment | k8s.deployment.available | Gauge | Int | {pod} |
| Deployment Desired | Desired number of pods in a Deployment | k8s.deployment.desired | Gauge | Int | {pod} |
| Horizontal Pod Autoscaler (HPA) Current Replica | Current number of replicas in an HPA | k8s.hpa.current_replicas | Gauge | Int | {pod} |
| HPA Desired Replicas | Desired number of replicas in an HPA | k8s.hpa.desired_replicas | Gauge | Int | {pod} |
| HPA Max Replicas | Maximum number of replicas in an HPA | k8s.hpa.max_replicas | Gauge | Int | {pod} |
| HPA Min Replicas | Minimum number of replicas in an HPA | k8s.hpa.min_replicas | Gauge | Int | {pod} |
| Job Active Pods | Number of active pods for a Job | k8s.job.active_pods | Gauge | Int | {pod} |
| Job Desired Successful Pods | Desired number of successfully completed pods for a Job | k8s.job.desired_successful_pods | Gauge | Int | {pod} |
| Job Failed Pods | Number of failed pods for a Job | k8s.job.failed_pods | Gauge | Int | {pod} |
| Job Max Parallel Pods | Maximum parallel pods for a Job | k8s.job.max_parallel_pods | Gauge | Int | {pod} |
| Job Successful Pods | Number of successfully completed pods for a Job | k8s.job.successful_pods | Gauge | Int | {pod} |
| Namespace Phase | Phase of the Kubernetes namespace | k8s.namespace.phase | Gauge | Int | |
| Pod Phase | Phase of a Kubernetes pod | k8s.pod.phase | Gauge | Int | |
| ReplicaSet Available | Number of available pods in a ReplicaSet | k8s.replicaset.available | Gauge | Int | {pod} |
| ReplicaSet Desired | Desired number of pods in a ReplicaSet | k8s.replicaset.desired | Gauge | Int | {pod} |
| Replication Controller Available | Number of available pods in a Replication Controller | k8s.replication_controller.available | Gauge | Int | {pod} |
| Replication Controller Desired | Desired number of pods in a Replication Controller | k8s.replication_controller.desired | Gauge | Int | {pod} |
| Resource Quota Hard Limit | Hard resource limit defined in a Resource Quota | k8s.resource_quota.hard_limit | Gauge | Int | {resource} |
| Resource Quota Used | Used resource in a Resource Quota | k8s.resource_quota.used | Gauge | Int | {resource} |
| StatefulSet Current Pods | Number of current pods in a StatefulSet | k8s.statefulset.current_pods | Gauge | Int | {pod} |
| StatefulSet Desired Pods | Desired number of pods in a StatefulSet | k8s.statefulset.desired_pods | Gauge | Int | {pod} |
| StatefulSet Ready Pods | Number of ready pods in a StatefulSet | k8s.statefulset.ready_pods | Gauge | Int | {pod} |
| StatefulSet Updated Pod | Number of updated pods in a StatefulSet | k8s.statefulset.updated_pods | Gauge | Int | {pod} |
You can visit the Kubernetes cluster receiver GitHub repo to learn more about these metrics.
Resource Attributes
Resource attributes are a set of key-value pairs that provide additional context about the source of a metric. They are used to identify and classify metrics, and to associate them with specific resources or entities within a system.
The below attributes are enabled by default for a Kubernetes cluster.
| Name | Description | Values | Enabled |
|---|---|---|---|
| container.id | The container id. | Any Str | true |
| container.image.name | The container image name | Any Str | true |
| container.image.tag | The container image tag | Any Str | true |
| k8s.container.name | The k8s container name | Any Str | true |
| k8s.cronjob.name | The k8s CronJob name | Any Str | true |
| k8s.cronjob.uid | The k8s CronJob uid. | Any Str | true |
| k8s.daemonset.name | The k8s daemonset name. | Any Str | true |
| k8s.daemonset.uid | The k8s daemonset uid. | Any Str | true |
| k8s.deployment.name | The name of the Deployment. | Any Str | true |
| k8s.deployment.uid | The UID of the Deployment. | Any Str | true |
| k8s.hpa.name | The k8s hpa name. | Any Str | true |
| k8s.hpa.uid | The k8s hpa uid. | Any Str | true |
| k8s.job.name | The k8s pod name. | Any Str | true |
| k8s.job.uid | The k8s job uid. | Any Str | true |
| k8s.kubelet.version | The version of Kubelet running on the node. | Any Str | false |
| k8s.kubeproxy.version | The version of Kube Proxy running on the node. | Any Str | false |
| k8s.namespace.name | The k8s namespace name. | Any Str | true |
| k8s.namespace.uid | The k8s namespace uid. | Any Str | true |
| k8s.node.name | The k8s node name. | Any Str | true |
| k8s.node.uid | The k8s node uid. | Any Str | true |
| k8s.pod.name | The k8s pod name. | Any Str | true |
| k8s.pod.qos_class | The k8s pod qos class name. One of Guaranteed, Burstable, BestEffort. | Any Str | false |
| k8s.pod.uid | The k8s pod uid. | Any Str | true |
| k8s.replicaset.name | The k8s replicaset name | Any Str | true |
| k8s.replicaset.uid | The k8s replicaset uid | Any Str | true |
| k8s.replicationcontroller.name | The k8s replicationcontroller name. | Any Str | true |
| k8s.replicationcontroller.uid | The k8s replicationcontroller uid. | Any Str | true |
| k8s.resourcequota.name | The k8s resourcequota name. | Any Str | true |
| k8s.resourcequota.uid | The k8s resourcequota uid. | Any Str | true |
| k8s.statefulset.name | The k8s statefulset name. | Any Str | true |
| k8s.statefulset.uid | The k8s statefulset uid. | Any Str | true |
You can see these resource attributes in the OpenTelemetry Collector Contrib repo for the Kubernetes cluster receiver.
Conclusion
In this tutorial, you configured an OpenTelemetry collector to export metrics data from a Kubernetes cluster. You then sent the data to SigNoz for monitoring and visualization.
Visit our complete guide on OpenTelemetry Collector to learn more about it.
OpenTelemetry is becoming a global standard for open-source observability, offering advantages such as a unified standard for all telemetry signals and avoiding vendor lock-in. With OpenTelemetry, instrumenting your applications to collect logs, metrics, and traces becomes seamless, and you can monitor and visualize your telemetry data with SigNoz.
SigNoz is an open-source OpenTelemetry-native APM that can be used as a single backend for all your observability needs.
Further Reading
