Top 9 Lightstep (ServiceNow) Alternatives in 2026 (And How to Migrate)
ServiceNow recently announced the end-of-life (EOL) for Lightstep, now known as Cloud Observability. Support will officially end on March 1, 2026, or at the end of your contract, and ServiceNow has confirmed there will be no direct replacement or migration path.
This news can be disruptive for engineering teams who rely on Lightstep for critical observability. The announcement highlights a significant risk in relying on proprietary, closed-source tools for essential infrastructure.
At SigNoz we believe critical infra shouldn’t hinge on a vendor’s roadmap. Observability is too critical a piece to leave to such risks. With open source, you always have an escape hatch.
If you're now searching for a stable, future-proof alternative to Lightstep, you're in the right place. This guide will walk you through the best Lightstep alternatives, with a focus on open-source and OpenTelemetry-native solutions, and show you how to make a clean migration.
What was Lightstep? A Quick Refresher
Lightstep was a powerful observability platform, highly regarded as an early leader in distributed tracing. Many engineering teams chose it for its:
- Strong OpenTelemetry Support: Lightstep was an early and significant contributor to OpenTelemetry (OTel), building its platform to provide first-class OpenTelemetry support. This meant users could instrument their applications with open standards, avoiding agent lock-in.
- Unified Observability: It provided unified dashboards to visualize logs, metrics, and traces in one place, which helped teams correlate different telemetry signals during an investigation.
- Advanced Tracing Features: It offered features like service diagrams, root cause analysis, and "Change Intelligence" to correlate performance deviations with deployments.
A good Lightstep alternative should ideally match or exceed these capabilities, providing a unified view of telemetry while being built on open standards.
Top 6 Lightstep Alternatives
Here are the top alternatives to Lightstep, evaluated based on their support for logs, metrics, traces, open-source nature, and ease of migration.
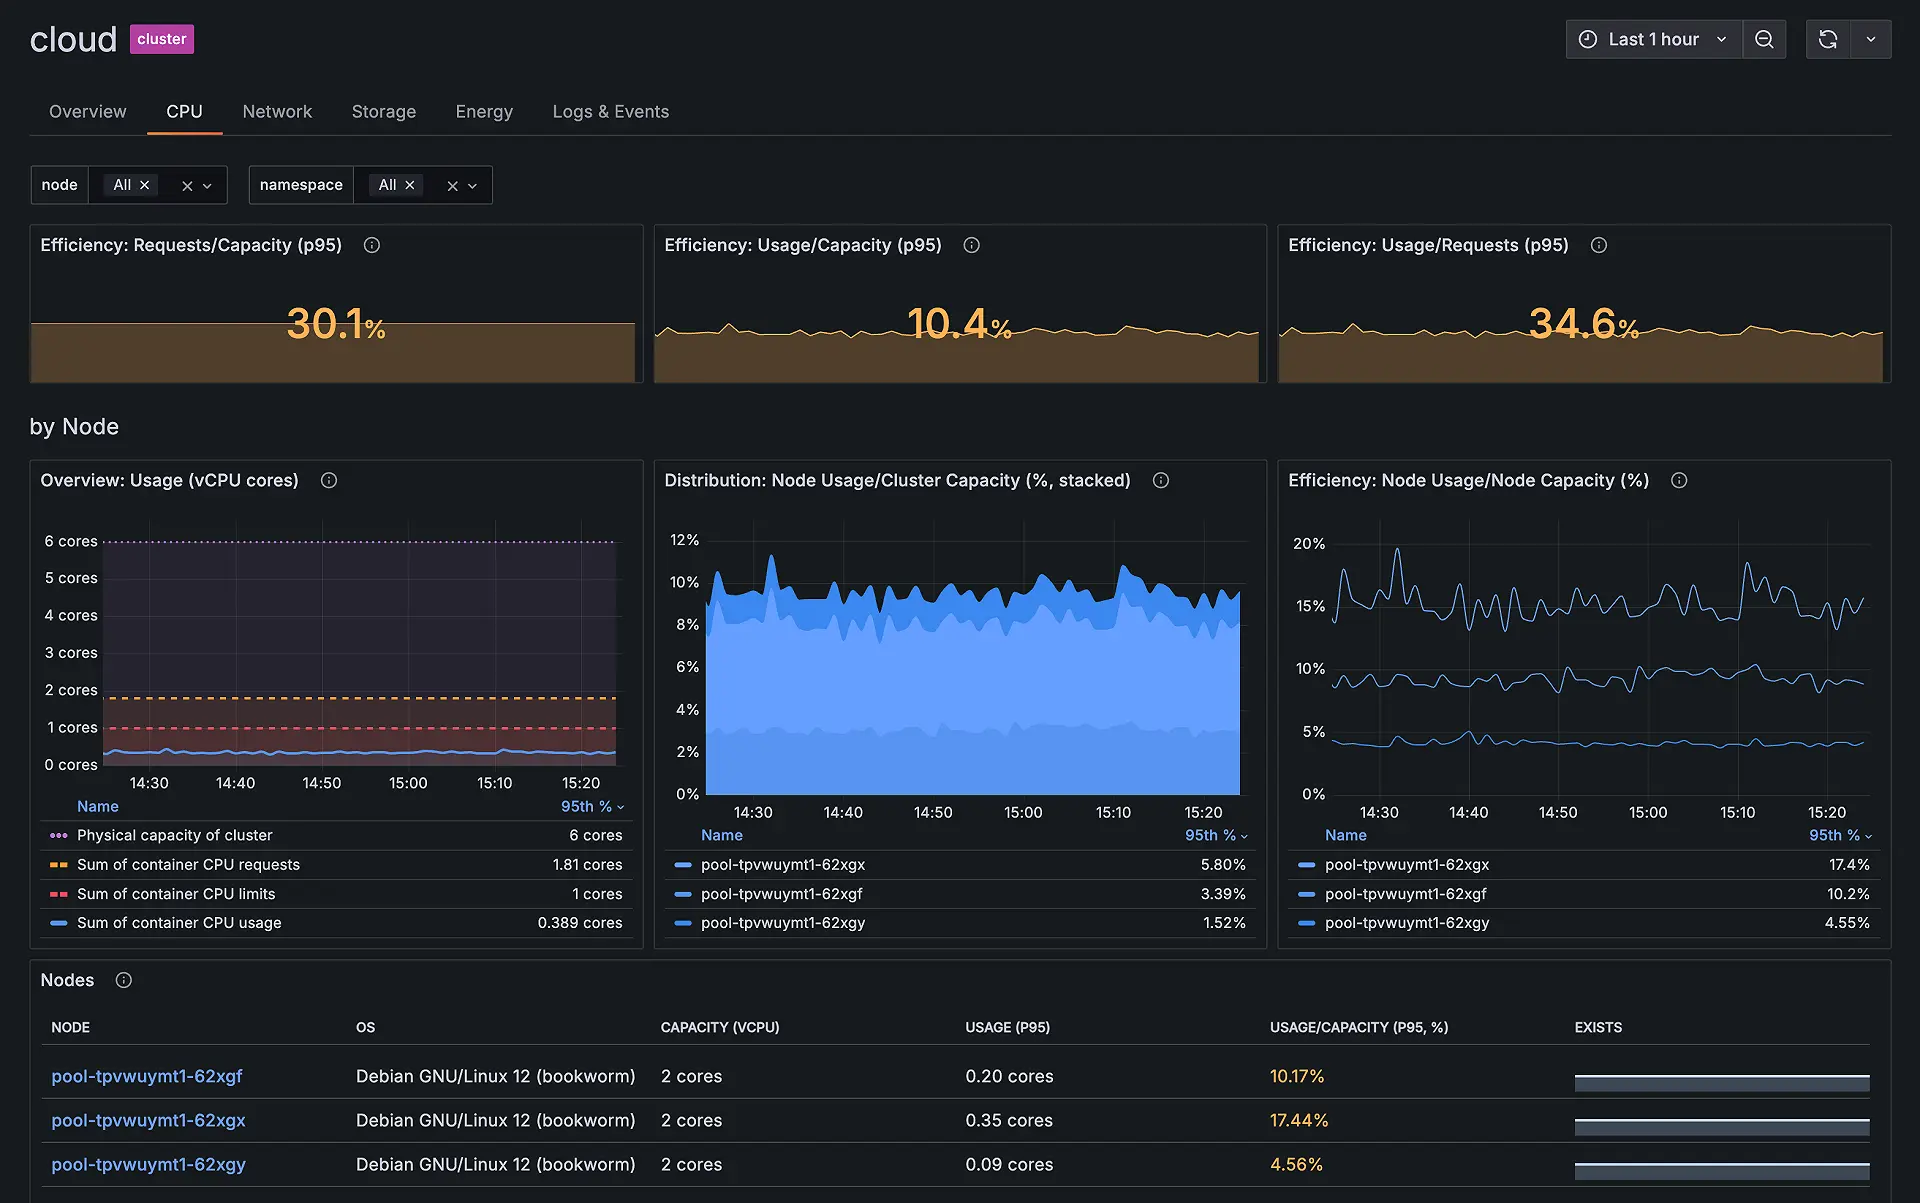
1. SigNoz
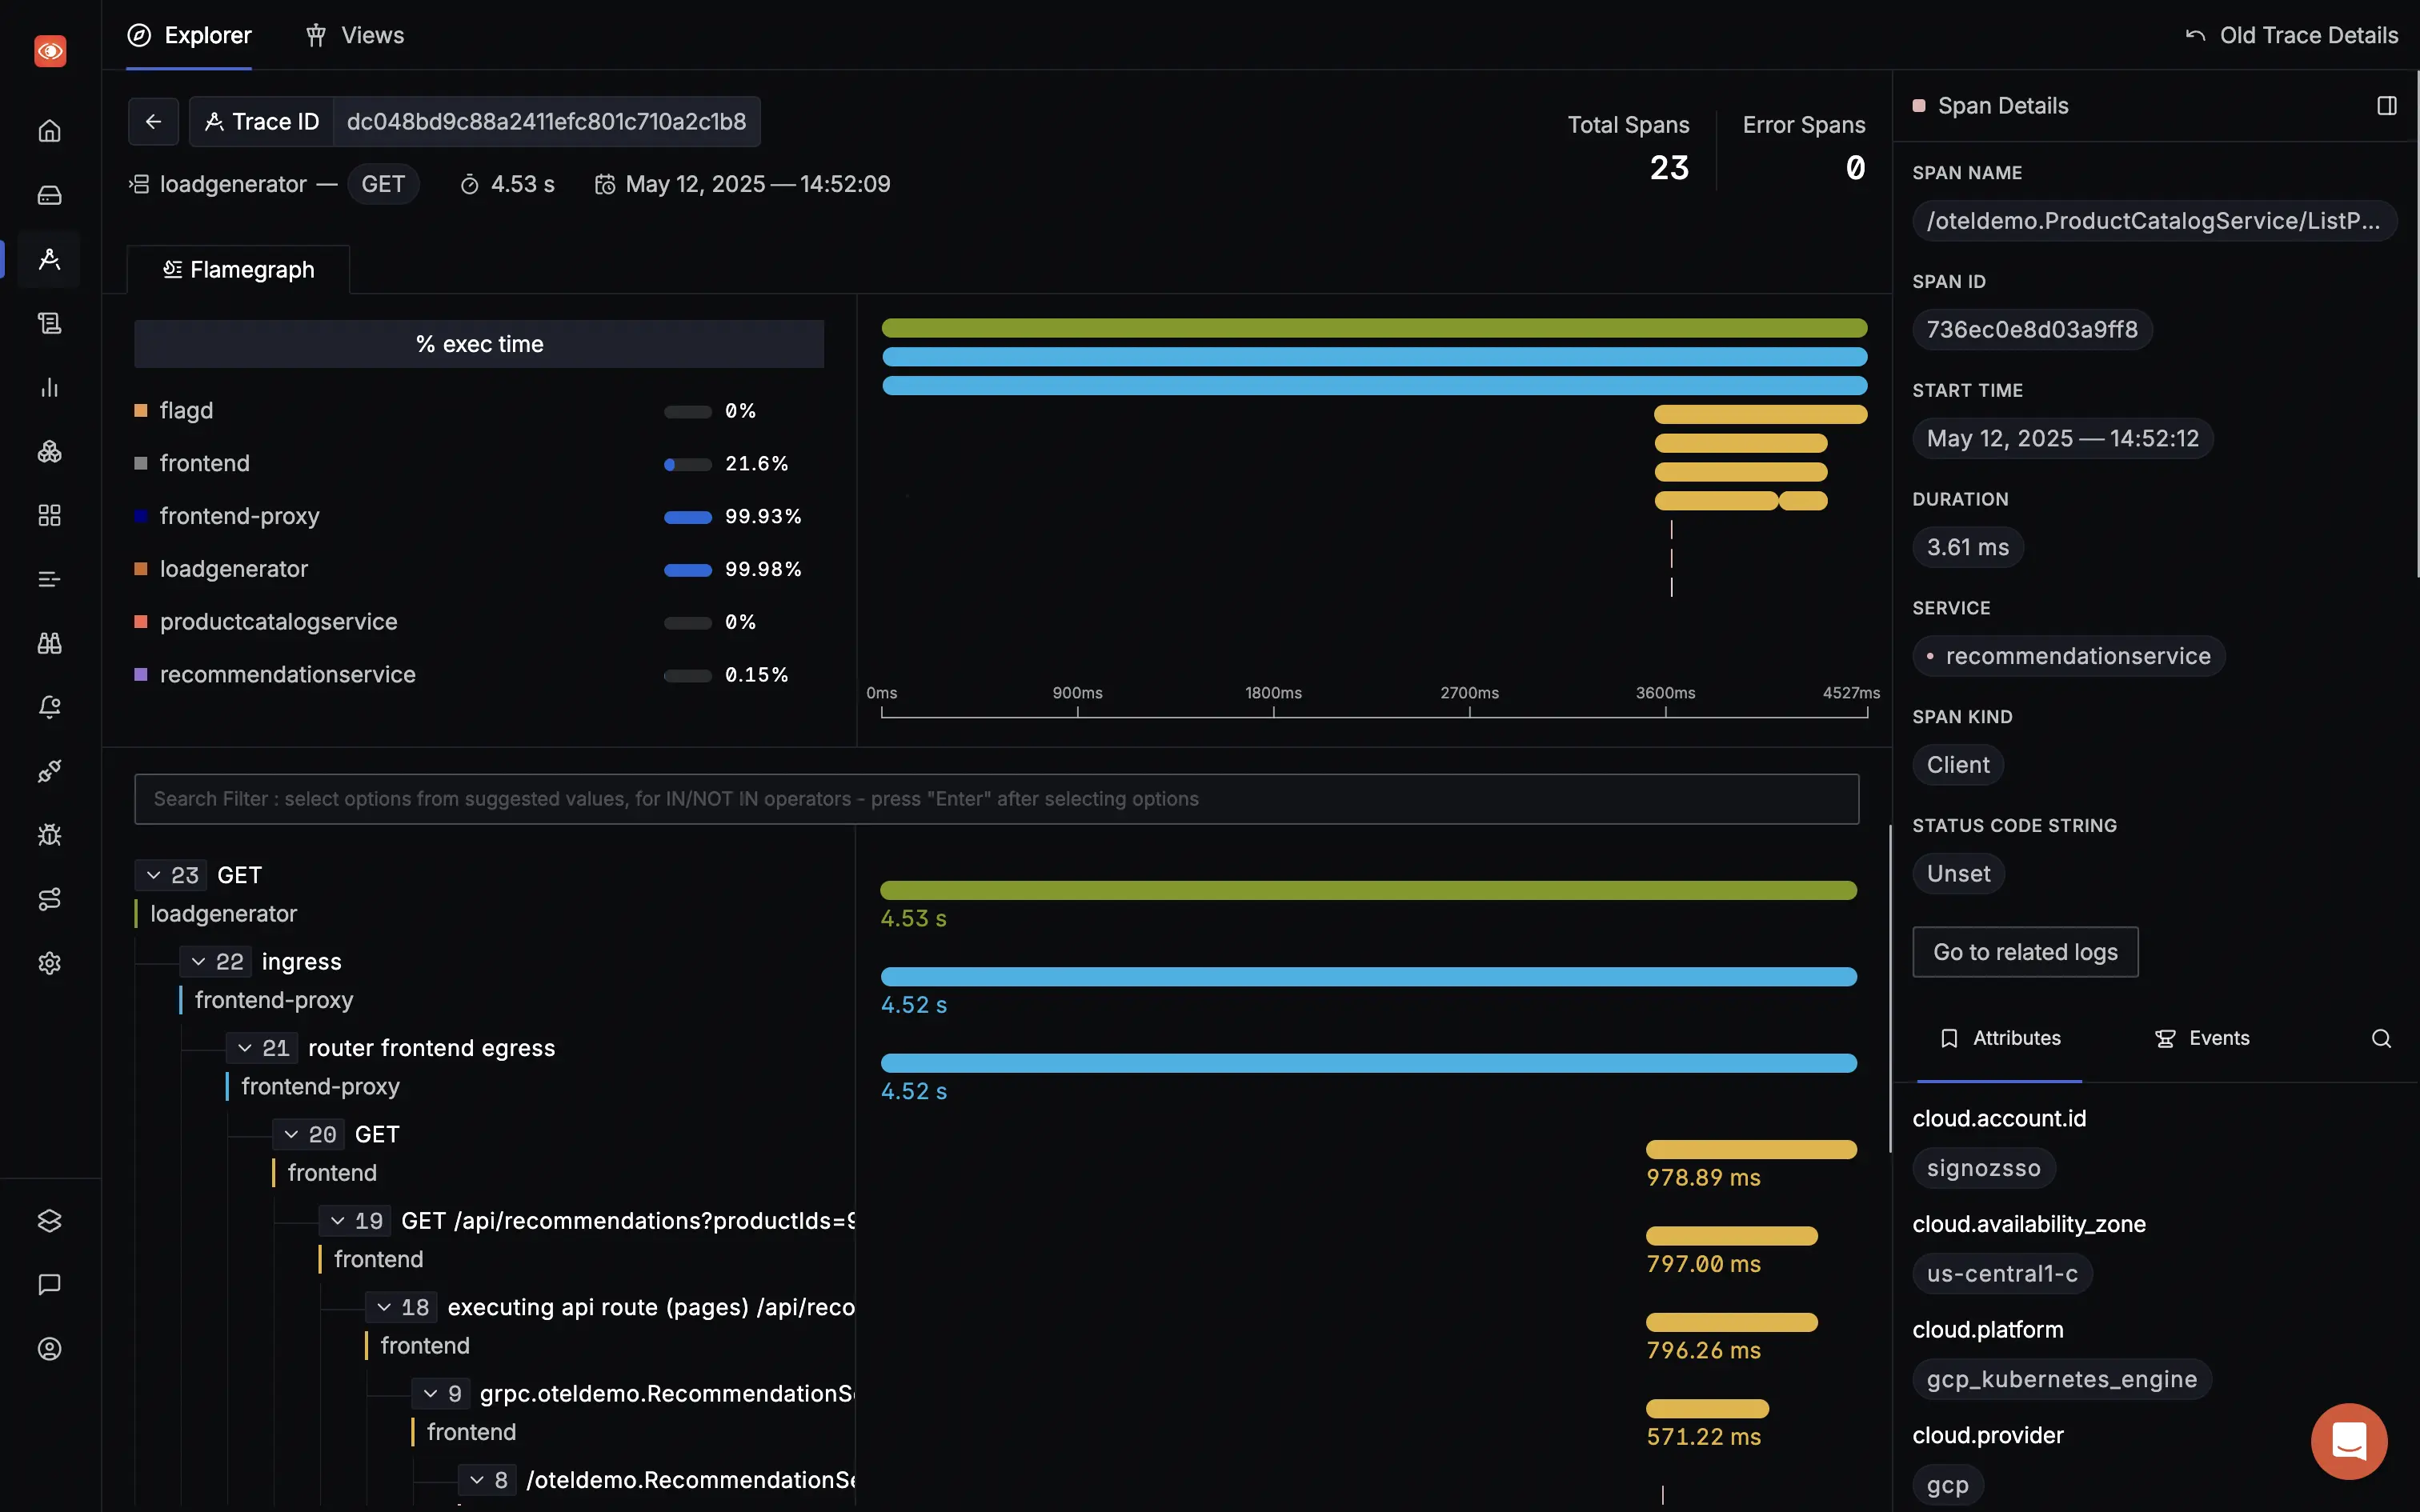
SigNoz is a full-stack, open-source observability platform that unifies logs, metrics, and traces in a single application. It is built to be natively compatible with OpenTelemetry, making it a natural and seamless replacement for Lightstep.
Key Features & Strengths:
- Truly Unified Observability: SigNoz uses a single backend (Columnar database) for logs, metrics, and traces, so you can pivot from a trace to related logs without switching tools.
- OpenTelemetry-Native: SigNoz is built from the ground up to support OpenTelemetry. There are no proprietary agents, and it fully supports OTel semantic conventions, ensuring a smooth migration from Lightstep.
- Cost-Effective and Transparent Pricing: The open-source version is free to self-host. SigNoz Cloud offers a simple, usage-based pricing model without per-user or per-host fees, which is often more predictable and affordable than competitors.
- Powerful Querying and Analytics: You can run advanced analytics on your telemetry data, such as finding the p99 latency for all services with a specific tag.
- Control Over Your Data: With both cloud and self-hosted options, you can choose where your data resides, which is crucial for compliance and privacy.
Considerations & Trade-offs:
- Compared to Datadog, its ecosystem of pre-built integrations is still growing. However, its OTel-native nature means it can ingest data from any system that supports OTLP.
Verdict:
SigNoz is a strong candidate for teams looking for a direct, future-proof Lightstep alternative. Its open-source nature, native OpenTelemetry support, and unified data model provide a powerful, cost-effective, and flexible solution for teams who want to own their observability data and avoid vendor lock-in.
2. Datadog
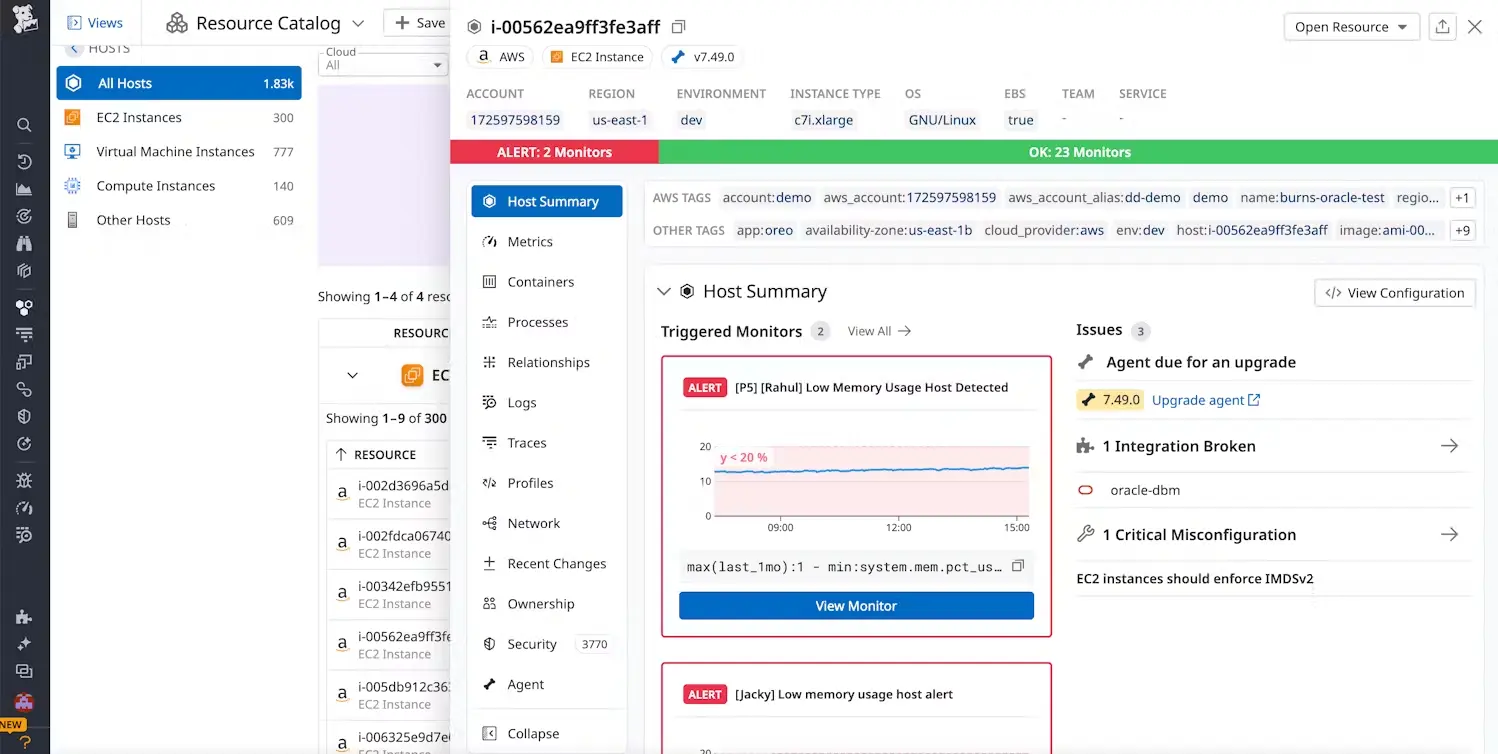
Datadog is a market-leading, all-in-one SaaS observability platform that covers everything from infrastructure monitoring and APM to log management and security.
Key Features & Strengths:
- Comprehensive Feature Set: Datadog offers an incredibly broad range of features consolidated into a single platform, reducing tool sprawl.
- Extensive Integrations: It has hundreds of integrations that make setup easy for a wide variety of technologies.
- Polished UI: The dashboards are highly customizable and the platform includes AI-powered features like Watchdog for anomaly detection.
Considerations & Trade-offs:
- High and Unpredictable Cost: Datadog's multi-vector pricing (per-host, per-GB, per-user, custom metrics) is notoriously complex and often leads to bill shock. OpenTelemetry metrics can be charged as expensive "custom metrics."
- Vendor Lock-in: The platform heavily relies on its proprietary agent, which can make it difficult and costly to migrate away from.
For a detailed breakdown of Datadog's pricing complexities and hidden costs, check out this comprehensive guide: Datadog Pricing Main Caveats Explained.
The verdict:
Datadog is a fit for large enterprises with a significant budget who prioritize a single, deeply integrated platform. However, for teams concerned about cost and vendor lock-in, the very issues highlighted by Lightstep's EOL, Datadog's model presents similar risks.
3. New Relic
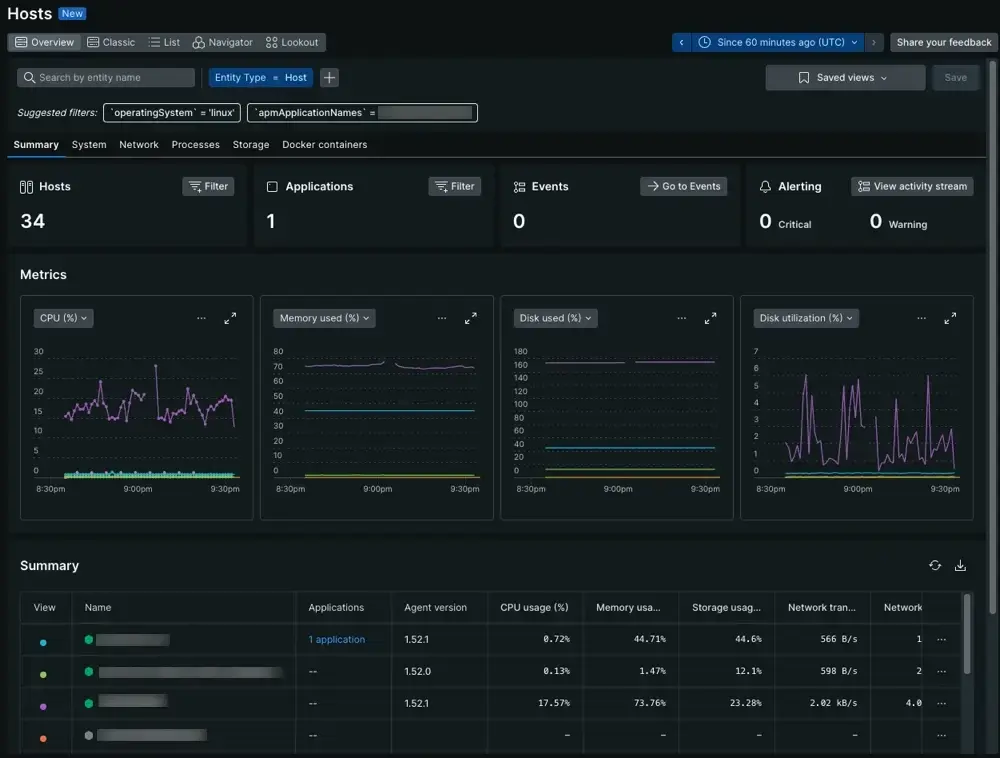
New Relic is an observability pioneer that has evolved into a full-stack platform. It offers a unified solution with a generous free tier.
Key Features & Strengths:
- Strong APM Capabilities: New Relic provides deep, code-level insights and powerful transaction tracing.
- Generous Free Tier: Its free tier (100 GB of data ingest per month) provides an easy entry point for small teams.
- OpenTelemetry Support: New Relic offers excellent support for OpenTelemetry, allowing you to send data via OTLP without using their proprietary agents. However, it's important to understand that the platform is OTel-compatible, not OTel-native. It ingests and translates OpenTelemetry data into its internal proprietary format.
Considerations & Trade-offs:
- Cost at Scale: Despite a simplified model, costs can escalate significantly with high data volumes or a large number of users.
- UI Complexity: The user interface can be cluttered and has a steep learning curve for new users.
The verdict:
New Relic is a solid option for teams that need deep APM insights and want to start with a free tier. However, be mindful of costs as your usage grows.
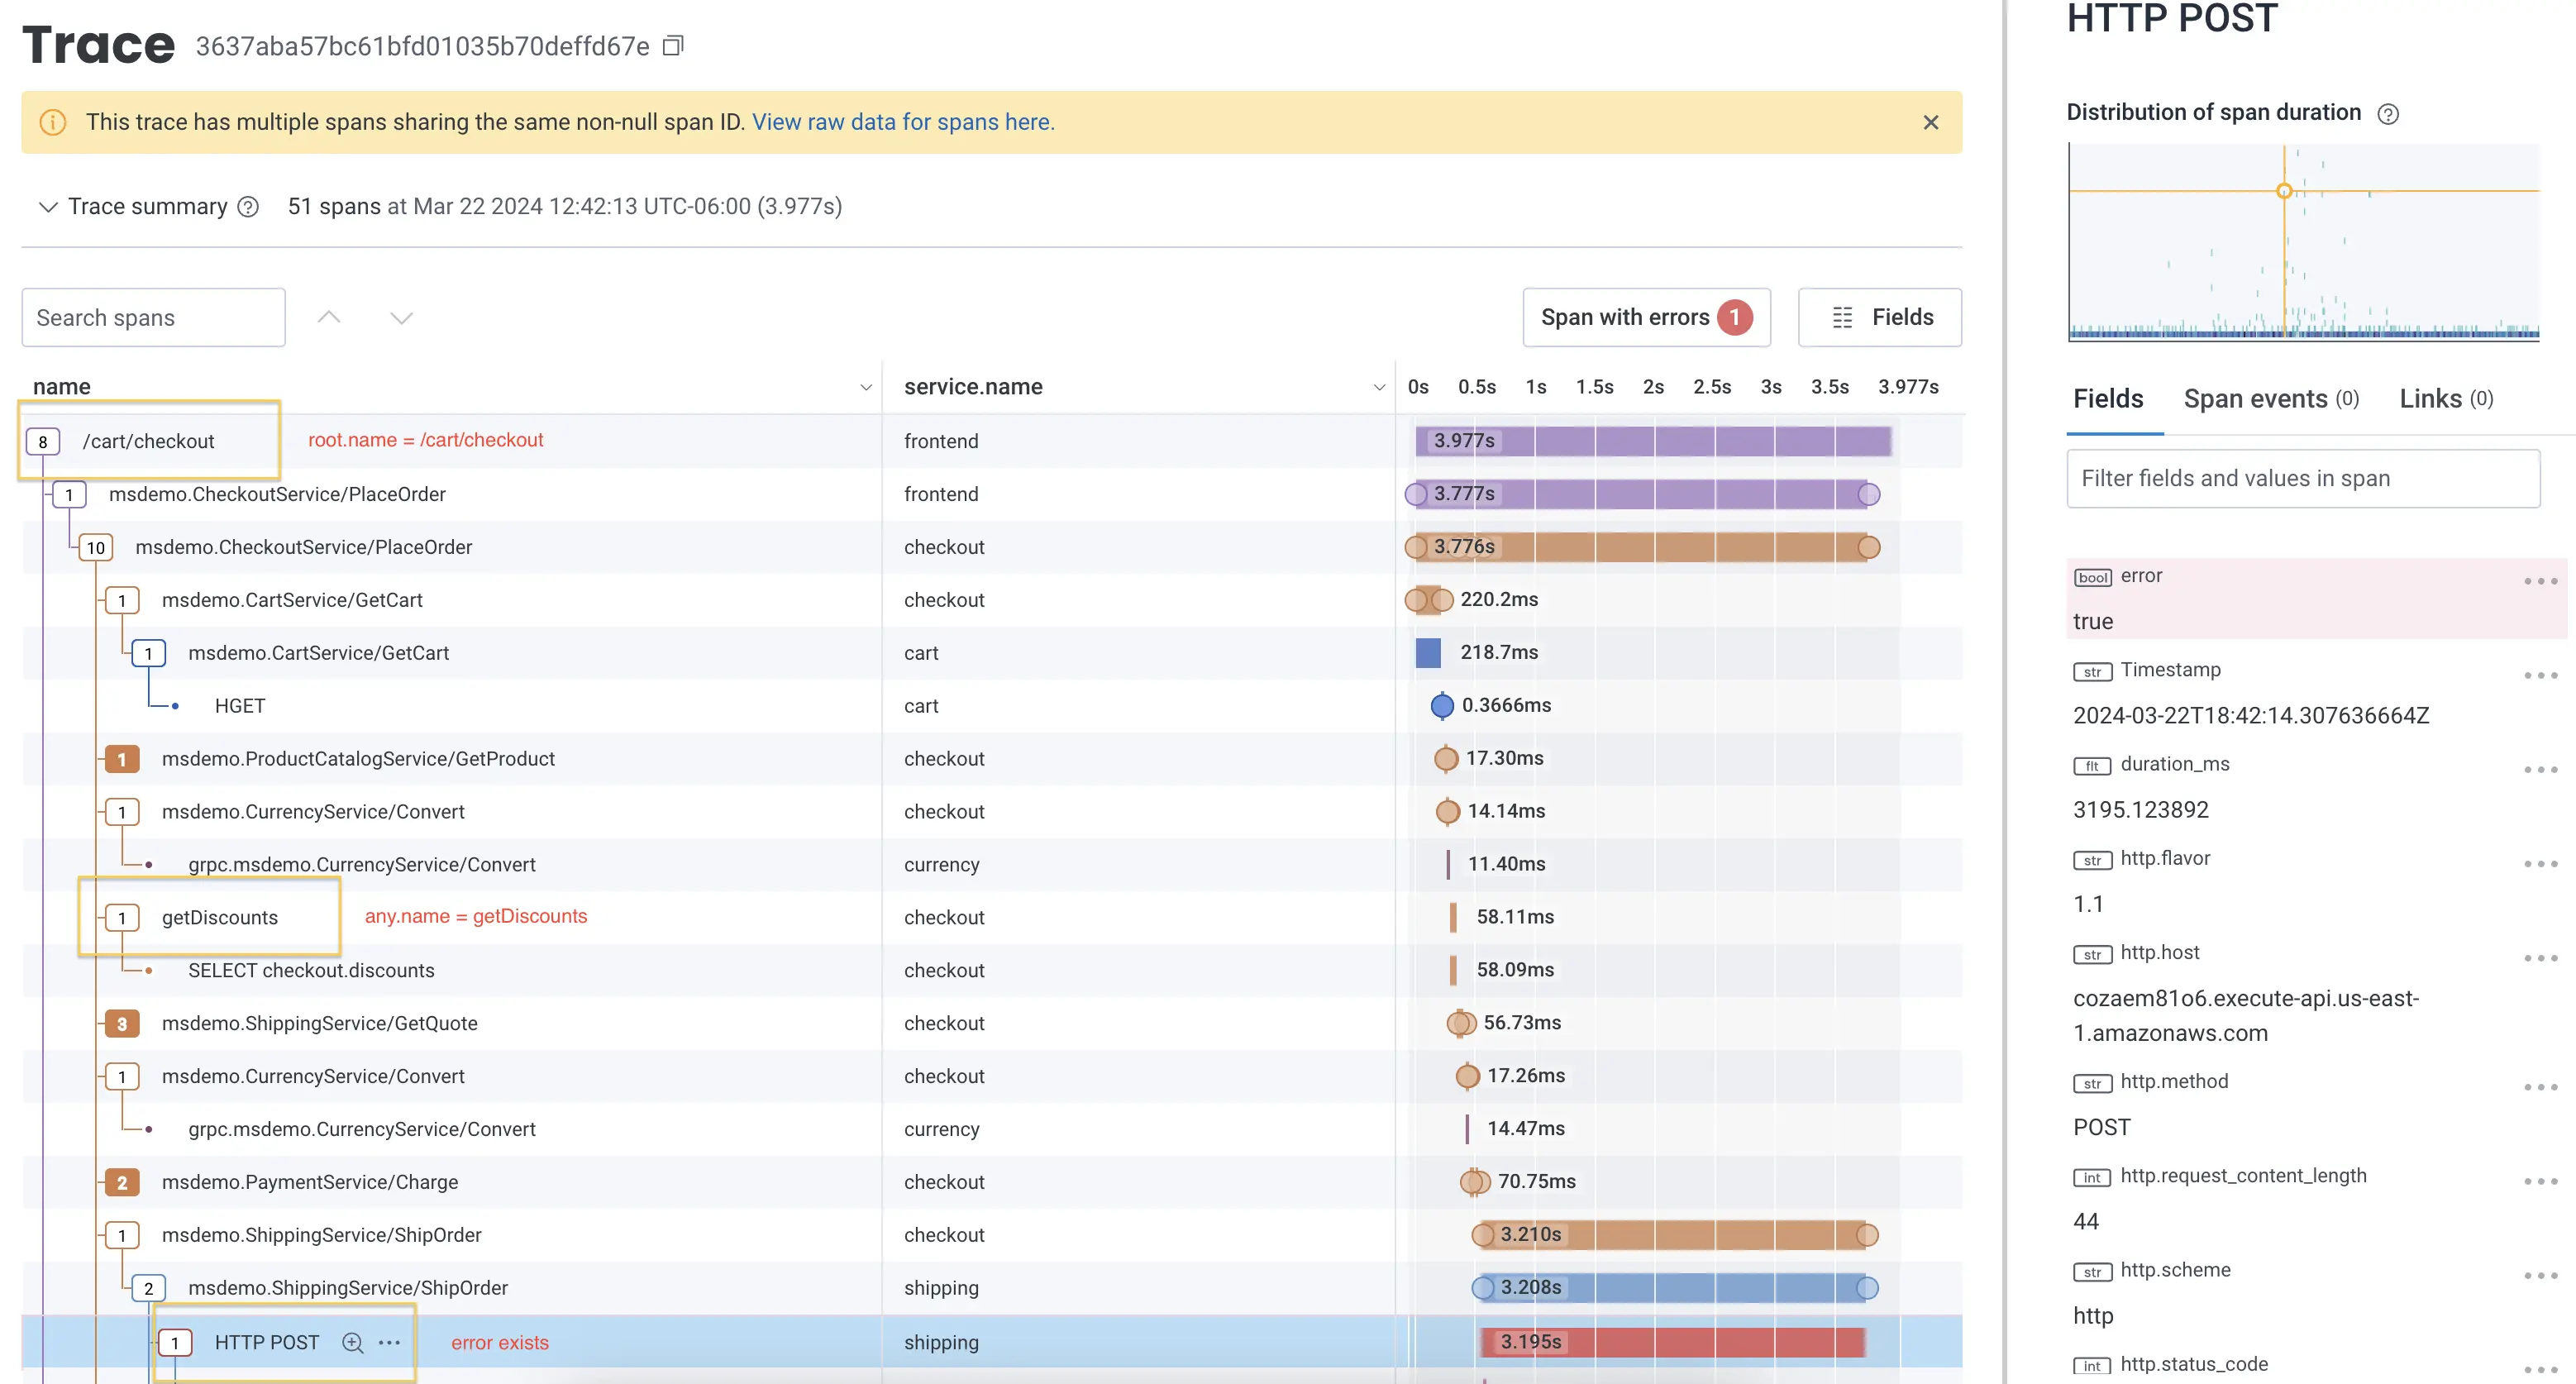
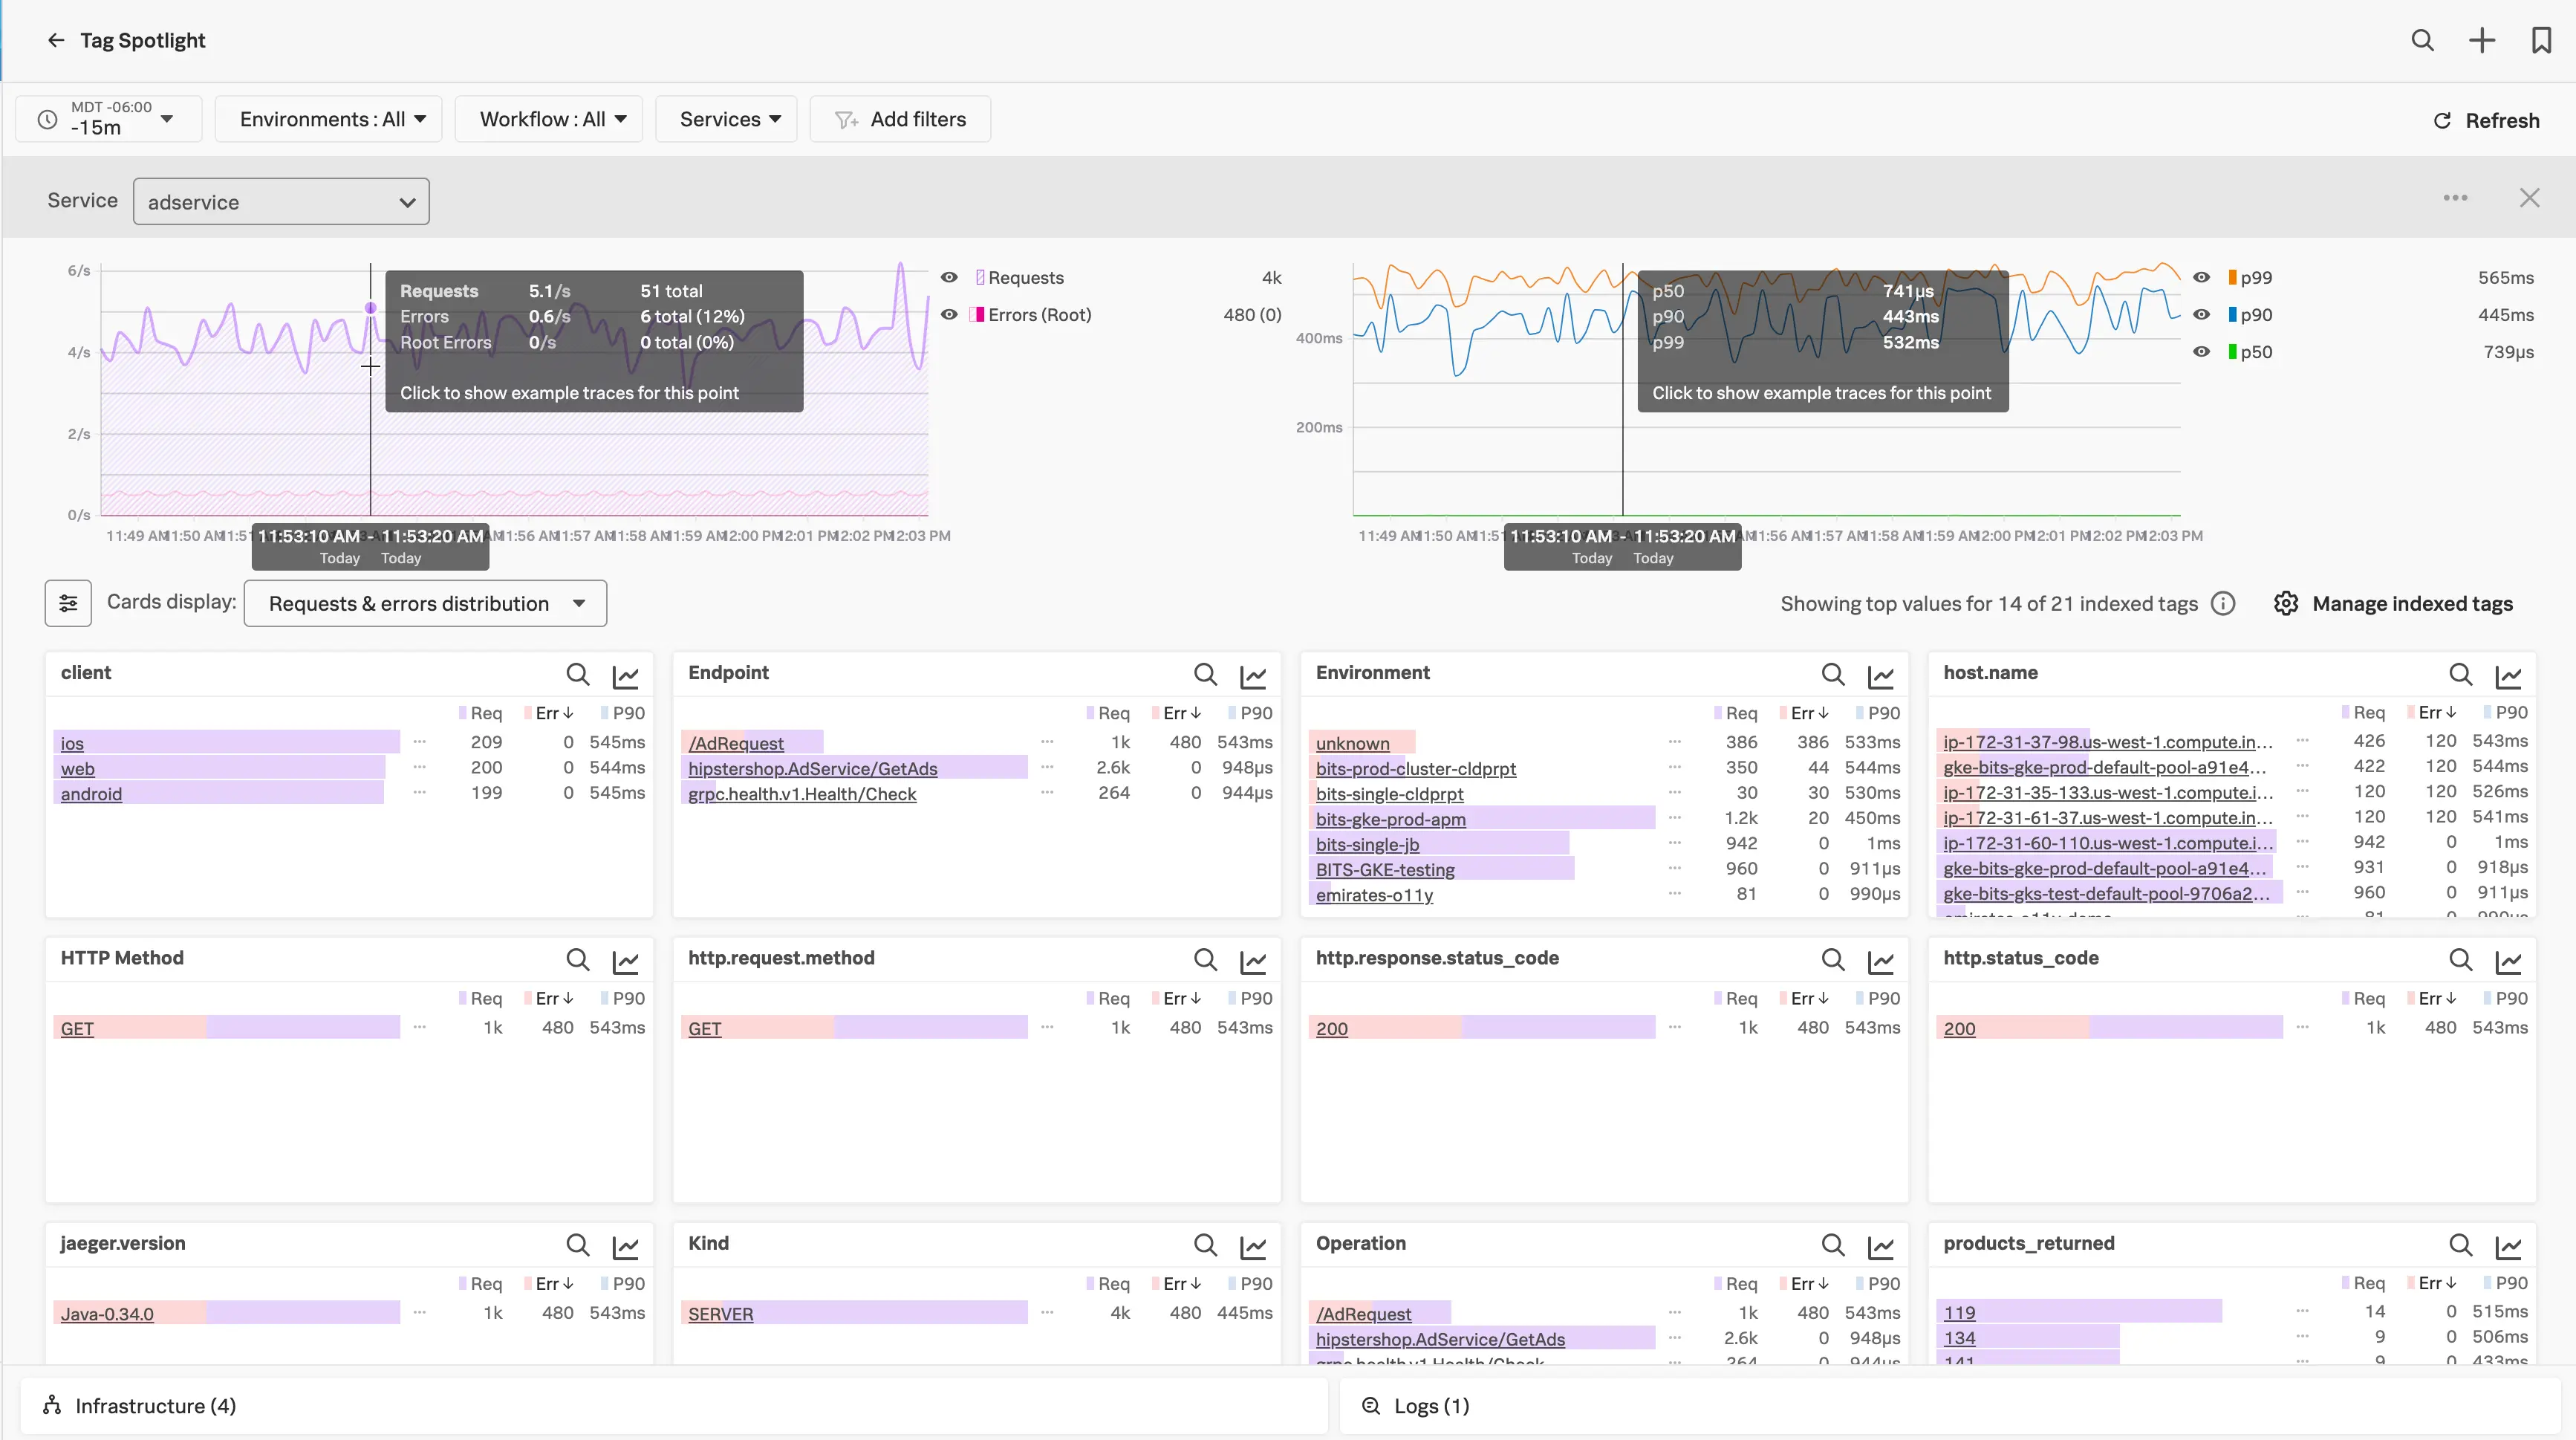
4. Honeycomb
Honeycomb is a SaaS platform designed for analyzing high-cardinality, high-dimensionality data. It focuses on event and trace-based debugging for complex distributed systems.
Key Features & Strengths:
- Excellent for High-Cardinality Data: Honeycomb excels at letting you slice and dice data by any attribute, which is invaluable for debugging novel production issues.
- Developer-Centric Workflow: Features like "BubbleUp" automatically highlight outlier attributes, speeding up root cause analysis.
- OpenTelemetry-Native: It's a strong proponent of OTel and offers simple, event-based pricing.
Considerations & Trade-offs:
- Not a Full-Stack Solution: Honeycomb is hyper-focused on tracing and events. Its capabilities for traditional infrastructure monitoring and unstructured log management are less mature. You will likely need other tools to get a complete picture.
The verdict:
Honeycomb is a great choice for developer-centric teams who prioritize deep, investigative tracing. If your main goal is to replace Lightstep's tracing capabilities, Honeycomb is a strong contender, but you'll need a separate solution for metrics and logs.
5. Grafana OSS Stack (LGTM)
The Grafana stack is a popular open-source, composable observability solution consisting of Loki (for logs), Grafana (for visualization), Tempo (for traces), and Mimir/Prometheus (for metrics).
Key Features & Strengths:
- Best-in-Class Visualization: Grafana provides beautiful, highly customizable dashboards that can pull data from countless sources.
- Open and Composable: Being fully open-source, it offers maximum flexibility and no vendor lock-in. It's a cornerstone of the CNCF ecosystem.
- Strong Community: It has a vibrant open-source community and is the de-facto standard for visualizing Prometheus metrics.
Considerations & Trade-offs:
- Operational Complexity: The biggest challenge is managing four separate, distributed systems (Loki, Grafana, Tempo, Mimir). This requires significant operational expertise and can be resource-intensive.
- Siloed Data: While Grafana can visualize data from different sources, the backends are separate. This makes it harder to perform deep correlations between logs, metrics, and traces compared to a unified system like SigNoz.
The verdict:
The Grafana stack is ideal for teams with strong DevOps expertise who want full control over their observability pipeline and prioritize visualization. However, if you're looking for a simpler, unified experience out-of-the-box, it might not be the best fit.
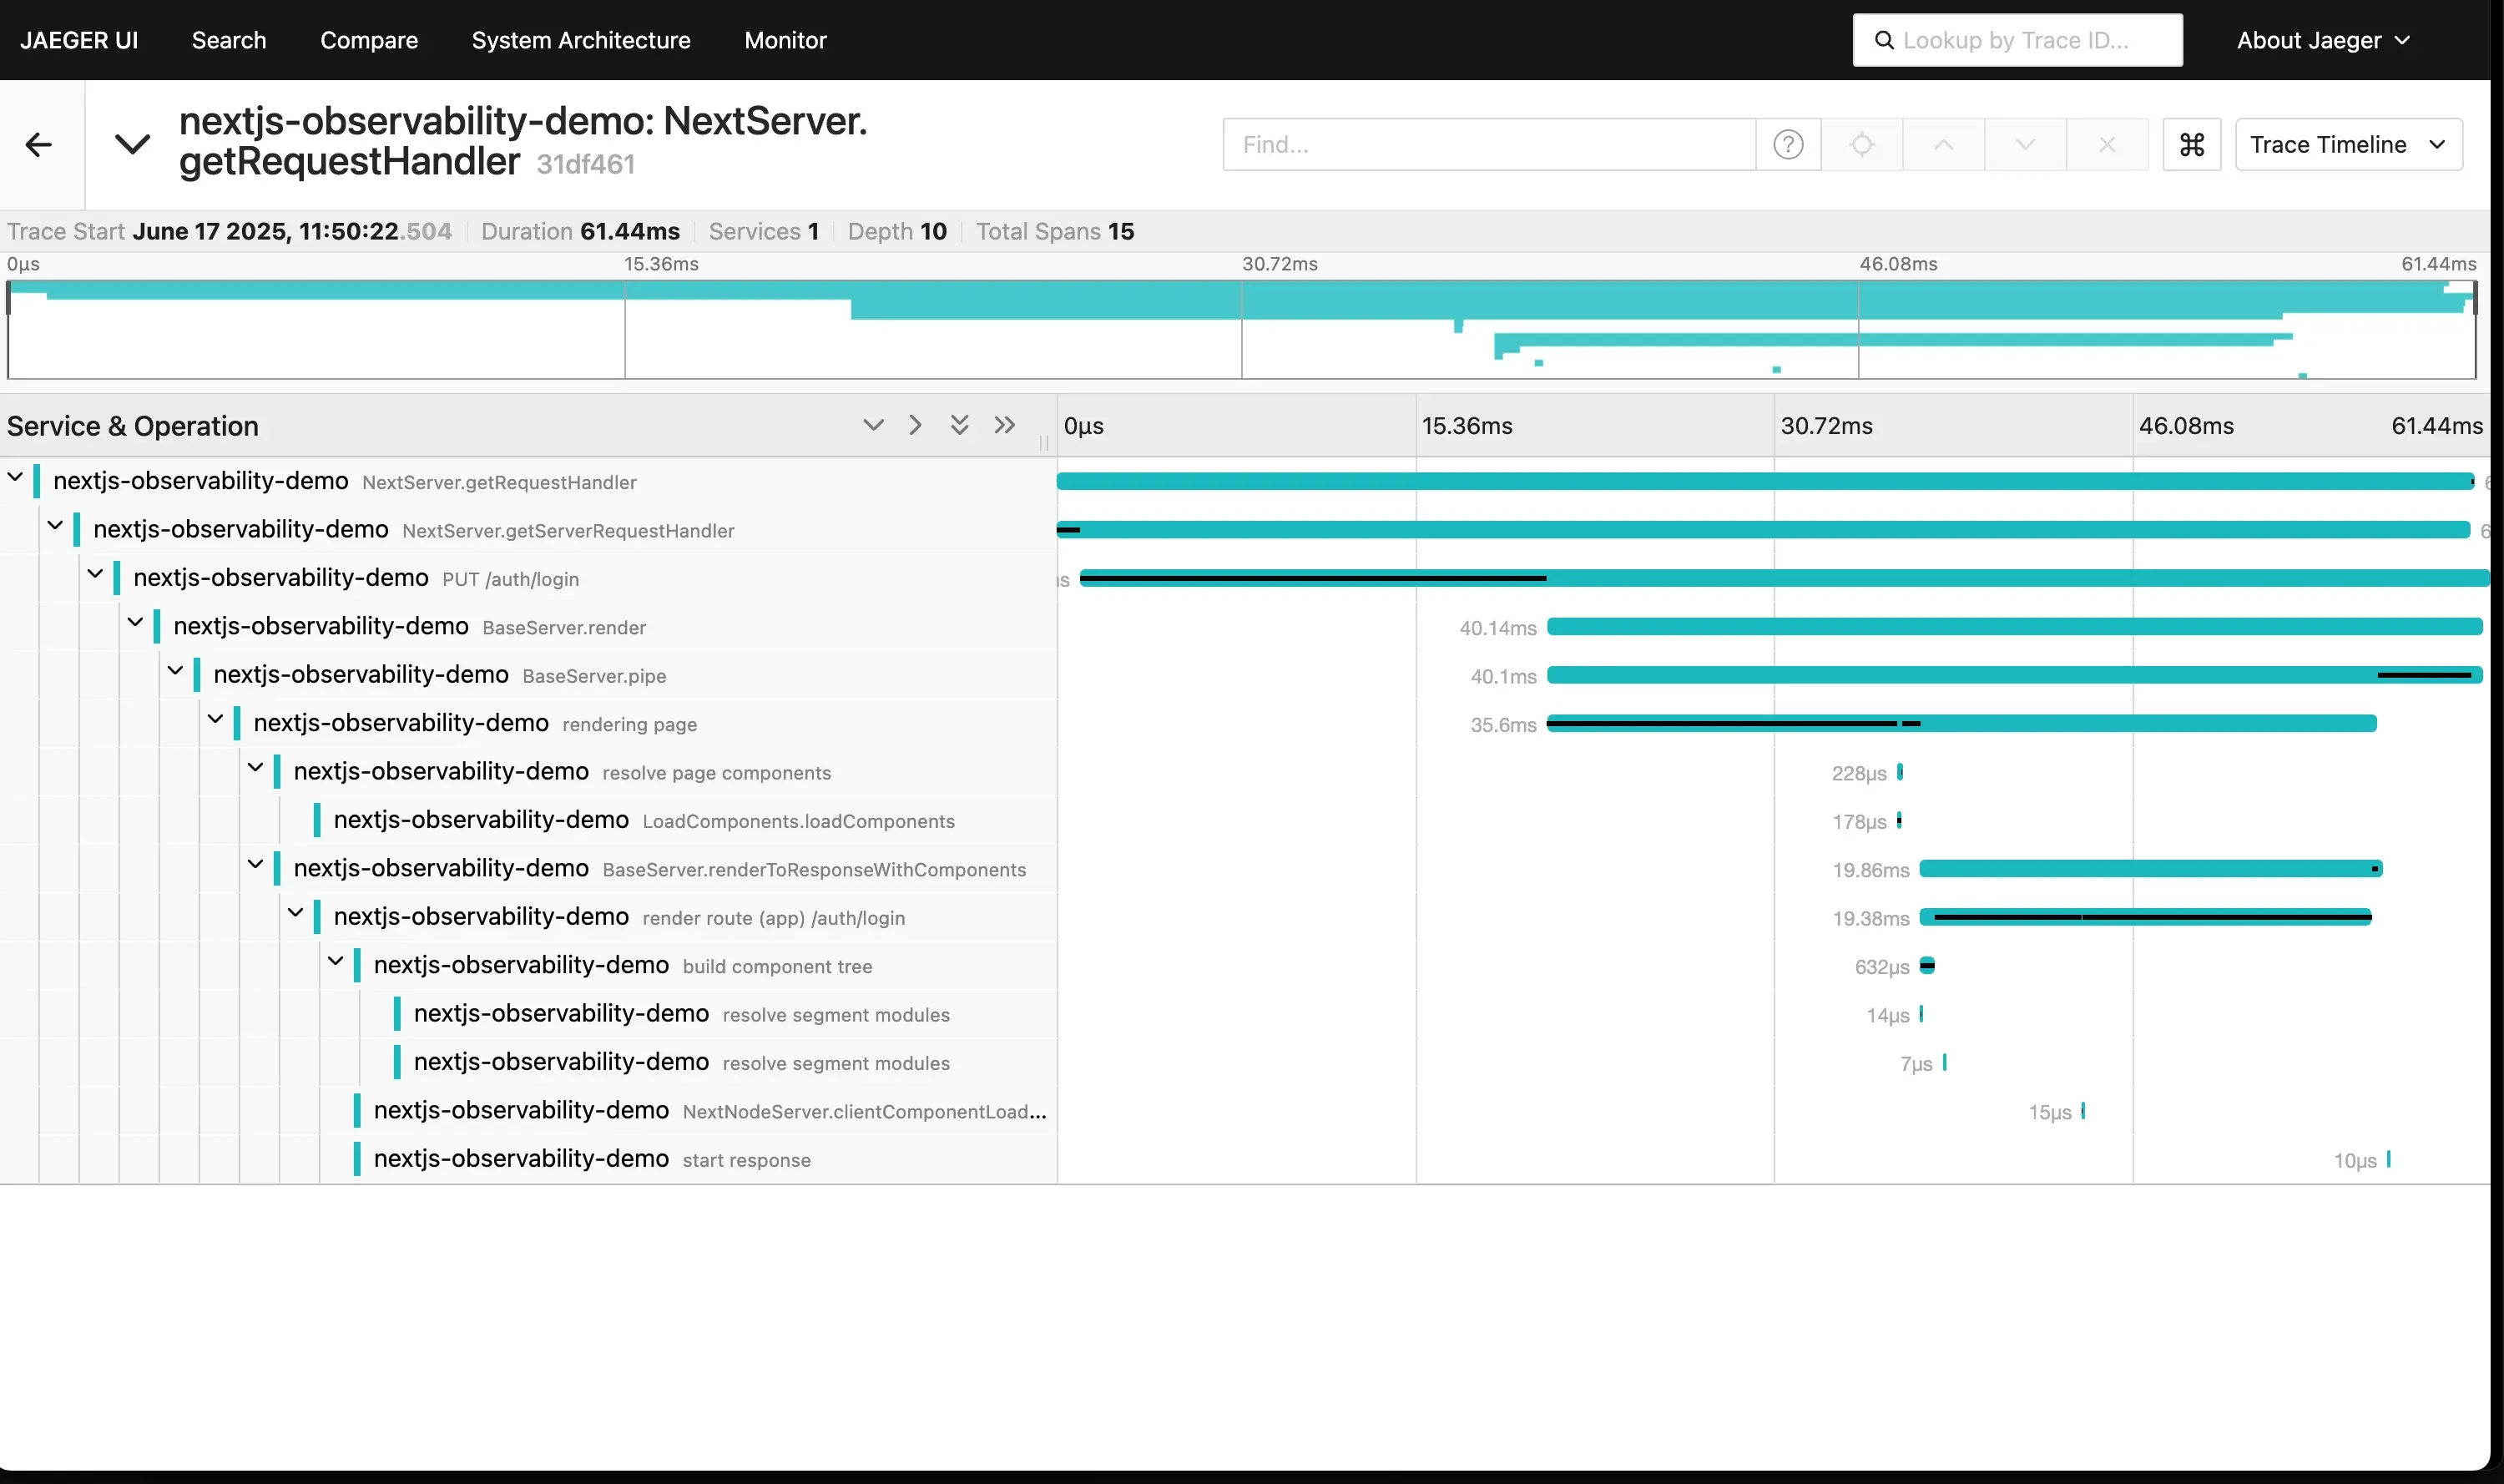
6. Jaeger
Jaeger is a graduated CNCF open-source project and a well-known standard for end-to-end distributed tracing.
Key Features & Strengths:
- Powerful Open-Source Tracing: Jaeger is a robust, scalable, and free solution dedicated to distributed tracing. It provides rich visualization tools for trace timelines and service dependency graphs.
- CNCF Standard: As a CNCF project, it's tightly aligned with the cloud-native ecosystem and OpenTelemetry.
Considerations & Trade-offs:
- Tracing Only: Jaeger's main limitation is its exclusive focus on tracing. It does not handle logs or metrics. To get full observability, you must integrate and manage it with other tools like Prometheus for metrics and an ELK stack for logs.
The verdict:
Jaeger is an excellent foundational component for a DIY observability stack. If you only need to replace Lightstep's tracing functionality and are prepared to manage separate systems for logs and metrics, Jaeger is a solid, cost-free choice.
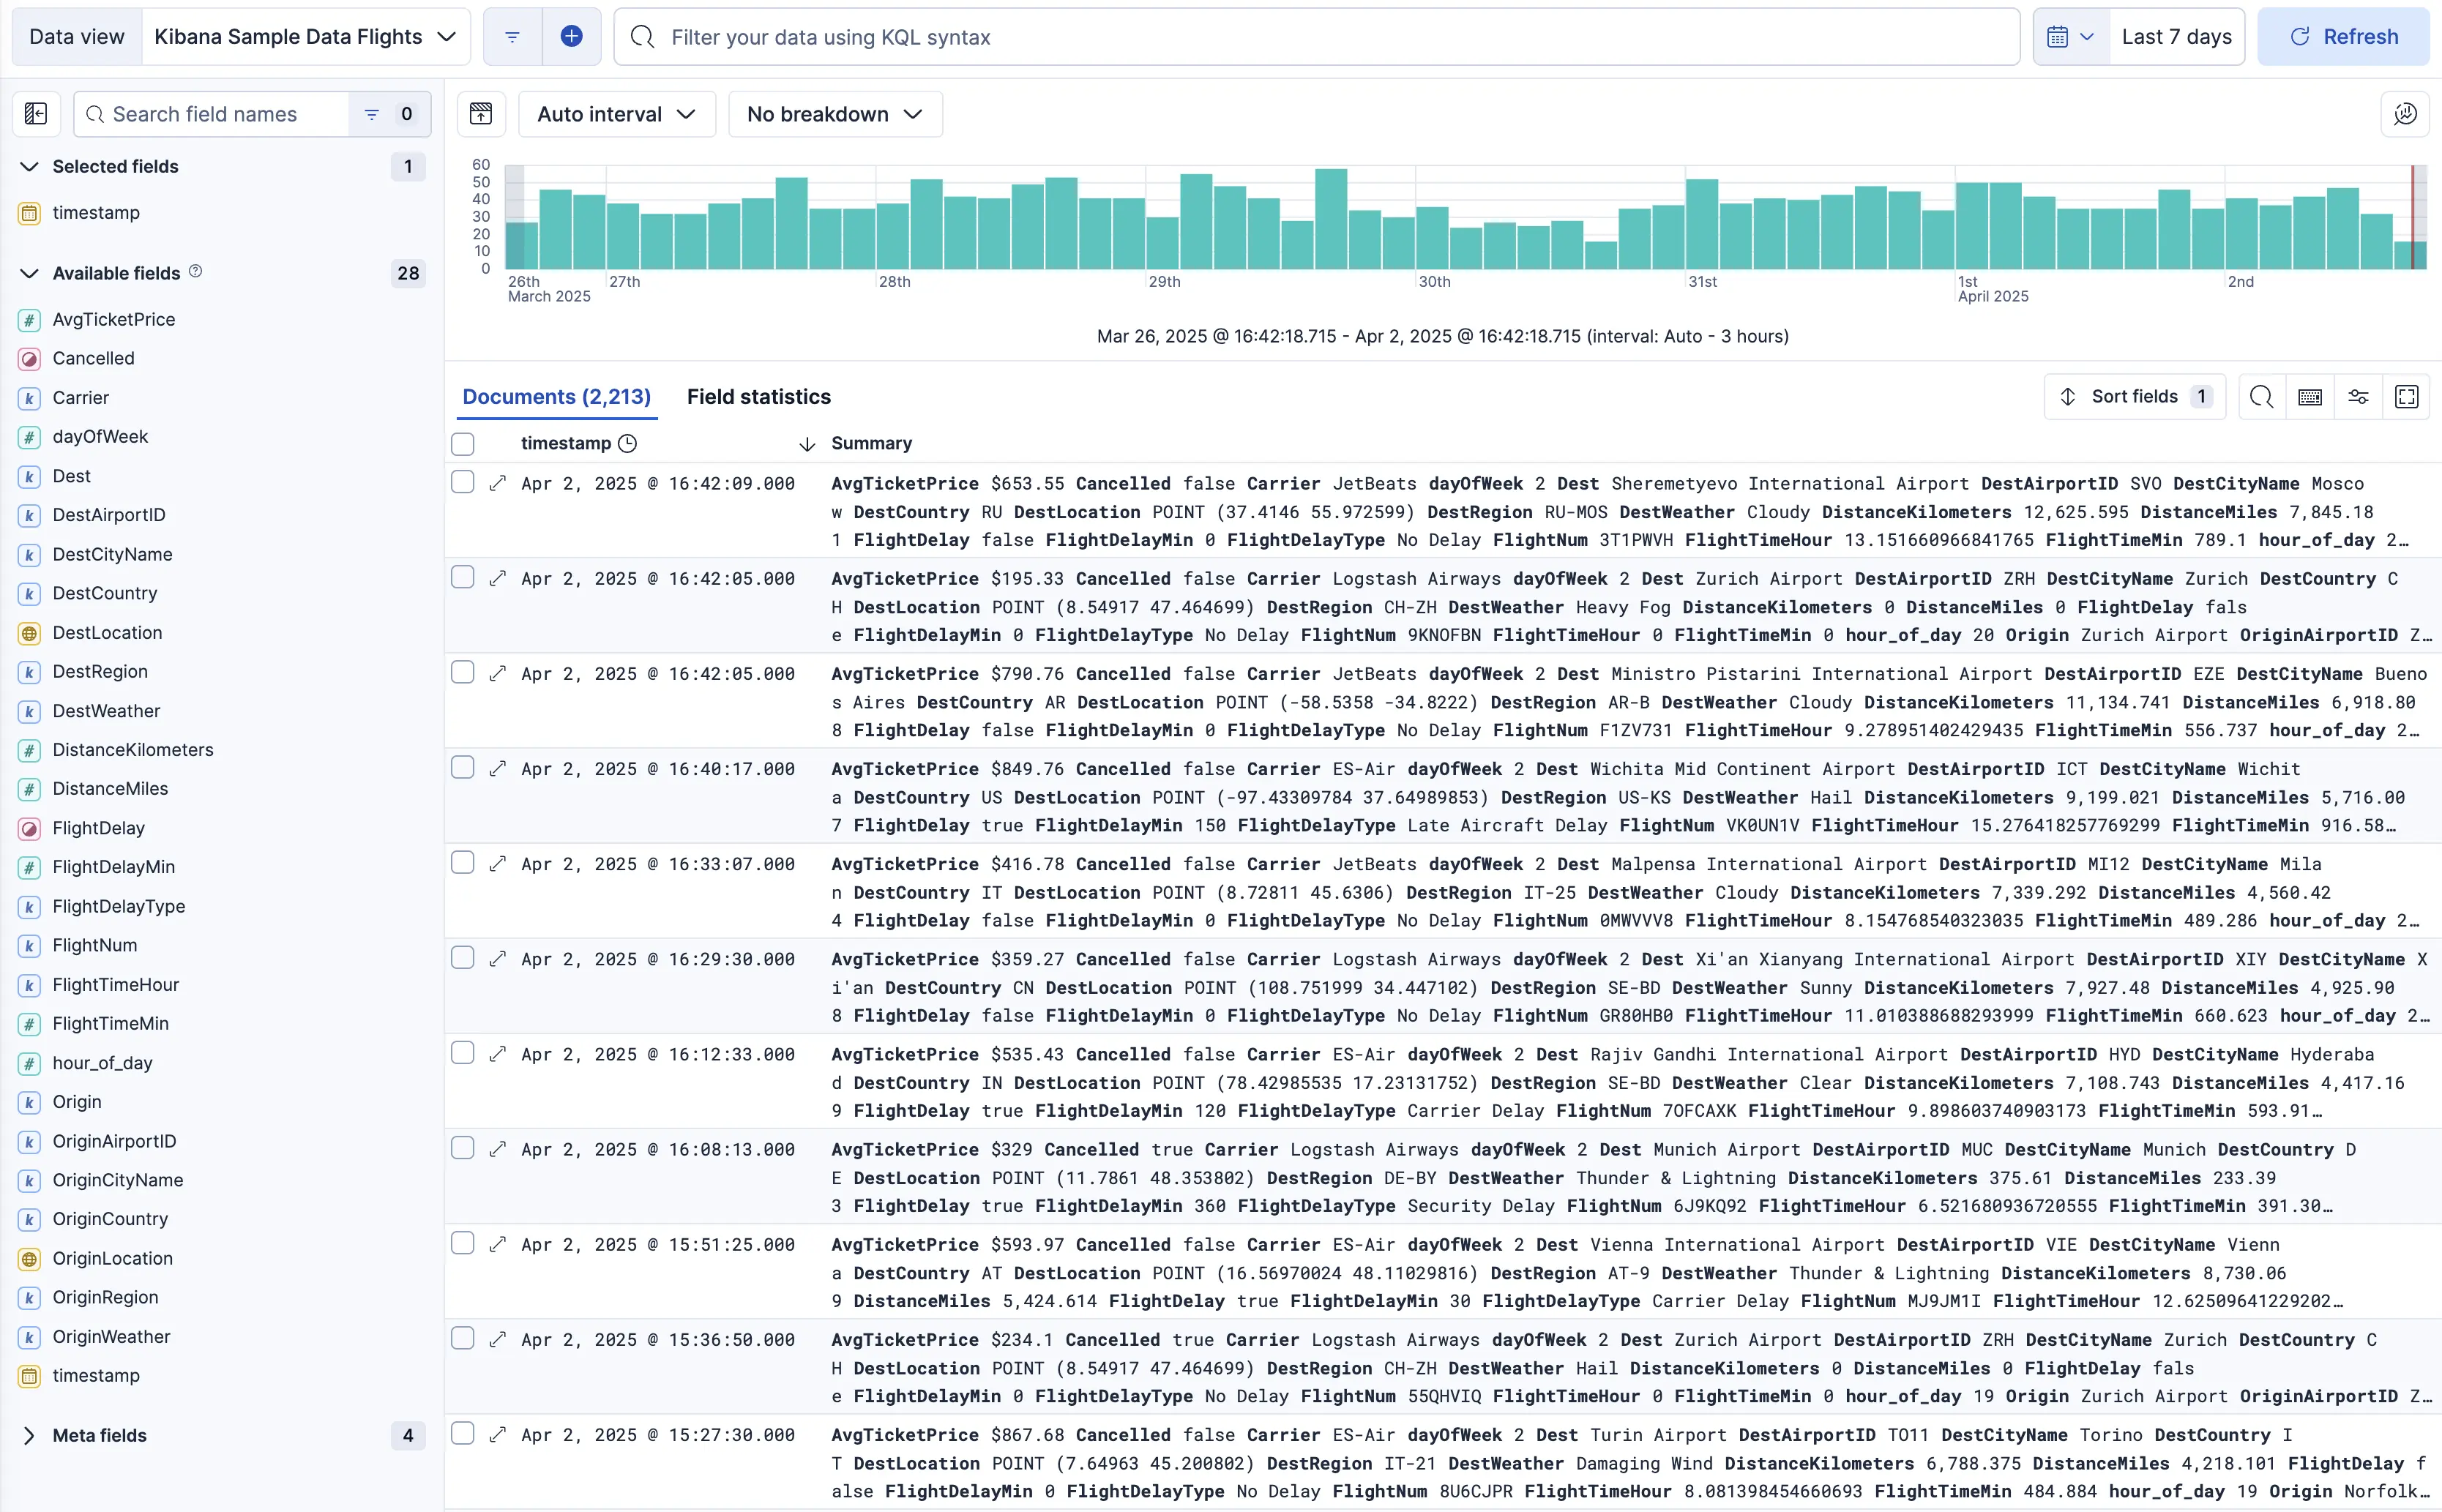
7. Elastic Observability
Elastic Observability is a unified solution built on the well-known Elastic Stack (formerly ELK Stack), combining log management, APM, and infrastructure monitoring. It leverages the power of Elasticsearch for search and analytics, making it a strong contender, especially for teams with log-heavy workloads.
Key Features & Strengths:
- Powerful Log Analytics: Its greatest strength is the underlying Elasticsearch engine, which offers exceptionally fast and flexible search and analytics capabilities for log data.
- Unified Experience: It provides a single, unified experience for logs, metrics, and traces within the Kibana interface, allowing for seamless correlation between different signals.
- Open-Core Foundation: The solution is built on an open-source foundation, which provides a low-friction entry point and avoids immediate vendor lock-in. It is often seen as a more cost-effective alternative to Splunk, particularly for self-hosted deployments.
Considerations & Trade-offs:
- Operational Complexity: The primary trade-off is the complexity of managing a large-scale Elasticsearch cluster, which requires significant expertise in tuning and scaling.
- Cloud Costs: While Elastic Cloud removes the operational burden of self-hosting, its costs can be confusing and unexpectedly high for large workloads.
- Maturing APM: Its Application Performance Monitoring (APM) solution is generally considered less mature and automated than APM-native competitors, which might require more manual configuration.
Verdict
Elastic Observability is ideal for engineering teams whose primary need is powerful log search and analytics. It suits organizations that either have the in-house expertise to manage a complex distributed system or are willing to pay for the convenience of the managed cloud service. It’s a solid choice for those who want a unified, open-core solution for log-heavy environments.
8. Splunk Observability Cloud
Splunk Observability Cloud is a comprehensive SaaS platform that combines APM, infrastructure monitoring, and real user monitoring, built to integrate tightly with Splunk's industry-leading log management platform. It is designed for enterprise-scale operations and is fully OpenTelemetry-native.
Key Features & Strengths:
- Seamless Log Integration: Its standout feature is
Log Observer Connect, which seamlessly links metrics and traces in the Observability Cloud with the deep log analytics of the core Splunk platform, without requiring duplicate data ingestion. - Full-Fidelity Tracing: The platform offers
NoSample™ Full-Fidelity Tracing, which captures 100% of trace data. This is valuable for organizations that cannot afford to miss any transaction data for debugging or compliance.
Considerations & Trade-offs:
- High Cost: Splunk is notoriously expensive, and the Observability Cloud is no exception. It is one of the premium-priced solutions on the market.
- Segregated Architecture: Logs typically live in the Splunk Platform, while metrics/traces live in Splunk Observability Cloud. Log Observer Connect correlates these without re-ingest. This separation can add architectural complexity versus a single-store design.
Verdict:
Splunk Observability Cloud is the ideal choice for large organizations already heavily invested in the Splunk ecosystem for log management, security, and SIEM. It offers an APM solution that integrates well with existing Splunk deployments. However, for companies without a prior Splunk investment, the high cost and segregated architecture make it a less compelling option.
9. Dynatrace
Dynatrace is an enterprise-grade, all-in-one observability and security platform distinguished by its heavy emphasis on AI-powered automation. Its core mission is to provide answers, not just data, by automatically identifying root causes.
Key Features & Strengths:
- AI-Powered Root Cause Analysis: Its strongest differentiator is the "Davis" AI engine, which automatically identifies dependencies, detects anomalies, and provides precise root-cause analysis with minimal manual configuration, significantly reducing Mean Time To Resolution (MTTR).
- Automated Discovery and Deployment: Its "OneAgent" technology offers a highly simplified, zero-touch deployment that automatically discovers all application and infrastructure components, providing a real-time topology map.
- Full-Stack Context: Dynatrace provides deep context with its proprietary "PurePath" tracing technology, which captures end-to-end transaction details.
Considerations & Trade-offs:
- Prohibitive Cost: Like other enterprise-focused tools, Dynatrace is very expensive and generally priced for large organizations, making it inaccessible for smaller teams.
- Proprietary Nature: While it supports OpenTelemetry, its primary value comes from the proprietary OneAgent and Davis AI. This can create a sense of being in a "black box" for some engineering teams and leads to potential vendor lock-in.
- UI Complexity: Users often describe the platform as a somewhat disjointed collection of tools with a steep learning curve, and documentation can be a pain point.
Verdict:
Dynatrace is best for large enterprises with complex, hybrid-cloud environments that are willing to pay a premium for a platform that heavily automates discovery, dependency mapping, and root-cause analysis. It suits organizations that prefer an AI-driven, hands-off approach to observability.
How to Migrate from Lightstep to SigNoz
Migrating from Lightstep to SigNoz is straightforward, thanks to OpenTelemetry. You won't need to change any code in your applications. The entire process involves re-configuring where your telemetry data is sent.
Here’s a simple 3-step guide:
Step 1: Get Started with SigNoz
The quickest way to start is with SigNoz Cloud. You can create an account in minutes and get a secure endpoint to send your data to. We offer a 30-day free trial account with access to all features.
Once you sign up, you'll find your ingestion details in the SigNoz UI under Settings -> Ingestion Details. You'll need the Region and Ingestion Key.
Step 2: Reconfigure Your OpenTelemetry Collector
You are likely using an OpenTelemetry Collector to send data to Lightstep. To switch to SigNoz, you just need to update the exporter configuration in your collector's YAML file (config.yaml).
Before (Lightstep Config):
Your old configuration probably looked something like this:
exporters:
  otlp/lightstep:
    endpoint: ingest.lightstep.com:443
    headers:
      "lightstep-access-token": "${LIGHTSTEP_ACCESS_TOKEN}"

service:
  pipelines:
    traces:
      receivers: [otlp]
      processors: [batch]
      exporters: [otlp/lightstep]
After (SigNoz Config):
Update the exporters section to point to the SigNoz Cloud endpoint for your region.
exporters:
  otlp/signoz:
    # Replace <REGION> with your SigNoz cloud region
    # ex: us, in, eu
    endpoint: "ingest.<REGION>.signoz.cloud:443"
    headers:
      "signoz-ingestion-key": "${SIGNOZ_INGESTION_KEY}"

service:
  pipelines:
    traces:
      receivers: [otlp]
      processors: [batch]
      # Switch the exporter to SigNoz
      exporters: [otlp/signoz]
Replace <REGION> with your actual SigNoz region (e.g., us, eu, or in) and set the SIGNOZ_INGESTION_KEY environment variable to your ingestion key from Step 1. After applying the new configuration, your telemetry will start flowing to SigNoz.
For a detailed guide, check out our documentation on migrating from an existing OpenTelemetry setup.
Step 3: Verify and Decommission
We recommend running both platforms in parallel for a short period. Once you've verified that all your data is flowing correctly into SigNoz and have recreated any necessary dashboards or alerts, you can safely decommission your Lightstep integration.
While migrating from Lightstep to any other platform, there are a few important caveats to keep in mind:
- Dashboards & Alerts: Existing dashboards, alerts, and saved queries in Lightstep cannot be directly ported. Teams will need to rebuild these in the new system.
- Collector Differences: If you were using Lightstep’s older custom exporter (before OpenTelemetry became the standard), you may need to adjust or replace those configurations when switching to a pure OTLP pipeline.
Also note that historical data cannot be migrated from Lightstep to SigNoz. You will be starting fresh in the new system.
Other Ways to Get Started with SigNoz
You can choose between various deployment options in SigNoz apart from SigNoz cloud (shown above).
Those who have data privacy concerns and can't send their data outside their infrastructure can sign up for either enterprise self-hosted or BYOC offering.
Those who have the expertise to manage SigNoz themselves or just want to start with a free self-hosted option can use our community edition.
Conclusion
The end-of-life for Lightstep is a significant event, but it's also an opportunity to move to a more resilient, open, and cost-effective observability stack. By choosing an OpenTelemetry-native platform like SigNoz, you not only find a safe landing place but also protect yourself from future vendor-driven disruptions. The migration is simpler than you might think, and the long-term benefits of owning your observability data are well worth the effort.
Hope we answered all your questions regarding Lightstep alternatives. If you have more questions, feel free to use the SigNoz AI chatbot, or join our slack community.
You can also subscribe to our newsletter for insights from observability nerds at SigNoz, get open source, OpenTelemetry, and devtool building stories straight to your inbox.
