Top 10 Log Aggregation Tools [2026 Comprehensive Guide]
Log aggregation is essential in software systems. In a distributed software system, there are numerous components that generate logs. Log aggregation tools centralize data from various sources, enabling efficient monitoring, troubleshooting, and analysis. This centralized approach makes monitoring, analysis, and troubleshooting much easier
In this article, we will discuss top 10 log aggregation tools, how they work, the benefits they offer, the top log aggregation tools currently in use, and how to choose the right log aggregator for your applications.
What is Log Aggregation?
Log aggregation is the process of collecting log data generated by various systems, applications, and services within a computing environment and storing them in a central location. The primary purpose of log aggregation is to centralize log data from multiple sources into a single location, typically a dedicated log management or monitoring system. This centralized repository makes it easier to search, query, analyze, and visualize log data effectively.
Log Aggregation in Log Management
Log management is a broader process that involves collecting, storing, processing, analyzing, monitoring, reporting, and disposing of log data to provide actionable insights for supporting troubleshooting, performance enhancement, or security monitoring. In the log management process, log aggregation is a critical part that comes first, after which other parts such as analysis, monitoring, and reporting can then be done.
What are Log Aggregation Tools
Log aggregation tools are software applications designed to collect, consolidate, and centralize log data from various sources across a computing environment. These tools enable organizations to gather logs generated by servers, applications, databases, networks, and other components into a single location for efficient analysis, monitoring, and management. Current log aggregation tools are mostly embedded in more comprehensive log management platforms that have other features in addition to log aggregation. In this section, we will look at how log aggregation tools work, their common features, and their benefits.
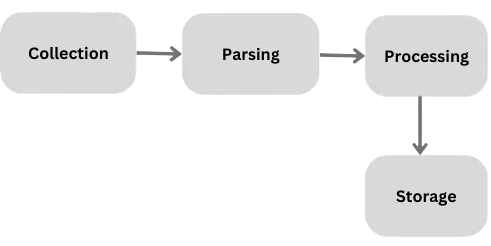
How Log Aggregation Tools Work
Log aggregation tools work following these series of steps:
-
Collection of Logs: Log aggregation starts with the collection of log data from various sources that have been previously identified. This can be done through different methods; through a standard logging protocol known as Syslog, streaming protocols like SNMP, Netflow, or IPFIX from network devices, real-time sources through an agent, or directly from network devices or systems via API or network protocol integration. Some log aggregation tools also utilize a combination of these methods.
-
Parsing: After logs have been collected, the next step is to parse the log data to derive meaningful insights. The parsing process involves extracting key pieces of information from each logged event and organizing them into a common format. Since logs originating from diverse sources may have varying formats, parsing ensures that all extracted data follow a standardized format. During parsing, logs are also filtered to eliminate irrelevant entries or flag anomalies that may indicate security threats.
-
Processing: After the log data has been parsed, it is then processed. The processing may involve:
- Augmenting log data with additional context to provide more meaningful insights during analysis. This can include adding information such as hostnames, IP addresses, geographical locations, user identities, or any other relevant contextual data. This process is called enrichment.
- Masking sensitive data with placeholder values or pseudonyms to ensure compliance with privacy regulations and protect sensitive data.
- Correlating relationships and dependencies between different log events or across multiple log sources.
- Quality assurance checks to ensure accuracy, completeness, and consistency. This may involve validation against predefined rules or patterns to identify any anomalies, or errors in the log data.
Storage:
Following these steps, the log data is then indexed and stored. Most log management platforms compress the logs before storing them because compression reduces network bandwidth and storage costs for logs. When storing logs, log aggregators have retention policies, which are user-indicated and dictate how long the logs should be stored before removal. In some cases, depending on requirements, instead of total removal, old logs are archived in less expensive storage with higher latency.
Common Features of Log Aggregation Tools
Let’s look at some of the features of log aggregation tools. The following are features common to log aggregation tools:
-
Efficient Data Collection: Log aggregation tools have mechanisms for collecting log data from various sources such as servers, applications, and networking devices.
-
Robust Processing: These tools also include robust processing capabilities to parse, filter, and enrich log data, ensuring it's structured for analysis.
-
Real-time Monitoring: Most log aggregation tools offer real-time monitoring functionalities, allowing users to monitor system and application performance and detect issues promptly.
-
Scalability: Log aggregation tools commonly support scalability and can handle increasing volumes of log data.
-
Security: Log aggregation tools incorporate robust security features, such as encryption-in-rest, encryption-in-transit, and access controls, to safeguard log data.
-
Alerting: Most log aggregation tools include customizable alerting mechanisms to notify users about important events or anomalies detected in the log data.
-
Integration and Extensibility: Log aggregation tools support integration with other systems, mostly comprehensive log management systems, and offer APIs, SDKs, and plugins for extending their functionality to meet specific requirements.
Benefits of using Log Aggregation Tools
Now, let’s look at the benefits of log aggregation tools;
- Centralized Log Management: One major benefit of log aggregation tools is that they provide a central platform for managing logs from various sources.
- Real-time Monitoring: Using log aggregation tools also helps provide real-time visibility into system and application events.
- Easy debugging and troubleshooting: By providing a comprehensive view of events, log aggregation tools enable easier troubleshooting and debugging.
- Trend identification : Trends and patterns can be easily identified, and can be helpful in detecting anomalies, and optimizing system performance.
- Cost Saving: By centralizing log management and analysis, log aggregation tools reduce the time and resources required for managing logs separately.
Top Log Aggregation Tools
Let’s look at the top log aggregation tools that are currently in use. In this section we will review their specific features, the pros, and the cons.
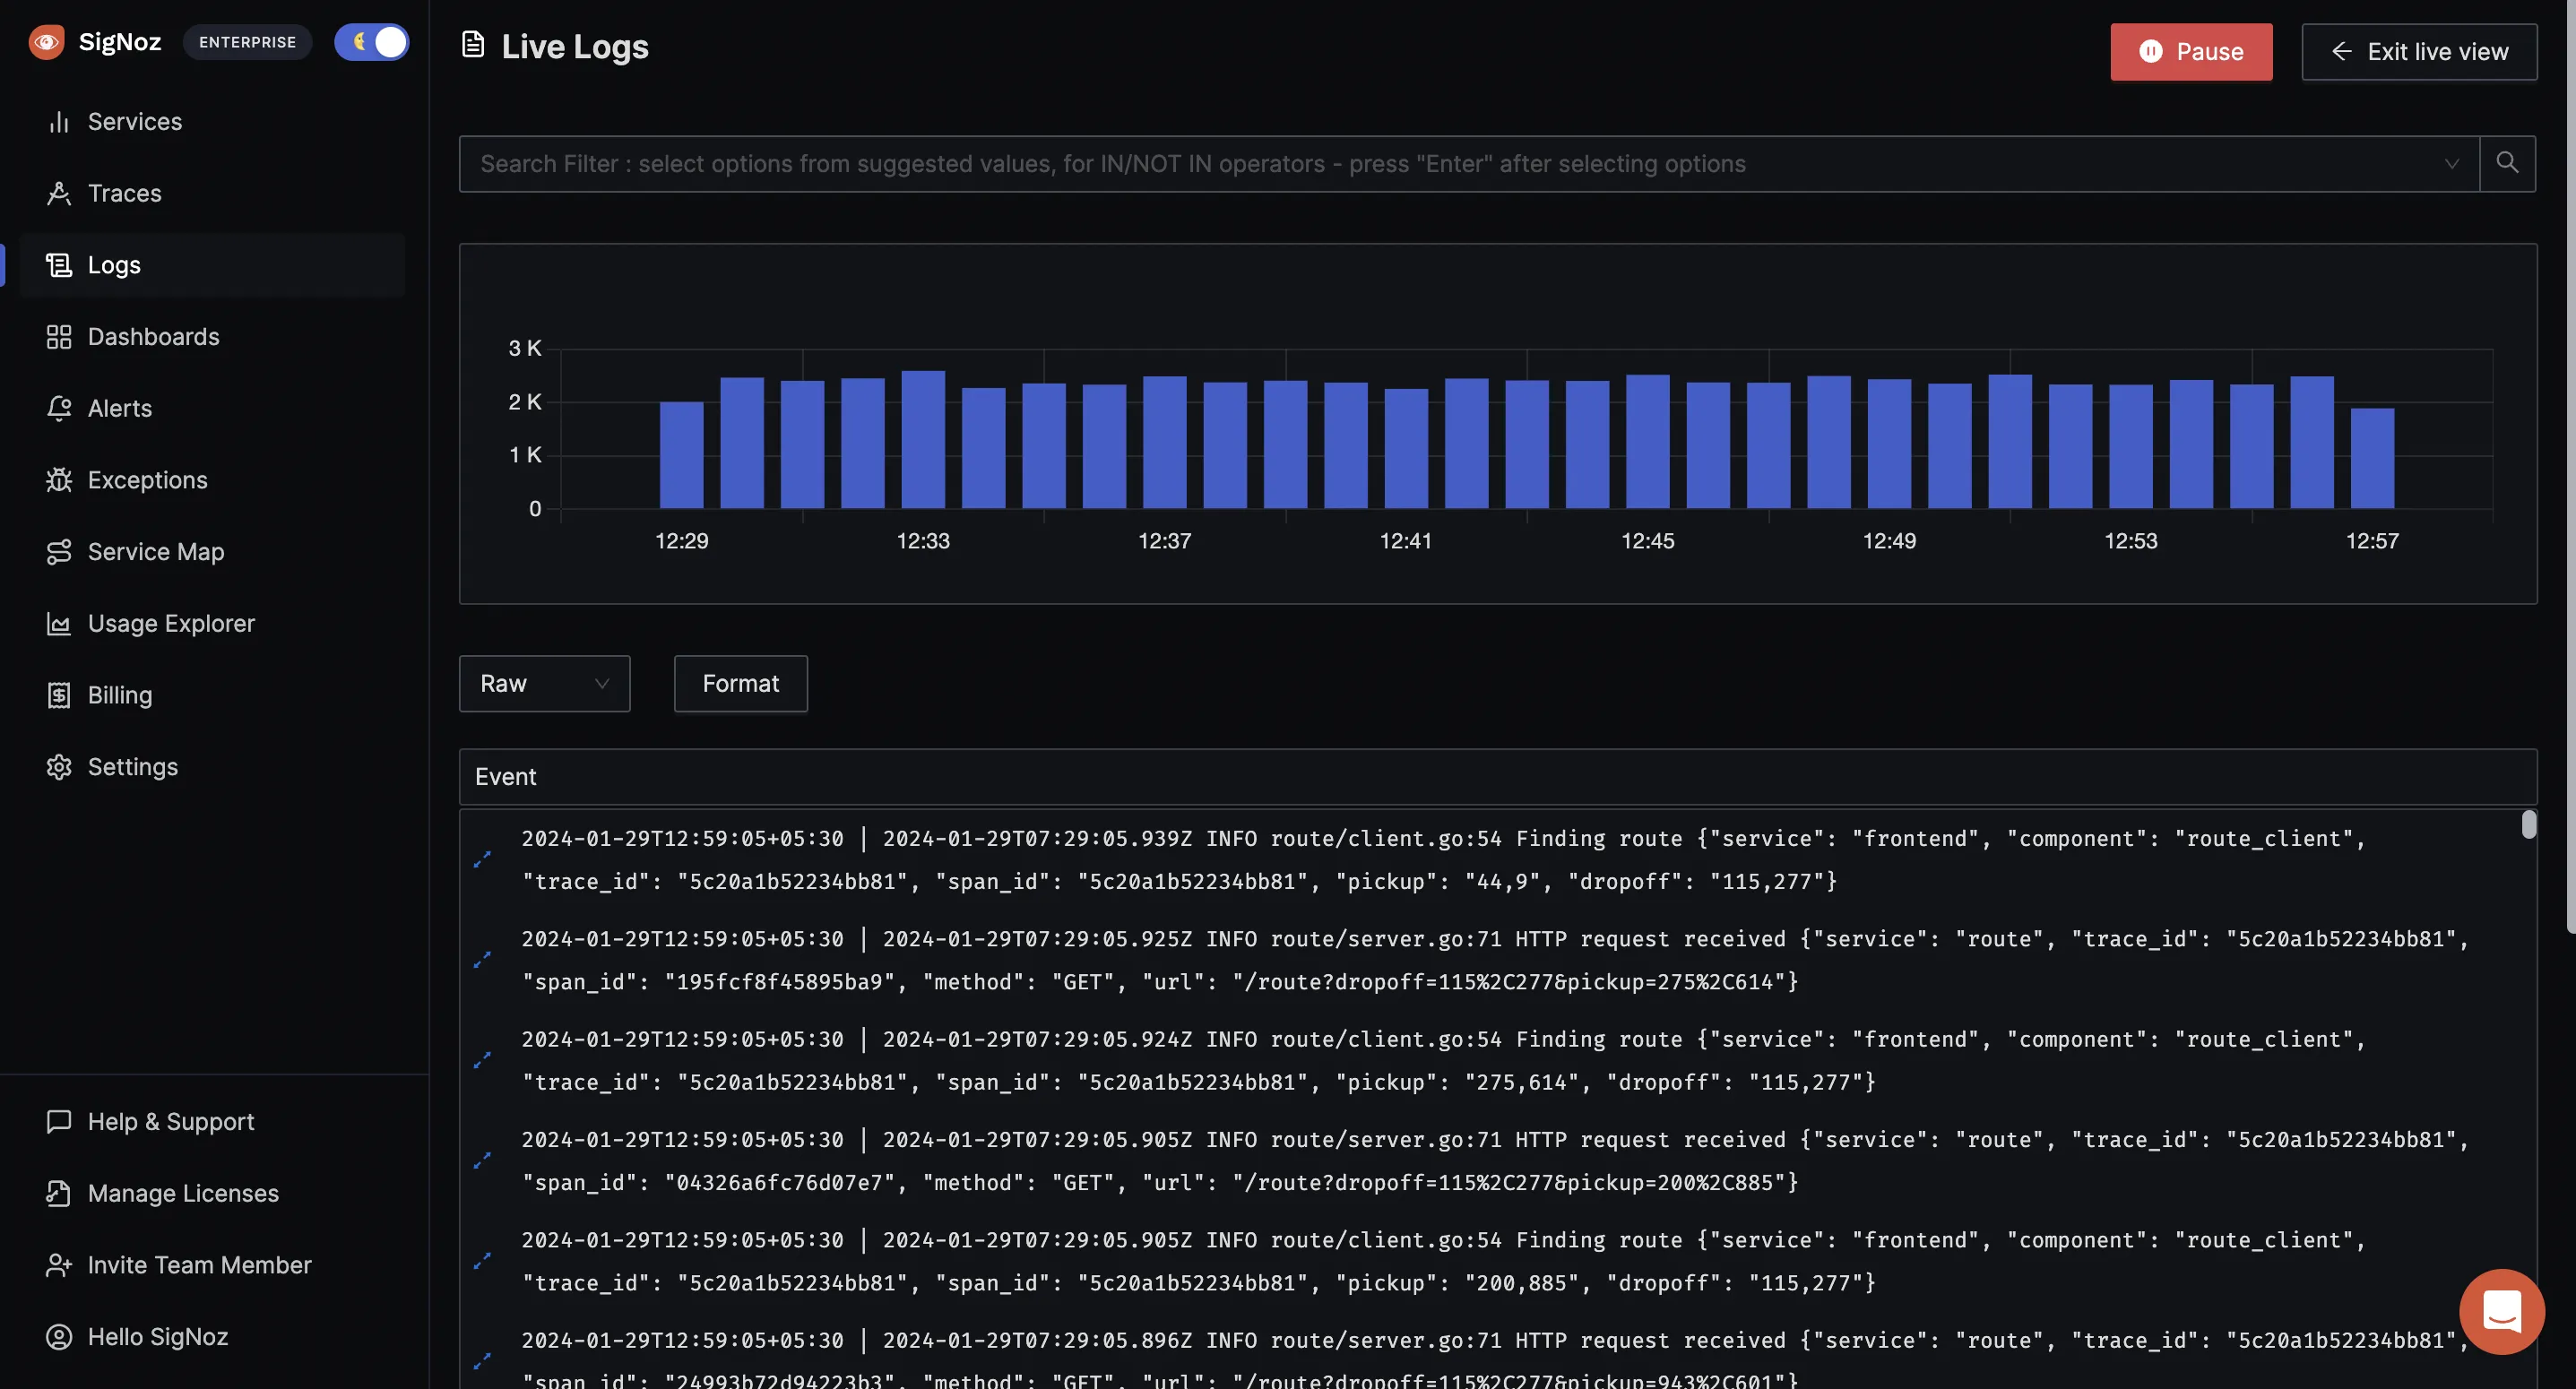
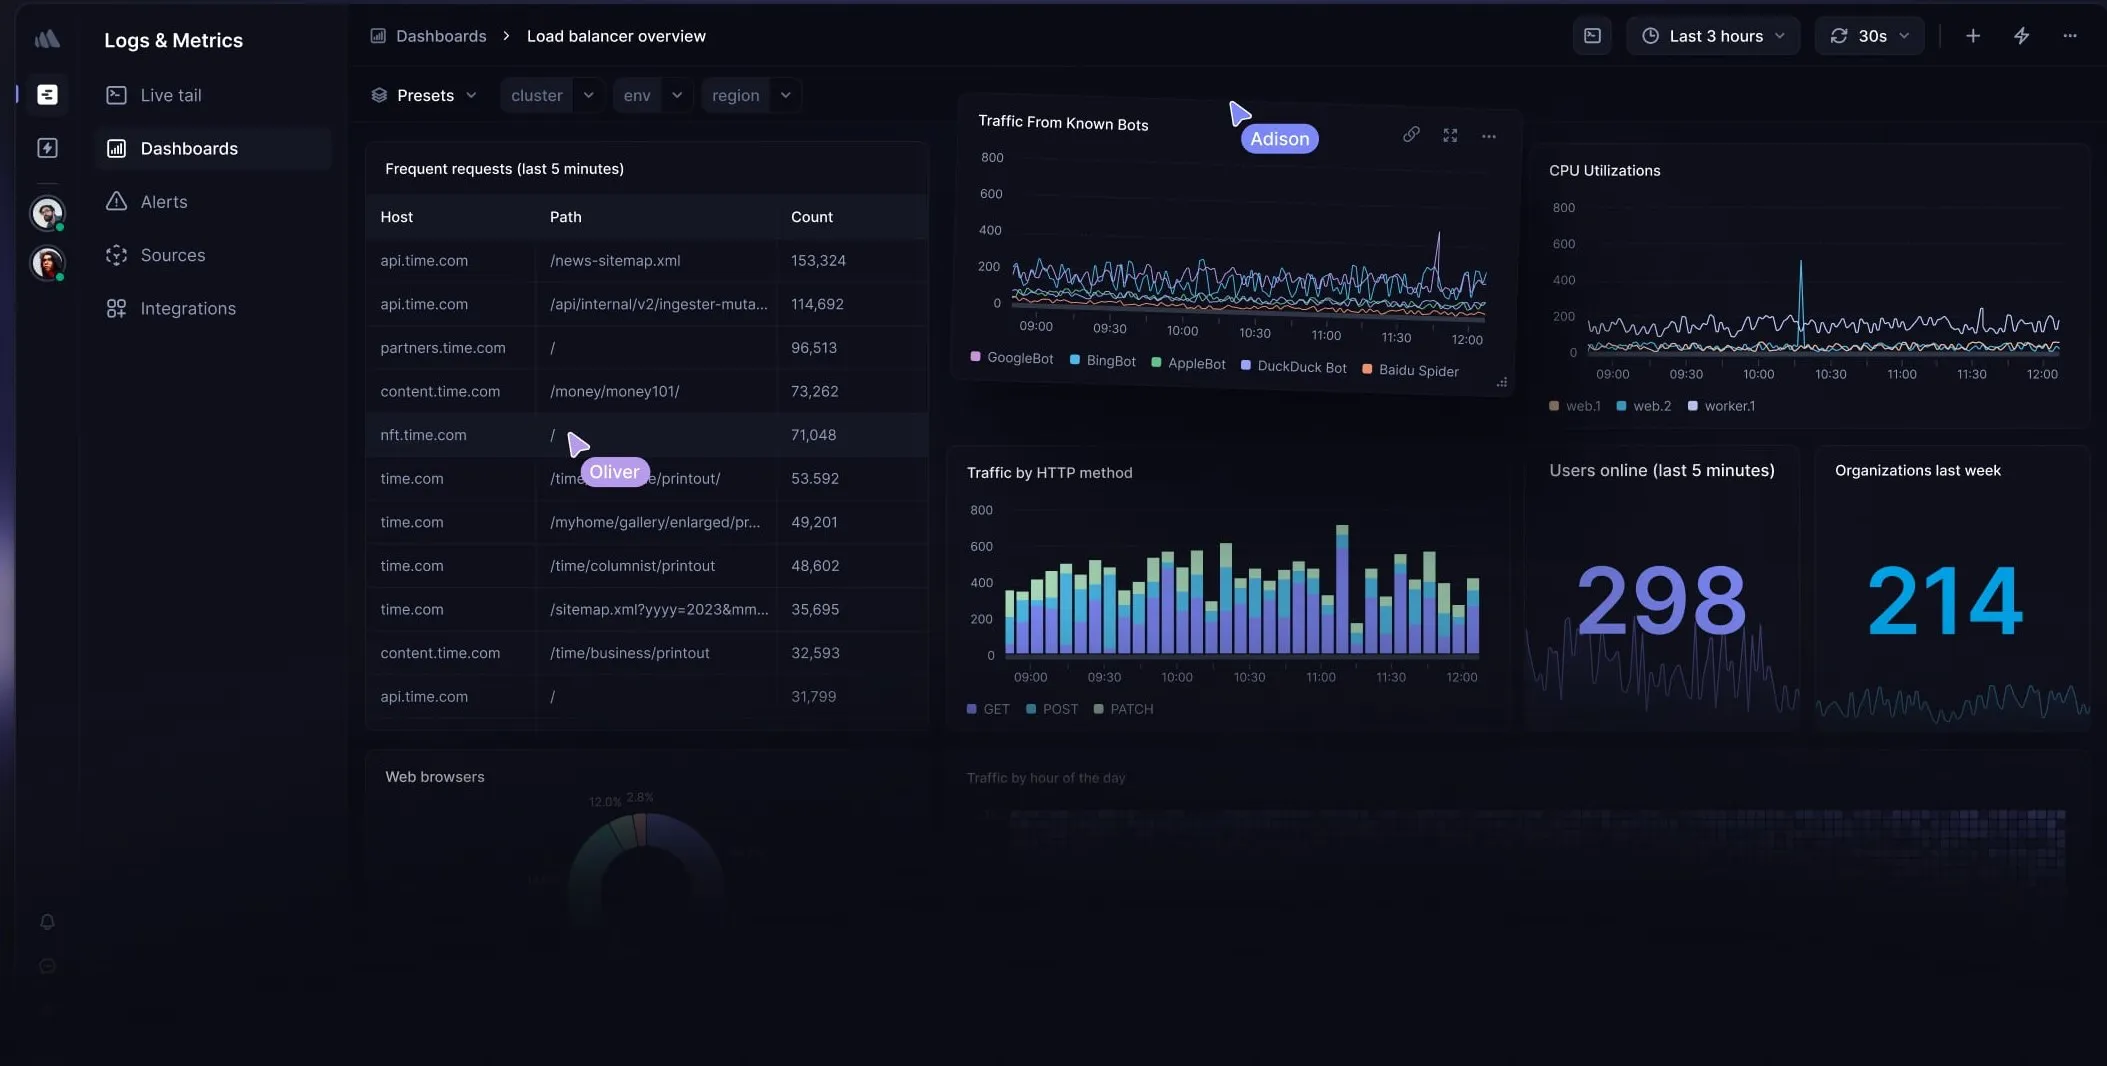
SigNoz
SigNoz WebsiteSigNoz is an open-source observability platform that provides logs, traces, and metrics in a single application. It is an open-source alternative to platforms like DataDog and NewRelic.
SigNoz natively supports OpenTelemetry for collecting logs, and all the features that are present with OpenTelemetry for logs are supported by SigNoz. You also need to install OpenTelemetry Collector to collect and send logs to SigNoz(in most cases).
SigNoz is available as open-source software and a cloud offering. Signing up for SigNoz Cloud is the easiest way to get started with SigNoz. You can also self-host SigNoz; instructions to self-host can be found here.
Features of SigNoz
- SigNoz provides metrics, traces, and logs under a single pane of glass.
- It monitors application metrics like p99 latency, error rates for services, external API calls, and individual endpoints.
- It runs aggregates on trace data to get business-relevant metrics.
- It filters and queries logs and builds dashboards and alerts based on attributes in logs.
- It monitors infrastructure metrics such as CPU utilization or memory usage.
Pros
- Best of Both Worlds: SigNoz uses advanced columnar storage, offering the storage efficiency of tools like Loki with the fast query speeds of index-heavy tools like Elastic. You don't have to choose between cost and performance.
- SigNoz makes use of columnar data stores, which makes aggregating queries very fast.
- It is easy to set alerts with SigNoz DIY query builder.
- It is easy and straightforward to set up and use.
- Transparent Usage-Based Pricing: Unlike other tools, SigNoz charges based on logs ingested ($0.3/GB), with no hidden fees for user seats or hosts.
- Future-proof with LLM Observability: Monitor AI applications (OpenAI, Anthropic) alongside your logs and traces.
Cons
- SigNoz does not support Windows; it only runs on Mac and Linux OS.
Sumo Logic
Sumo Logic WebsiteSumo Logic is a platform that provides cloud monitoring, log management, and real-time insights for web and SaaS based apps. Sumo Logic provides exceptional log aggregation and log parsing functionality. It can collect logs from almost any system with timestamps and format and bring them together to support an end-to-end log management process.

Features
- Powerful search and AI-powered analytics capabilities that can help reduce troubleshooting times.
- Real-time monitoring and alerting.
- Sumo Logic architecture supports scalability and flexibility and can adapt to evolving log data volumes.
- Sumo logic provides Cloud SIEM and Infrastructure security.
Pros
- It provides efficient Log ingestion.
- It has extensive REST API capabilities in managing log sources, source configurations, dashboard data, and searches.
- Simple user interface.
Cons
- Quite complex and slow to set up.
- It has limited Collaboration Features- only the user who creates saved search queries, alerts, reports, or dashboards is the only one who can edit them.
- Queries can be difficult to compose sometimes.
Logtail
BetterStack WebsiteLogtail(now known as BetterStack) is an observability tool with a log aggregation feature that collect logs across various stacks with SQL-compatible structured logging in real time. With Logtail you can examine, organize, and store logs in a structured format ,search them and create custom reports using SQL. You can then save the reports as a dashboard, giving you and your team an overview of your entire stack.
Features
- SQL-compatible structured log management.
- Anomaly detection that alerts you when your logs become out of the ordinary.
- Compatible storage with hosted Grafana.
- Secure by design.
Pros
- Structured logging and SQL log querying.
- Enables team collaboration.
- Cheap pricing.
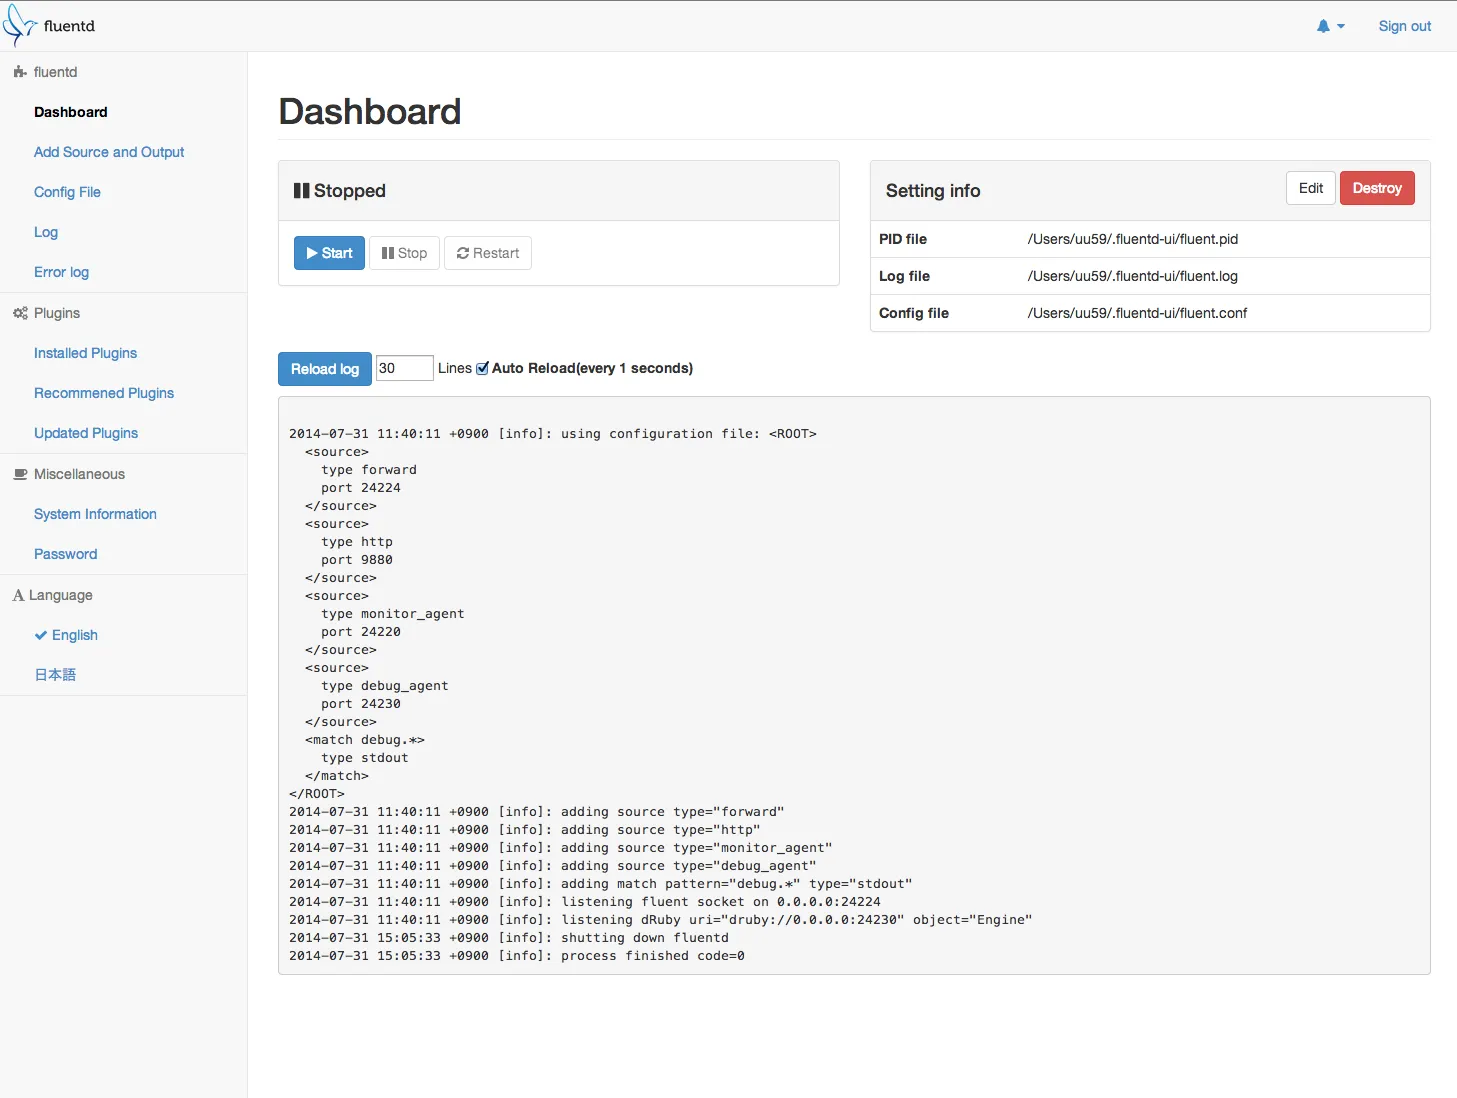
Fluentd
Fluentd WebsiteFluentd is an open-source data collector that enables the unification of data collection and consumption so as to enhance the understanding and usage of data. Fluentd is capable of collecting, parsing, transforming, analyzing, and storing various types of data. It prioritizes structuring data as JSON, and this allows it to effectively integrate all aspects of log data processing, including collection, filtering, buffering, and distribution, across various sources and destinations. It also provides a wide array of plugins to collect data from different sources and store it in different destinations.
Features
- Unified logging with JSON.
- Fluentd has a flexible plugin system that allows the community to extend its functionality
- Built-in Reliability.
Pros
- Simple and easy to set up.
- Proven Reliability and Performance.
- Requires very little system resource.
- The large plugin system makes Fluentd highly customizable.
Cons
- It is difficult to monitor and debug Fluentd internal issues, e.g., out of buffer.
- Other monitoring tools, such as DataDog or Prometheus are needed to collect fluent metrics.
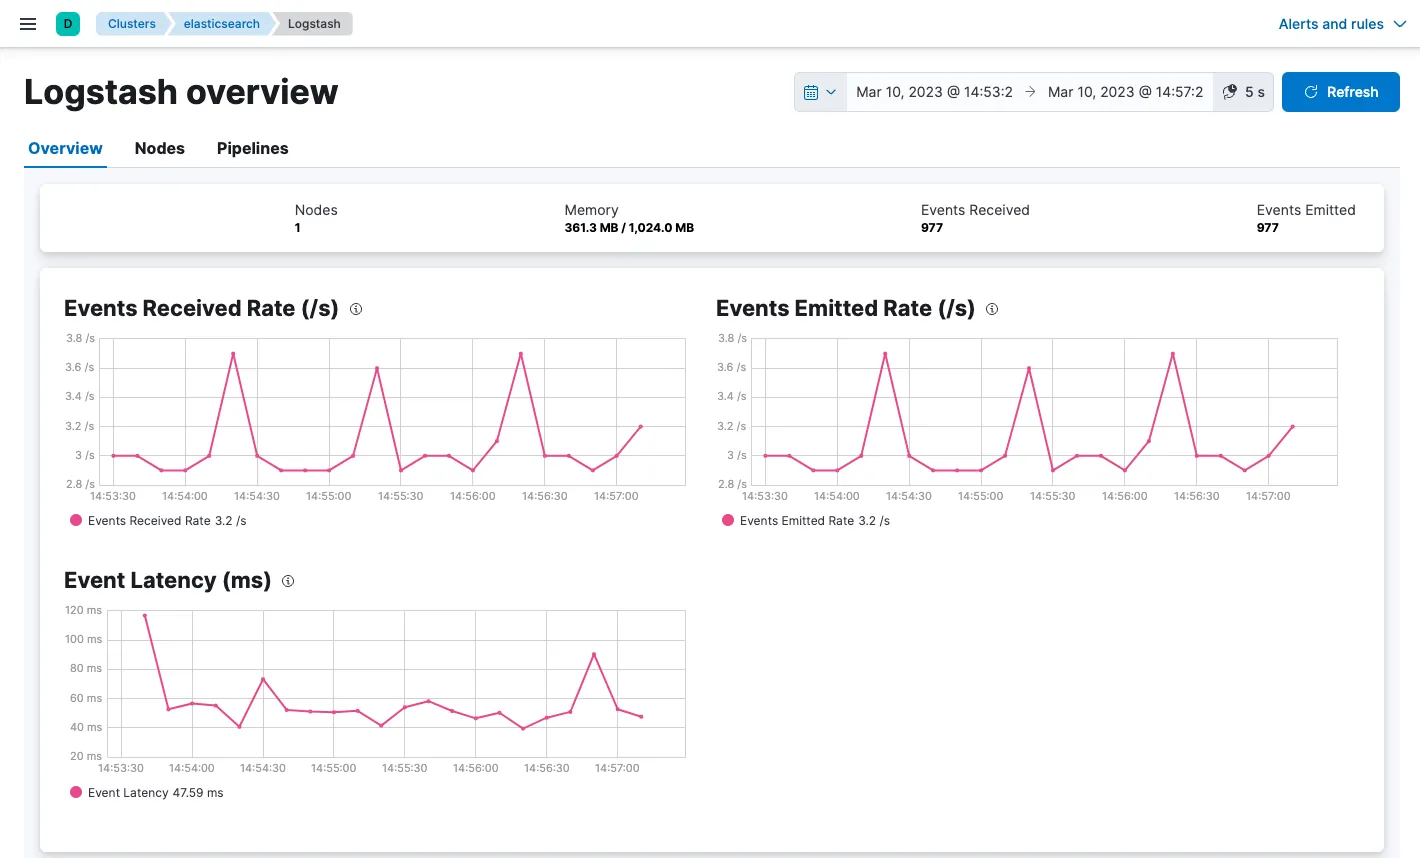
LogStash
LogStash WebsiteLogstash is part of the ELK(Elasticsearch, Logstash, Kibana) Stack, a widely used log analysis platform. It is an open-source data collection engine whose primary function involves aggregating data from various origins, processing it, and transmitting it along the pipeline, typically for direct indexing in Elasticsearch. Logstash can extract data from nearly any data source using its input plugins, apply diverse data transformations and enhancements through filter plugins, and dispatch the processed data to numerous destinations via output plugins.
Features
- Open source.
- Logstash dynamically ingests, transforms, and ships your data regardless of format or complexity.
- Logstash has a pluggable framework featuring over 200 plugins.
Pros
- It is durable and secure. If Logstash nodes fail, Its Persistent Queue guarantees delivery for your in-flight events at least once.
- Flexibility, due to the number of plugins.
- Straightforward configuration.
Cons
- Logstash itself is all command line and does not provide a user interface unless it is connected to virtualization tools like Kibana.
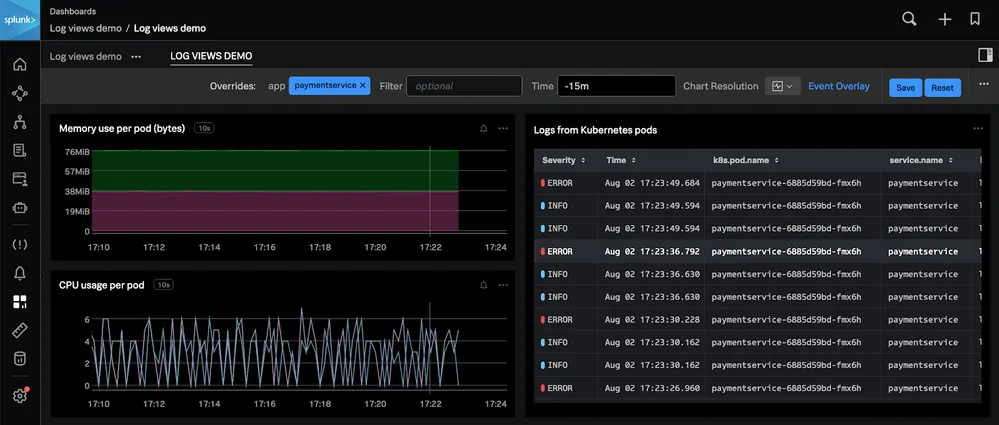
Splunk
Splunk WebsiteSplunk is a comprehensive log analysis platform that collects, indexes, and analyzes massive volumes of machine-generated data from various sources, including messaging systems, databases, network devices, and more. With it’s Search Processing Language(SPL), Splunk makes it easy to search and analyze large amounts of data in real-time, and it also provides pre-built visualizations for creating informative dashboards. Also, Splunk is does not only provide log analytics features, but also extend to application management, compliance, and security.
Features
- Splunk provides a dashboard and data visualization.
- Enables monitoring, alerting, and reporting.
- Provision of Machine Learning Toolkit.
- Enables a great level of scalability and flexibility.
- Splunk provides rich SDKS that allows easy integration with various external applications.
Pros
- Splunk ensures data safety by maintaining multiple copies of indexed data.
- Splunk's intuitive interface and powerful search language make it accessible to all users.
- Splunk benefits from a large and active community, offering extensive resources and support.
- Splunk's commercial nature ensures robust security features.
Cons
- Splunk's enterprise-grade status often makes it expensive to implement.
- The complexity of Splunk results in a steep learning curve for new users.
- Scaling Splunk requires significant hardware resources and infrastructure investment.
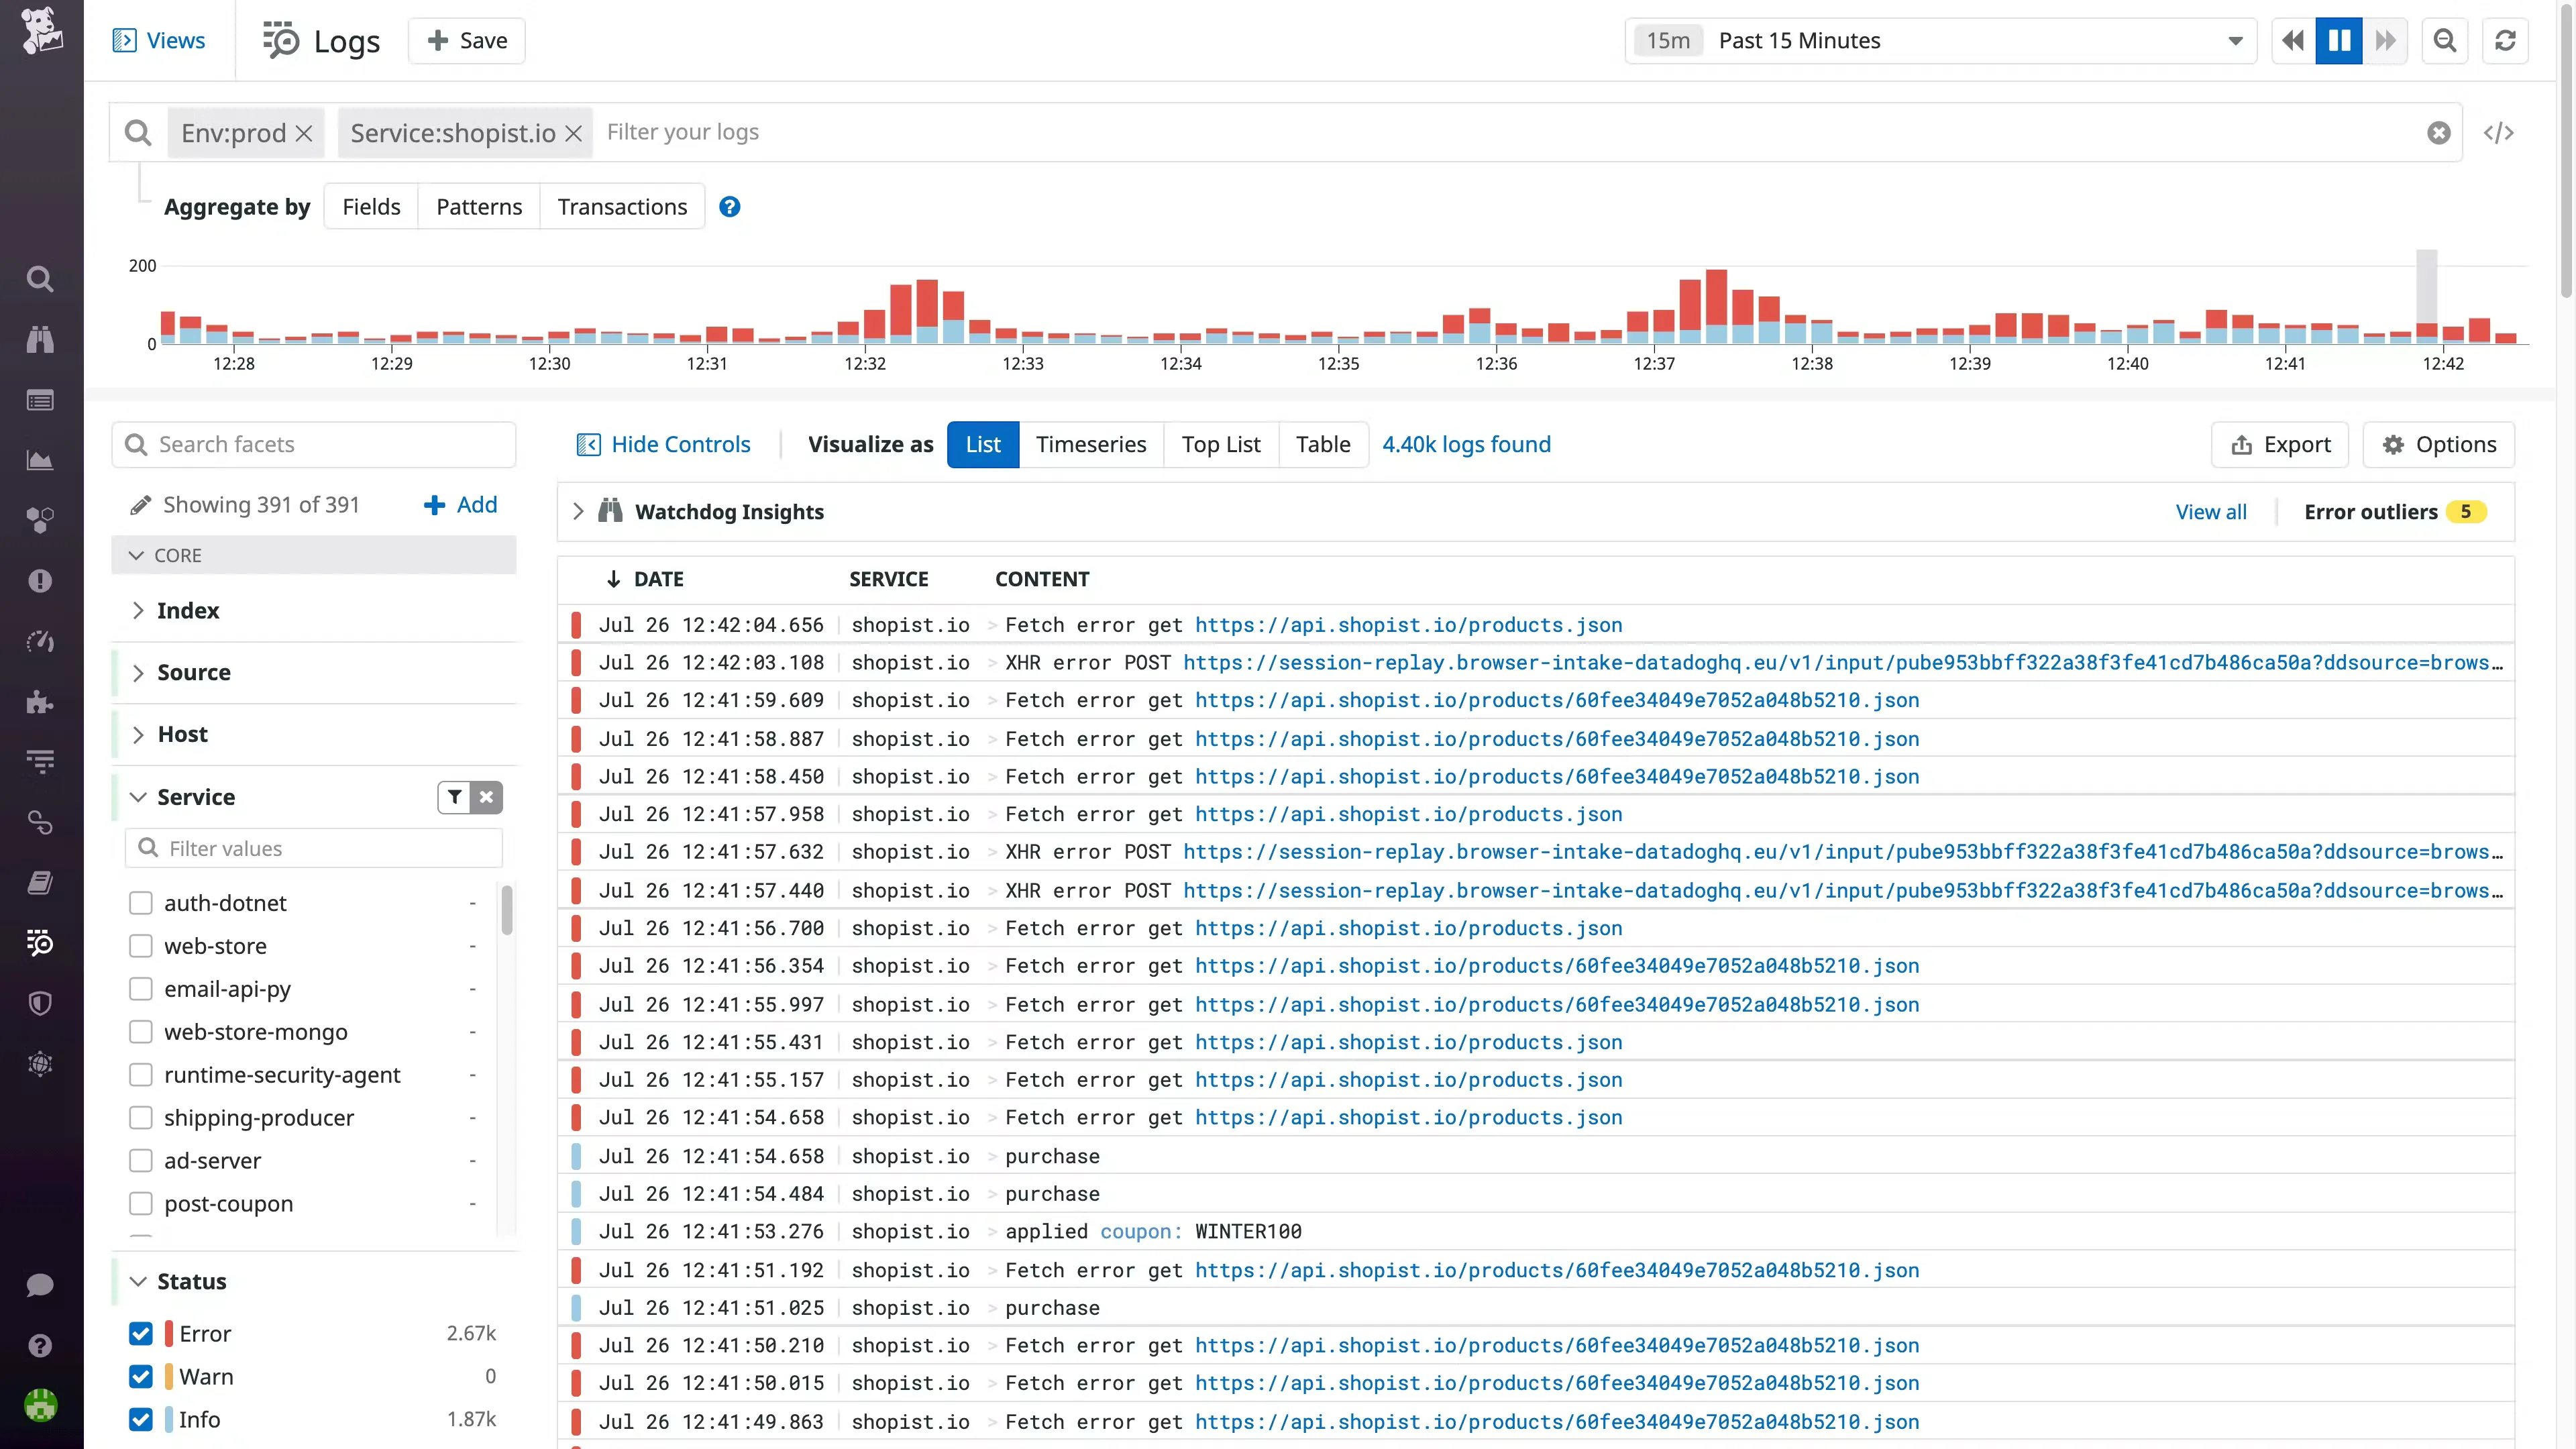
Datadog
Datadog WebsiteDatadog is a cloud-based monitoring and analytics platform that provides real-time insights into complex IT environments. It helps organizations of all sizes to monitor their infrastructure, applications, logs, and other data sources in a unified manner, enabling them to identify and resolve issues before they impact their customers quickly.
At its core, Datadog collects data from various sources, including servers, databases, cloud services, containers, and other applications. It then uses it to create customizable dashboards, alerts, and reports that provide a comprehensive view of the entire infrastructure.
Features
- Rapid troubleshooting and analytics with no querying language.
- Process, enrich, and route all your logs from one control panel.
- Flexibly store all logs at any retention and querying capacity.
- Seamless correlation with the full context in an integrated platform.
- Scalable log management for every stack.
Pros
- Powerful and configurable UI.
- Easy to set up and run.
- Real-time tracking and monitoring of logs.
Cons
- Complex Log Ingestion, Indexing, and Retention Process.
- Scaling Challenges- With scale, Datadog becomes both expensive and harder to use.
- It also has a very complex pricing structure.
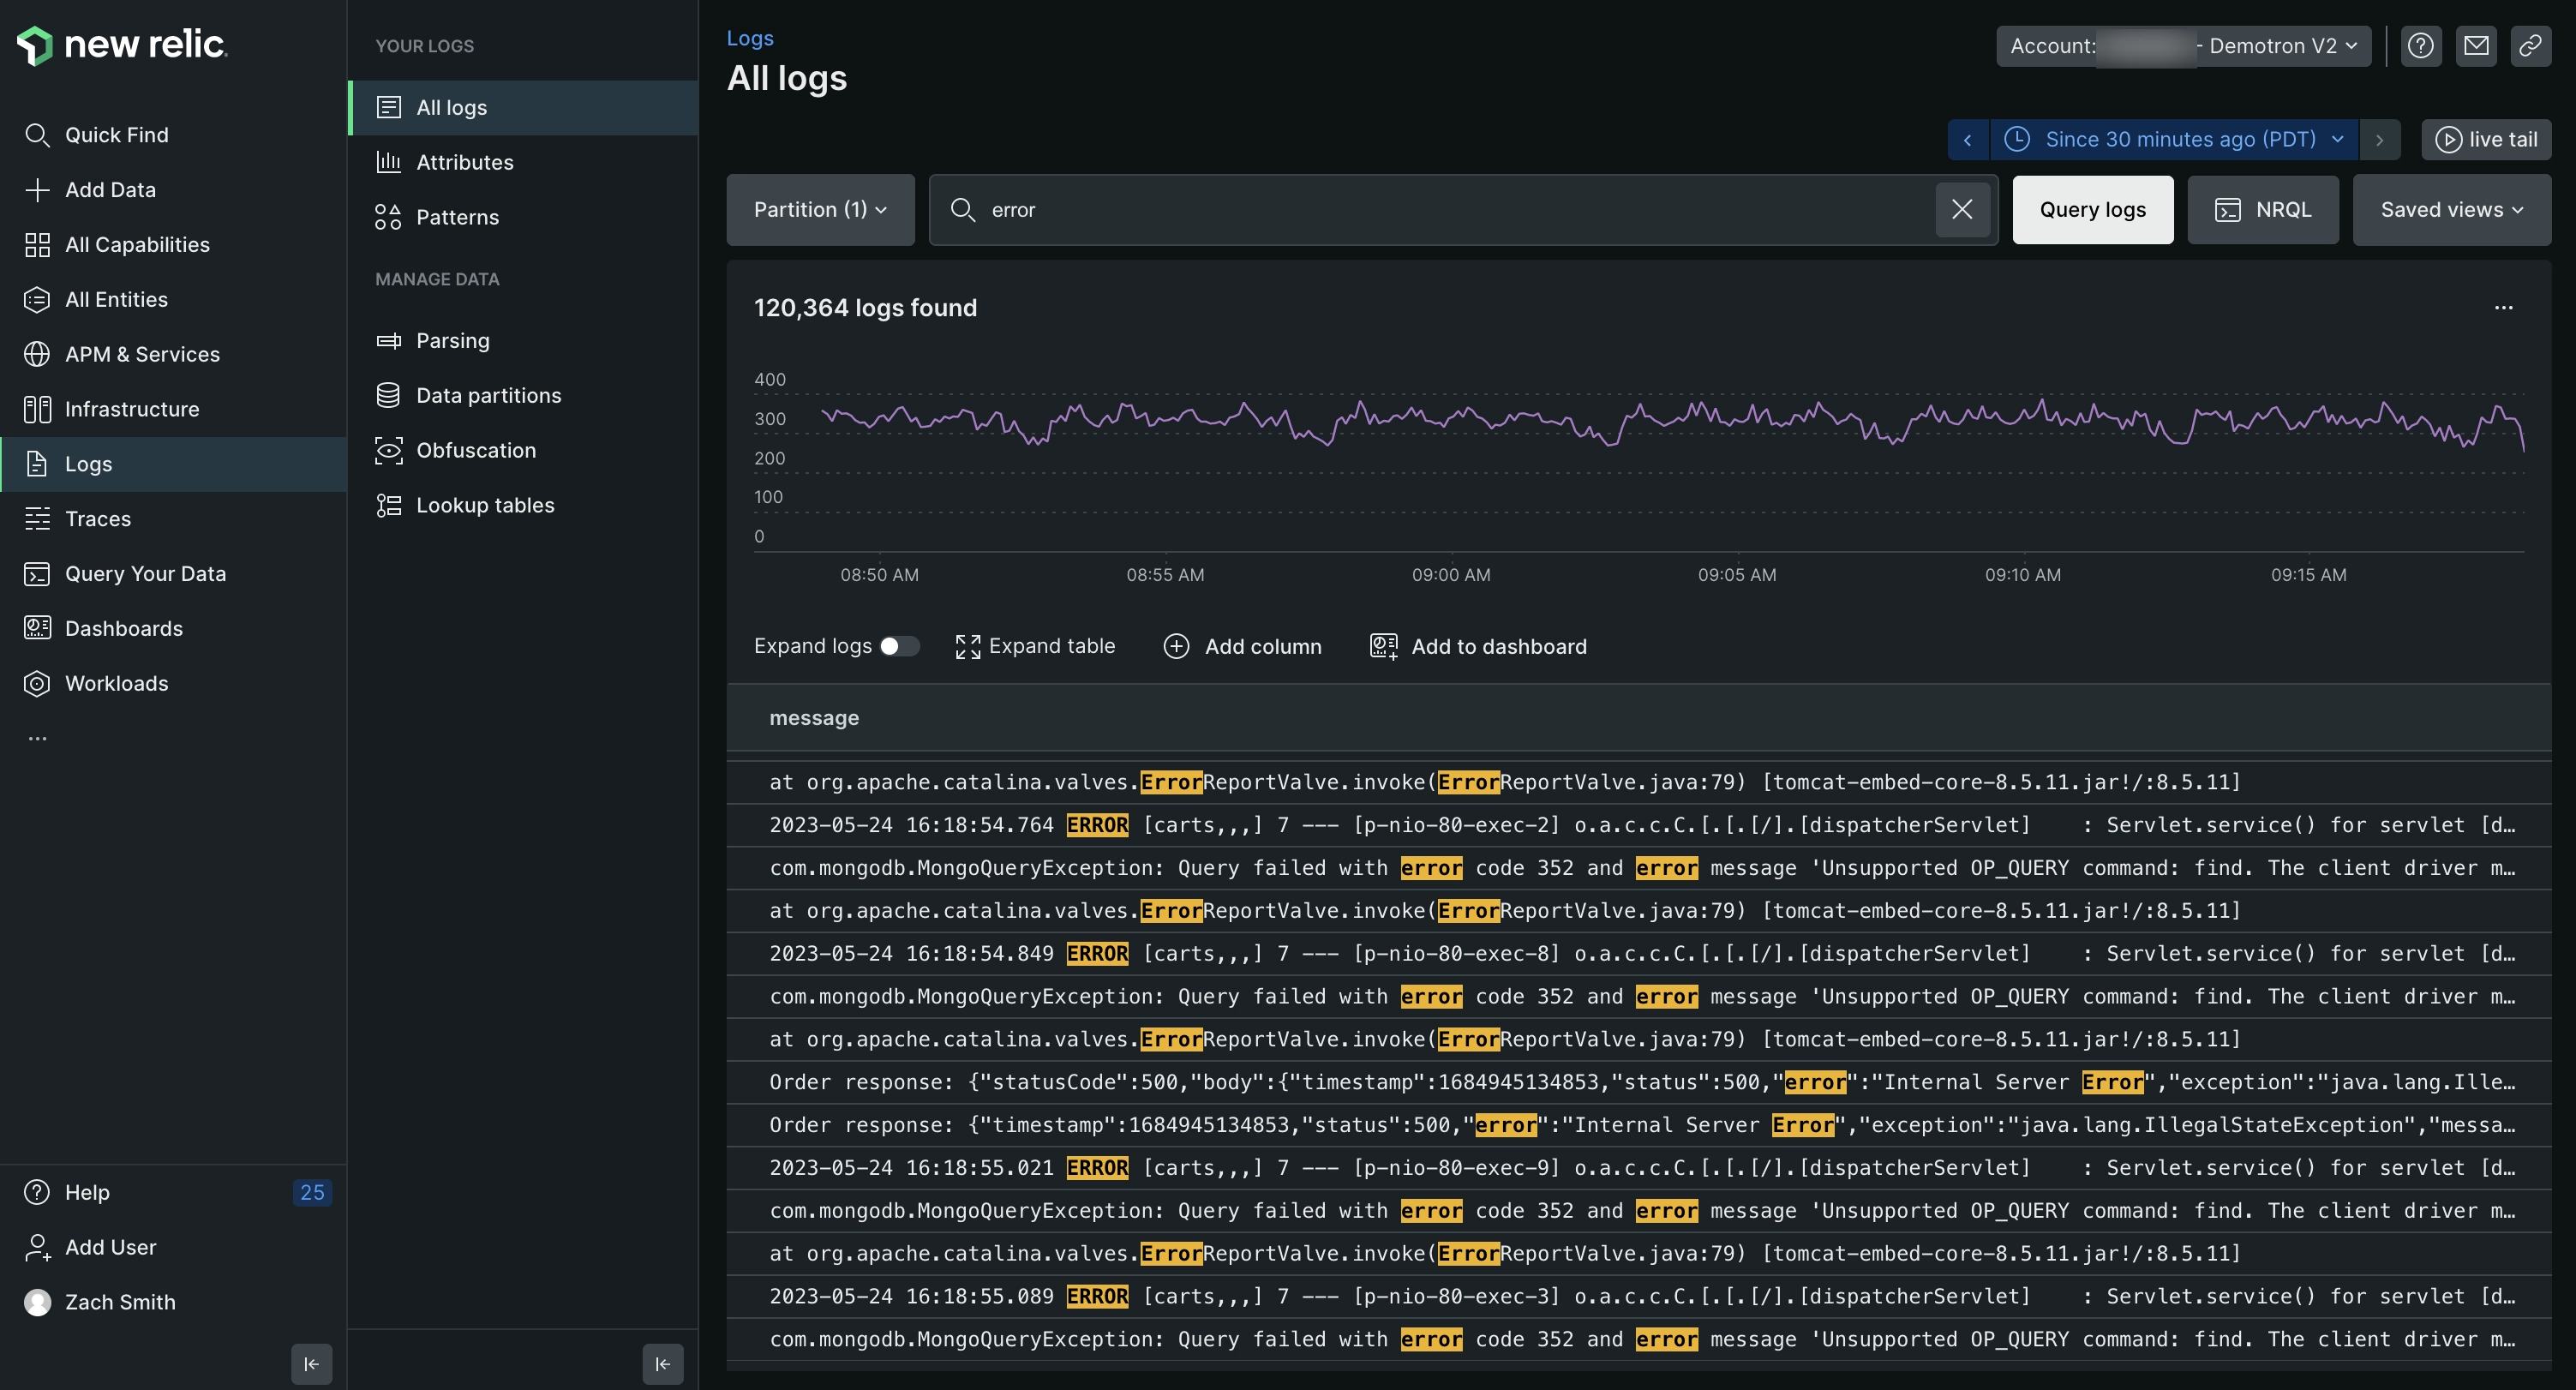
New Relic
New Relic WebsiteNew Relic is a cloud-based network monitoring and observability platform for full-stack monitoring. New Relic offers a fast, scalable log management platform to collect and connect your logs with the rest of your telemetry and infrastructure data in a single place. This log management solution provides deeper visibility into application and infrastructure performance data (events, errors, traces, and more) to reduce mean time to resolution (MTTR) and quickly troubleshoot production incidents.
Features
- New Relic leverages the power of a central telemetry data platform.
- It enables Applied Intelligence.
- It enables real-time alerts.
- Serverless monitoring and Incident management.
- New Relic offers integration with various third-party applications, including Terraform, Microsoft Azure, Consul, MySQL, Elasticsearch, Google BigQuery, and MongoDB.
Pros
- New relic enables easy searching through logs.
- Easily troubleshoot performance issues without switching between other tools.
- You can visualize and analyze everything(events, logs or traces,) in a single place with new relic.
Cons
- As an enterprise tool, it comes with licensing costs, which may be too costly, especially for small organizations.
Grafana Loki
Grafana Loki WebsiteGrafana Loki is a log aggregation system inspired by Prometheus. It is designed to be very cost-effective and easy to operate. It does not index the contents of the logs, but rather a set of labels for each log stream. This makes it an attractive option for developers who want "grep-like" searching without the high storage costs of full-text indexing.
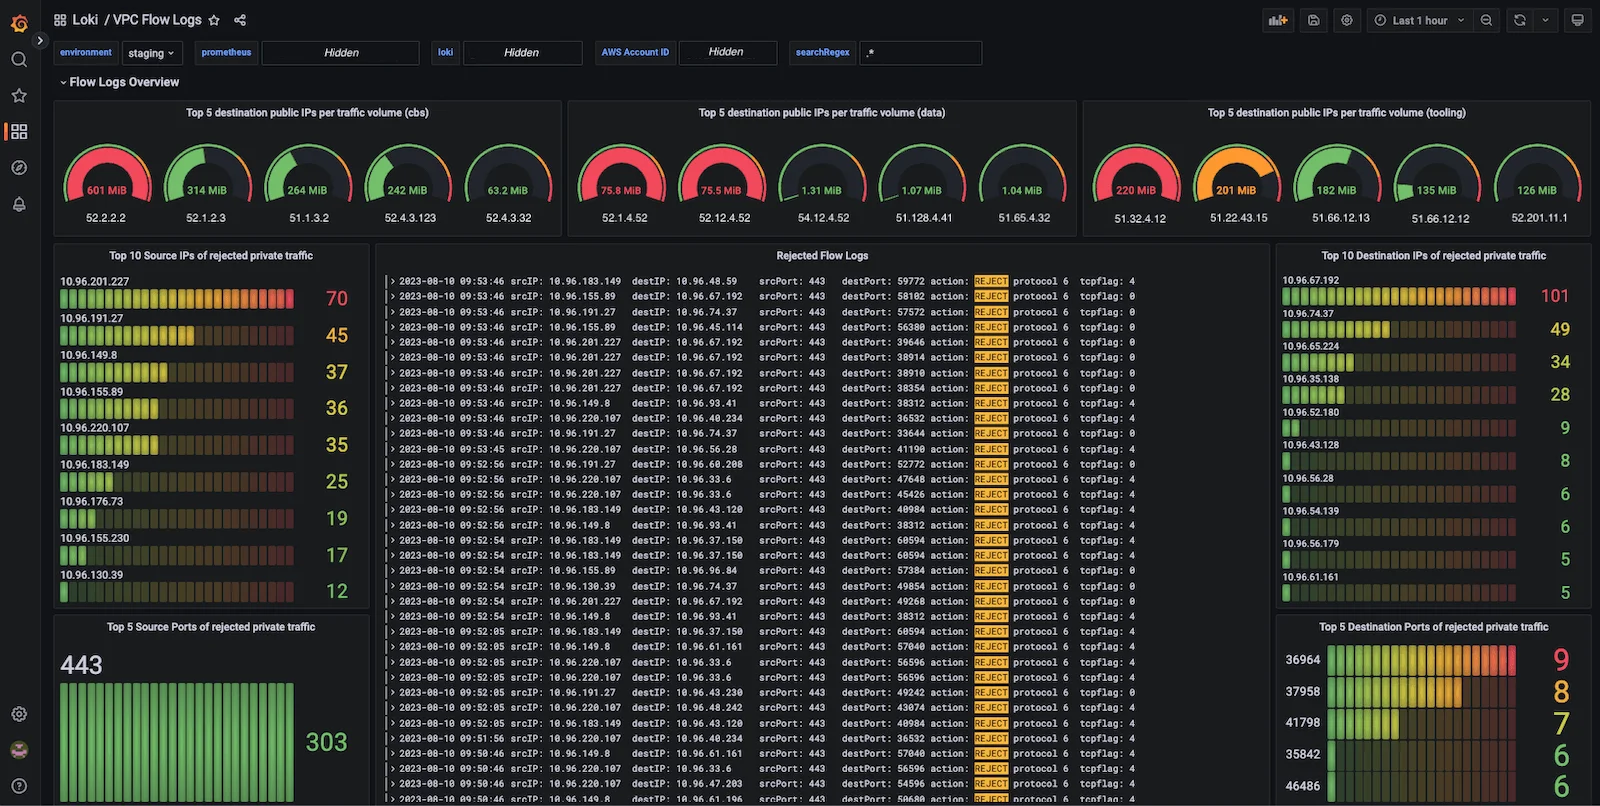
Features
- Label-based Indexing: Only indexes metadata (labels), making ingestion and storage very efficient.
- Tightly integrated with Grafana: Visualize logs alongside metrics in the same dashboard.
- Multi-tenancy: Supports multiple tenants sharing a single instance.
Pros
- Extremely Low Storage Cost: Because it doesn't index log content, it uses significantly less storage than tools like Elasticsearch.
- Great for Kubernetes: native integration with Prometheus and Kubernetes environments.
Cons
- Slow "Needle in a Haystack" Searches: Since log content isn't indexed, searching for a specific error string across terabytes of logs can be slower than full-text search tools ("Distributed Grep" approach).
- Query Language Complexity: LogQL has a steep learning curve compared to simple search bars.
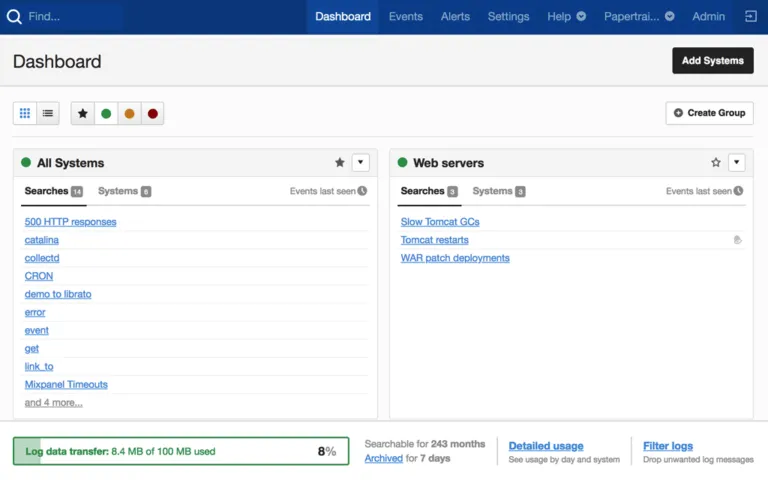
SolarWinds Papertrail
Papertrail WebsiteSolarWinds Papertrail provides cloud-based log management solution that seamlessly aggregates logs from applications, servers, network devices, services, platforms, and much more. The live tail capability in Papertrail allows you to tail logs in real time, with pause, search, infinite scroll, and selectable log elements.
Papertrail can be used with a wide variety of log types, including Syslog, text log files, Apache, MySQL, Ruby on Rails, Windows events, Tomcat, Heroku apps, routers, firewalls, and many more.
Features
- Built-in search functionality that utilizes query syntax methodology to filter data across multiple sources.
- The ability to create comprehensive per-user access control policies, automated backups, and archives of up to a year of historical data.
- API that can integrate with several third-party solutions.
Pros
- Papertrail has an intuitive web-based log viewer.
- Papertrail provides encrypted logging.
- It enables fast search.
Cons
- The log filtering feature in paper trail is a bit complex to use
- For small organizations, it is too expensive.
Choosing the right Log Aggregation tool
The first thing to consider when choosing a log aggregation tool is your need; consider the qualities and features of the log aggregation tool; does it align with your use case? does it meet the needs of your applications? can it handle the volume of logs generated by your systems? does it support the types of logs generated by your systems? is it compatible with your existing infrastructure? Also, check if the tool's storage capabilities, security, and encryption features, as well as data retention policies, meet your requirements.
Another factor you should consider is the pricing, log aggregation tools come with varying pricing models. Therefore, evaluating whether the tool fits your budget constraints is essential.
Another critical aspect to consider is ease of use. Consider the tool’s user interface, as well as ease of setup and configuration. Also, evaluate the level of support offered by the tool's provider, including documentation, customer service, and community forums. A tool with robust support resources can help address any issues or challenges that may arise during implementation and usage.
Conclusion
Log aggregation tools are crucial in efficiently managing log data and providing actionable insights. Throughout this article, we have explored the concept of log aggregation, its significance within log management, the features and benefits of various log aggregation tools, as well as the factors to consider when choosing a log aggregation tool for your systems. Choosing the right log aggregation tool requires considering factors like functionality, scalability, security, pricing, ease of use, and support. By aligning these considerations with your organizational needs, you can make an informed decision to optimize logging and monitoring practices.
An open-source tool like SigNoz is a good option to consider when deciding on log aggregation tools for your systems. SigNoz seamlessly integrates with OpenTelemetry and can aggregate logs from various sources. It also visualizes Traces, Metrics, and Logs in a single application, making it easy to manage, monitor, and analyze log data. Additionally, when using SigNoz, you can easily get support from its documentation and amazing open-source community.
Getting Started with SigNoz
SigNoz Cloud is the easiest way to run SigNoz. Sign up for a free account and get 30 days of unlimited access to all features.

You can also install and self-host SigNoz yourself since it is open-source. With 24,000+ GitHub stars, open-source SigNoz is loved by developers. Find the instructions to self-host SigNoz.
Further Reading:
8 open source log management tools that you may consider
