Best Microservices Monitoring Tools in 2026: Open-Source vs. SaaS
TL;DR:
- Fragmented vs. Unified: Traditional OSS tools (Prometheus, Jaeger) are fragmented. Modern platforms unify metrics, logs, and traces.
- Key Choices: You can choose between proprietary SaaS (Datadog), a fragmented DIY stack, or an OTel-native platform like SigNoz that unifies all three pillars.
- Evaluation: Base your decision on OpenTelemetry support, Kubernetes integration, and the cost model (e.g., per-GB vs. per-host).
Monitoring microservices is complex. Unlike a monolith, you have dozens or hundreds of independent services communicating over a network. A single user request can span multiple services, making it difficult to pinpoint why something is slow or where an error occurred.
In our previous guide to microservices monitoring, we covered the fundamentals of why you need to collect metrics, logs, and traces. Now, we'll answer the next logical question: what are the best tools for the job?
This article compares the top open-source and commercial microservices monitoring tools, providing a clear framework to help you choose the right stack for your team.
What are the best microservices monitoring tools?
The most common traditional stack combines Prometheus (for metrics) and Grafana (for dashboards) with a separate tracing tool like Jaeger or Zipkin.
While this stack is powerful, it's fragmented, requiring teams to maintain multiple systems. This is why modern tools are moving to unify all telemetry. These tools are increasingly instrumented via OpenTelemetry, the vendor-neutral standard.
This leads to two primary choices for a unified experience:
- Proprietary SaaS Platforms: Tools like Datadog, New Relic, and Dynatrace offer a closed-source, all-in-one experience, correlating metrics, logs, and traces but comes at a significant cost.
- Open-Source OTel-Native Platforms: SigNoz leads this category. It provides a single, unified platform for metrics, traces, and logs, and is built to be OpenTelemetry-native from the ground up. This gives teams a powerful, flexible alternative to both the fragmented open-source stack and proprietary SaaS, with both self-hosted and cloud options.
How to Choose a Microservices Monitoring Tool
Before you compare tools, you need a framework. The "best" tool depends on your environment, team size, budget, and data requirements. Here are the key criteria to evaluate.
1. The Three Pillars: Metrics, Logs, and Traces
Does the tool handle all three pillars of observability?
- Metrics: For high-level health (latency, error rates, traffic).
- Traces: To follow a request's path across services.
- Logs: For detailed, event-level context.
A tool that unifies all three in one UI is ideal, as it lets you jump from a spike in a metric chart, to the specific traces causing it, to the exact error logs for that trace ID.
2. OpenTelemetry (OTel) Native Support
Is the tool compatible with OpenTelemetry? OTel is the CNCF standard for instrumentation. Choosing a tool that is OTel-native means you instrument your code once and can send that data to any compatible backend. This prevents vendor lock-in and is the modern standard for cloud-native applications.
3. Service Maps & Auto-Discovery
In a microservices architecture, services change constantly. A good tool must automatically discover new services (e.g., new pods in Kubernetes) and generate a service dependency map. This map visually shows you which services talk to each other, helping you understand the blast radius of a failure.
4. Kubernetes & Container Integration
Most microservices run on Kubernetes. Your tool needs first-class Kubernetes support. This means:
- An easy way to deploy (e.g., a Helm chart).
- Automatic scraping of pod and node metrics.
- The ability to filter and group telemetry by Kubernetes metadata (e.g.,
namespace,deployment,pod_name).
5. Alerting & SLOs
A tool isn't useful if it can't notify you of problems. Look for flexible alerting that integrates with tools like Slack and PagerDuty. More advanced platforms will also allow you to define and monitor Service Level Objectives (SLOs), which are crucial for managing reliability.
6. Scalability & Data Retention
Microservices generate a massive amount of data. Can the tool scale to handle your load? How long can it store data? A system that uses an efficient database (like ClickHouse) or offers scalable long-term storage (like Thanos or Cortex for Prometheus) is essential.
7. Cost Model (Pricing)
This is a major differentiator.
- Per-Host/Per-Agent: You pay based on the number of servers or agents you run. This is the model for many APM tools like Datadog and New Relic.
- Per-GB Ingested: You pay for the amount of data you send. This is common for log-heavy tools like Splunk and OTel-native platforms like SigNoz.
- Per-Time-Series: You pay for the number of unique metric series (Prometheus-based).
The per-GB model is often more predictable and cost-effective for microservices, as you don't get penalized for scaling up pods during peak traffic.
Top Open-Source Microservices Monitoring Tools
Open-source tools give you maximum flexibility and control. You can self-host them, avoid vendor lock-in, and customize them to your needs. However, they typically require more engineering effort to set up and maintain.
1. Prometheus & Grafana
The de-facto open-source standard for metrics and alerting. Prometheus is a time-series database and scraping engine, while Grafana is the visualization layer.
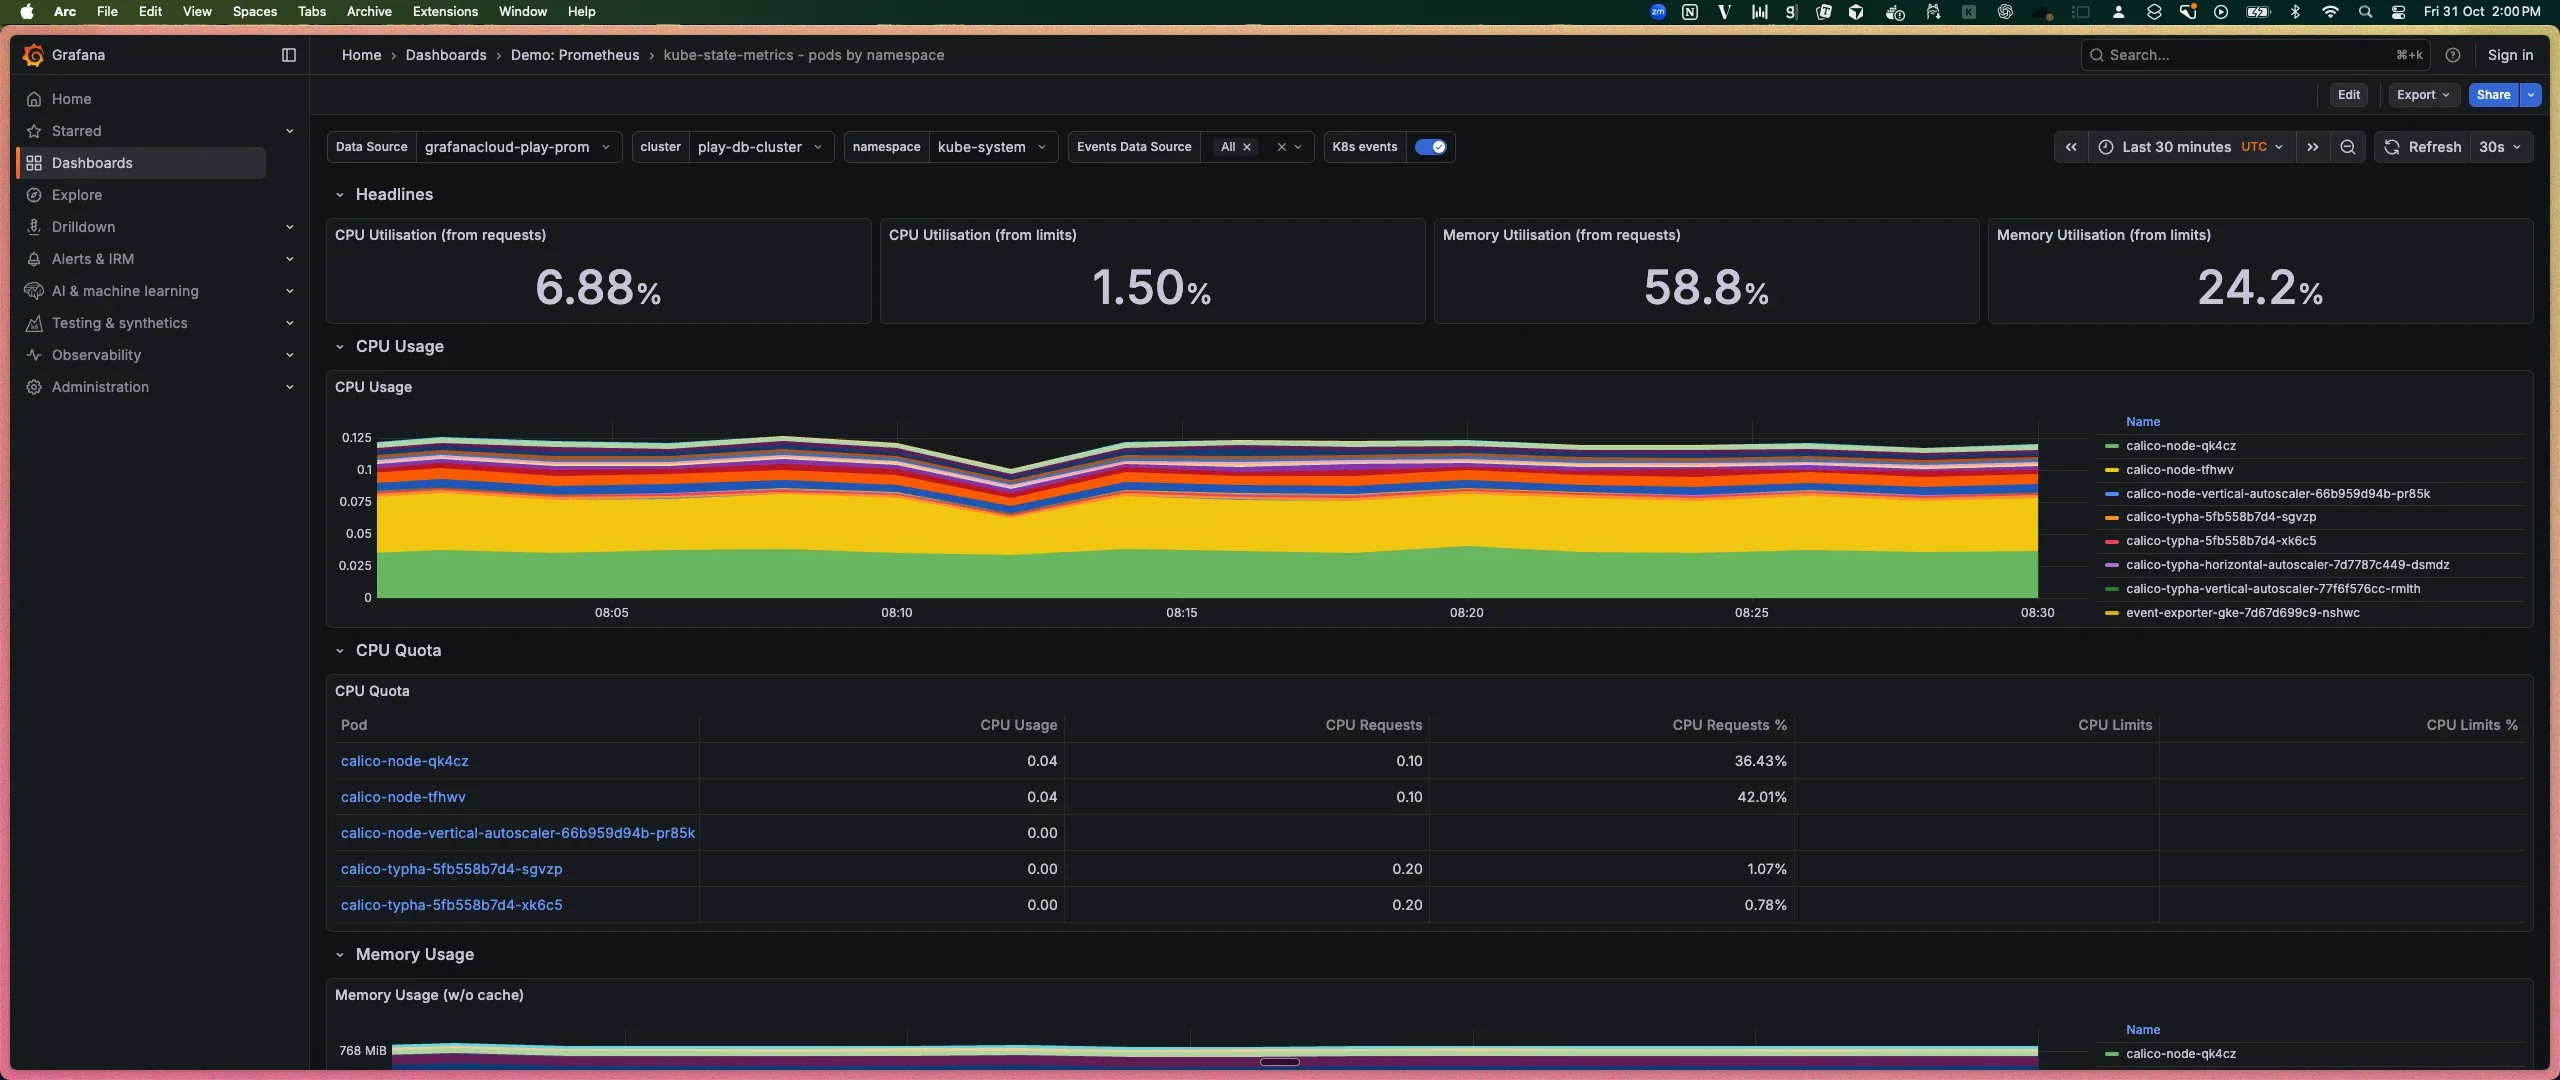
A prometheus dashboard in Grafana (credits: prometheus)
Best for: Kubernetes monitoring, metrics, and dashboards.
Key Features:
- Prometheus: Powerful PromQL query language, strong Kubernetes integration (service discovery), and a vast ecosystem of "exporters" for collecting metrics from third-party systems.
- Grafana: Beautiful, customizable dashboards that can pull data from Prometheus, Loki, Jaeger, and many other sources.
Pricing: Free and open-source.
Limitations: Prometheus itself is not a full observability solution. It only handles metrics. For a complete stack, you must integrate it with other tools like Jaeger (for traces) and Loki (for logs). Scaling Prometheus for long-term storage also requires extra components like Thanos or Cortex.
2. Jaeger (+ OpenTelemetry)
An open-source, end-to-end distributed tracing system, originally built by Uber and now a CNCF graduated project.
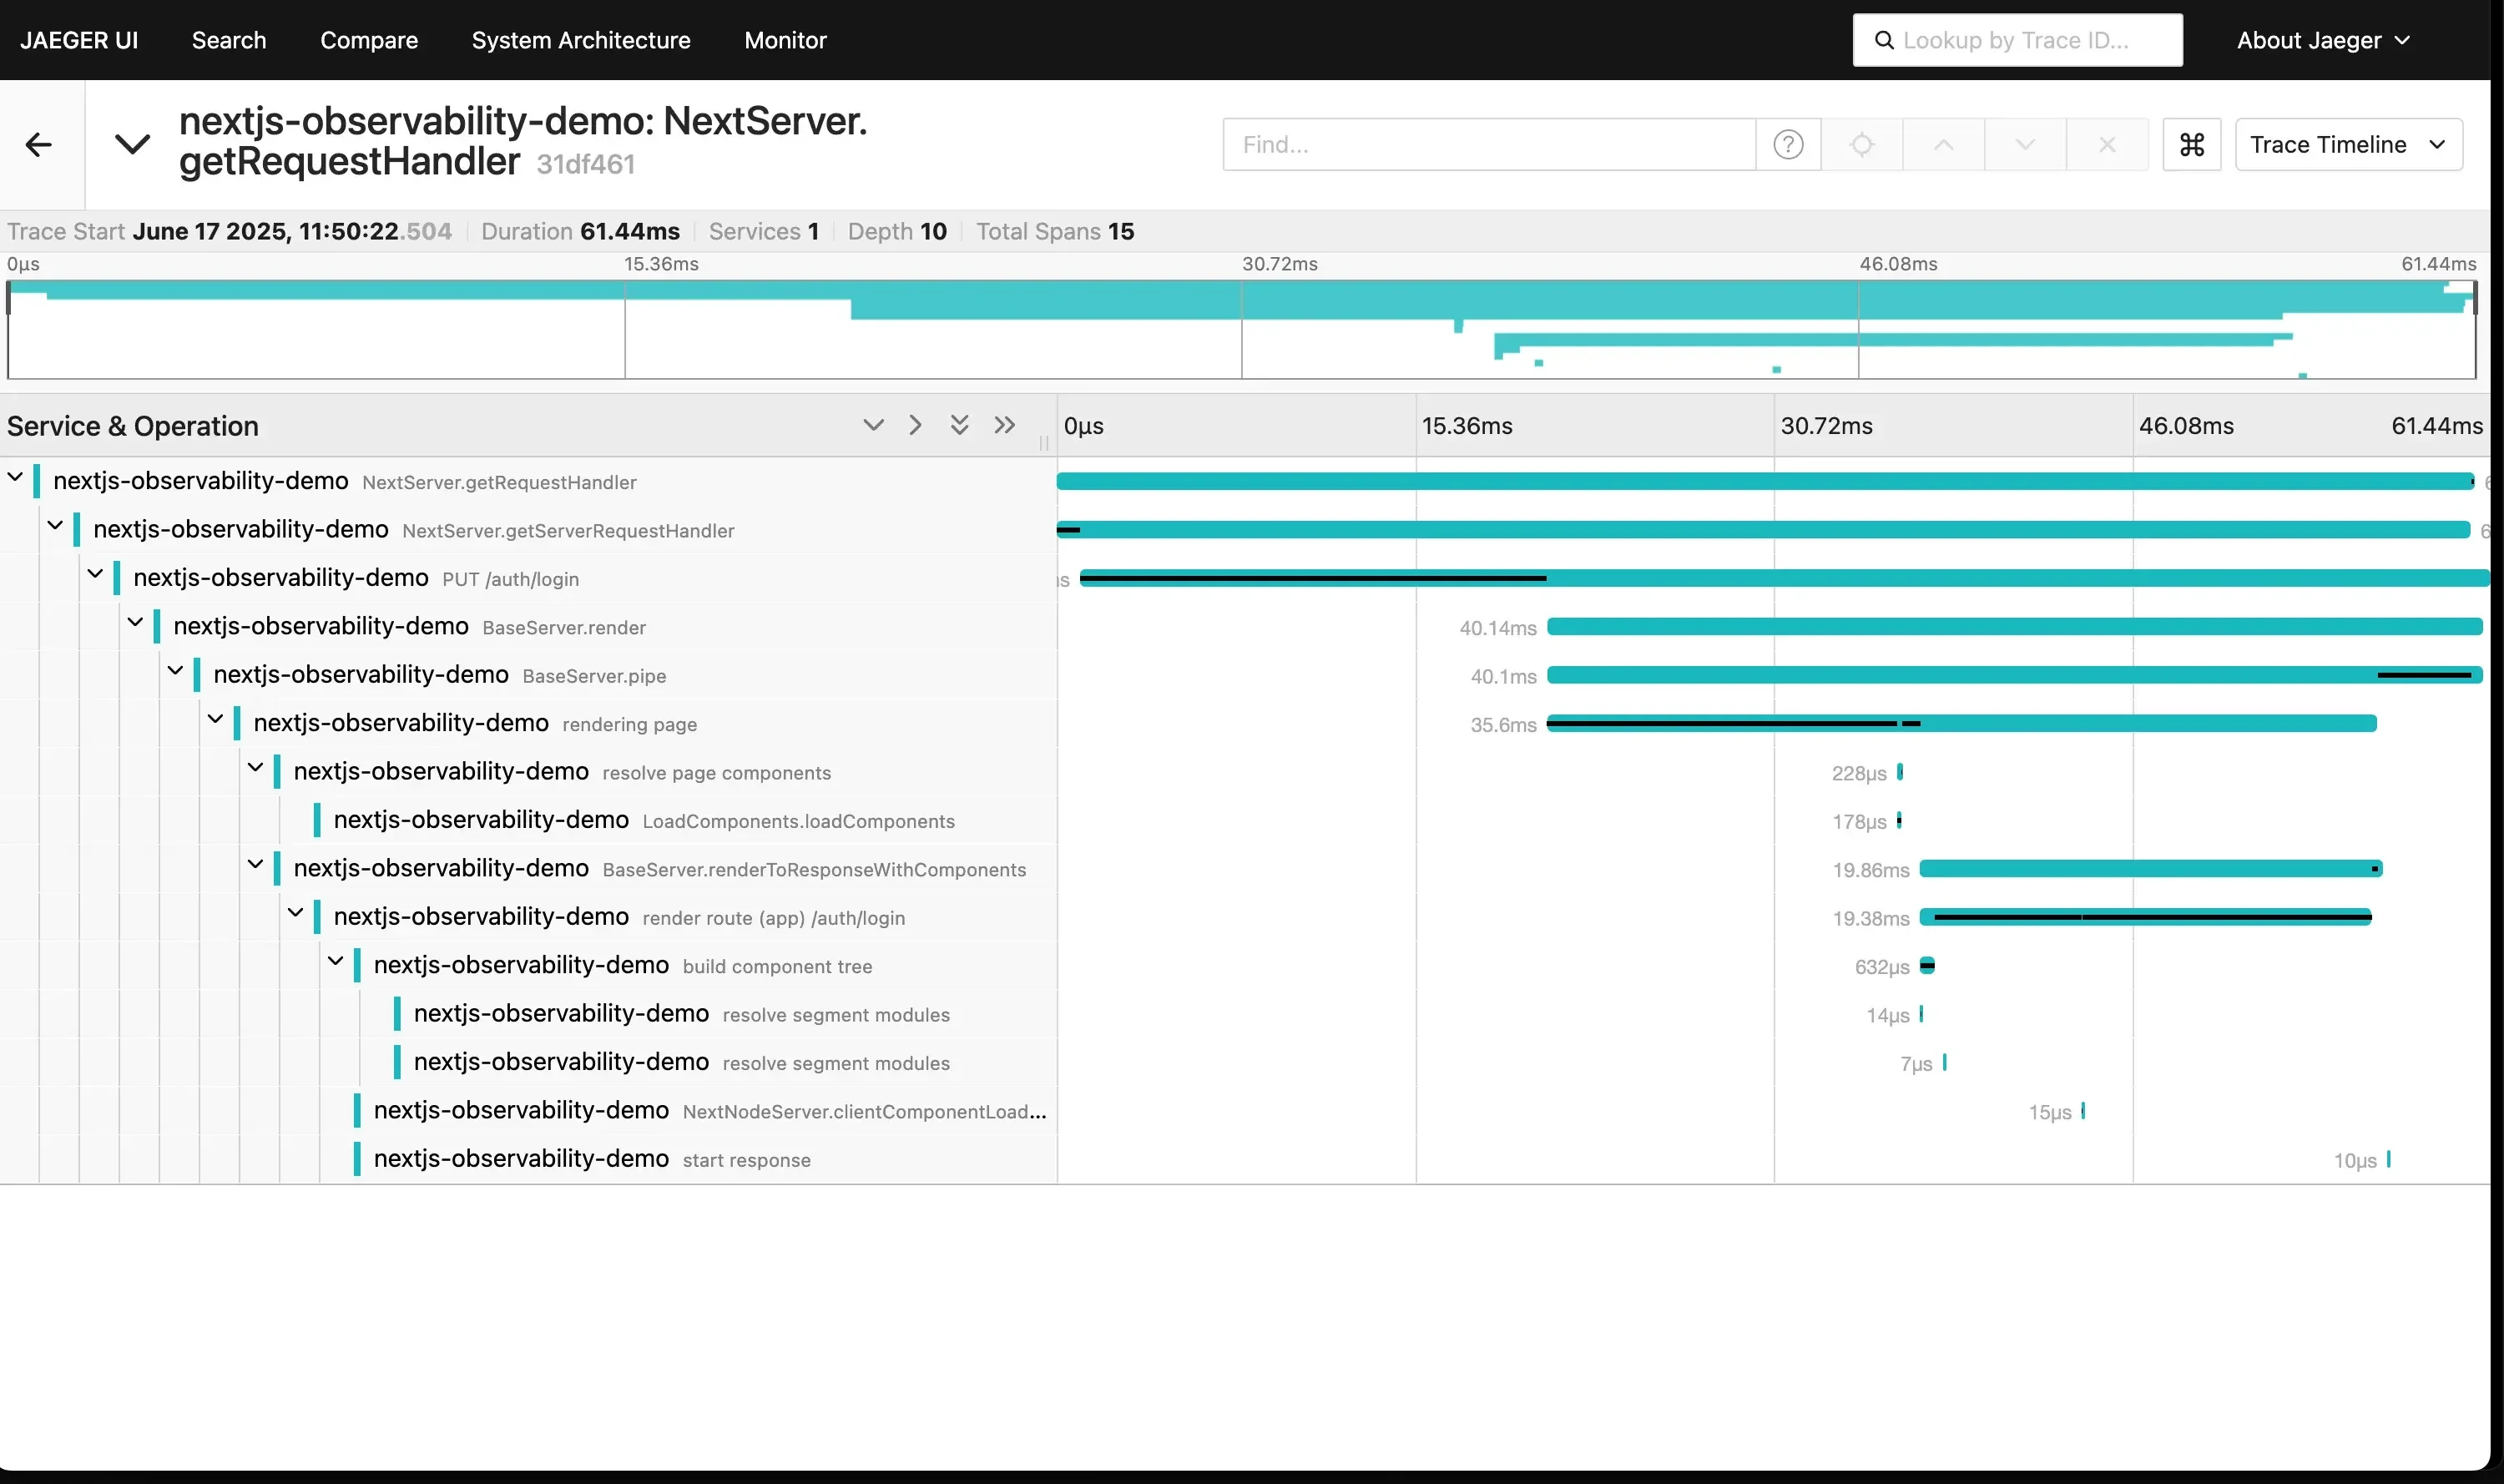
Jaeger dashboard showing a trace in a nextJS app
Best for: Distributed tracing and root-cause analysis.
Key Features: A UI for visualizing trace flame graphs, finding bottlenecks, and generating service dependency maps based on trace data.
Pricing: Free and open-source.
Limitations: Jaeger only handles traces. Like Prometheus, it's one pillar, not the whole house. You still need separate solutions for metrics and logs, and you must manage the scalable backend (e.g., Cassandra or Elasticsearch) to store the trace data.
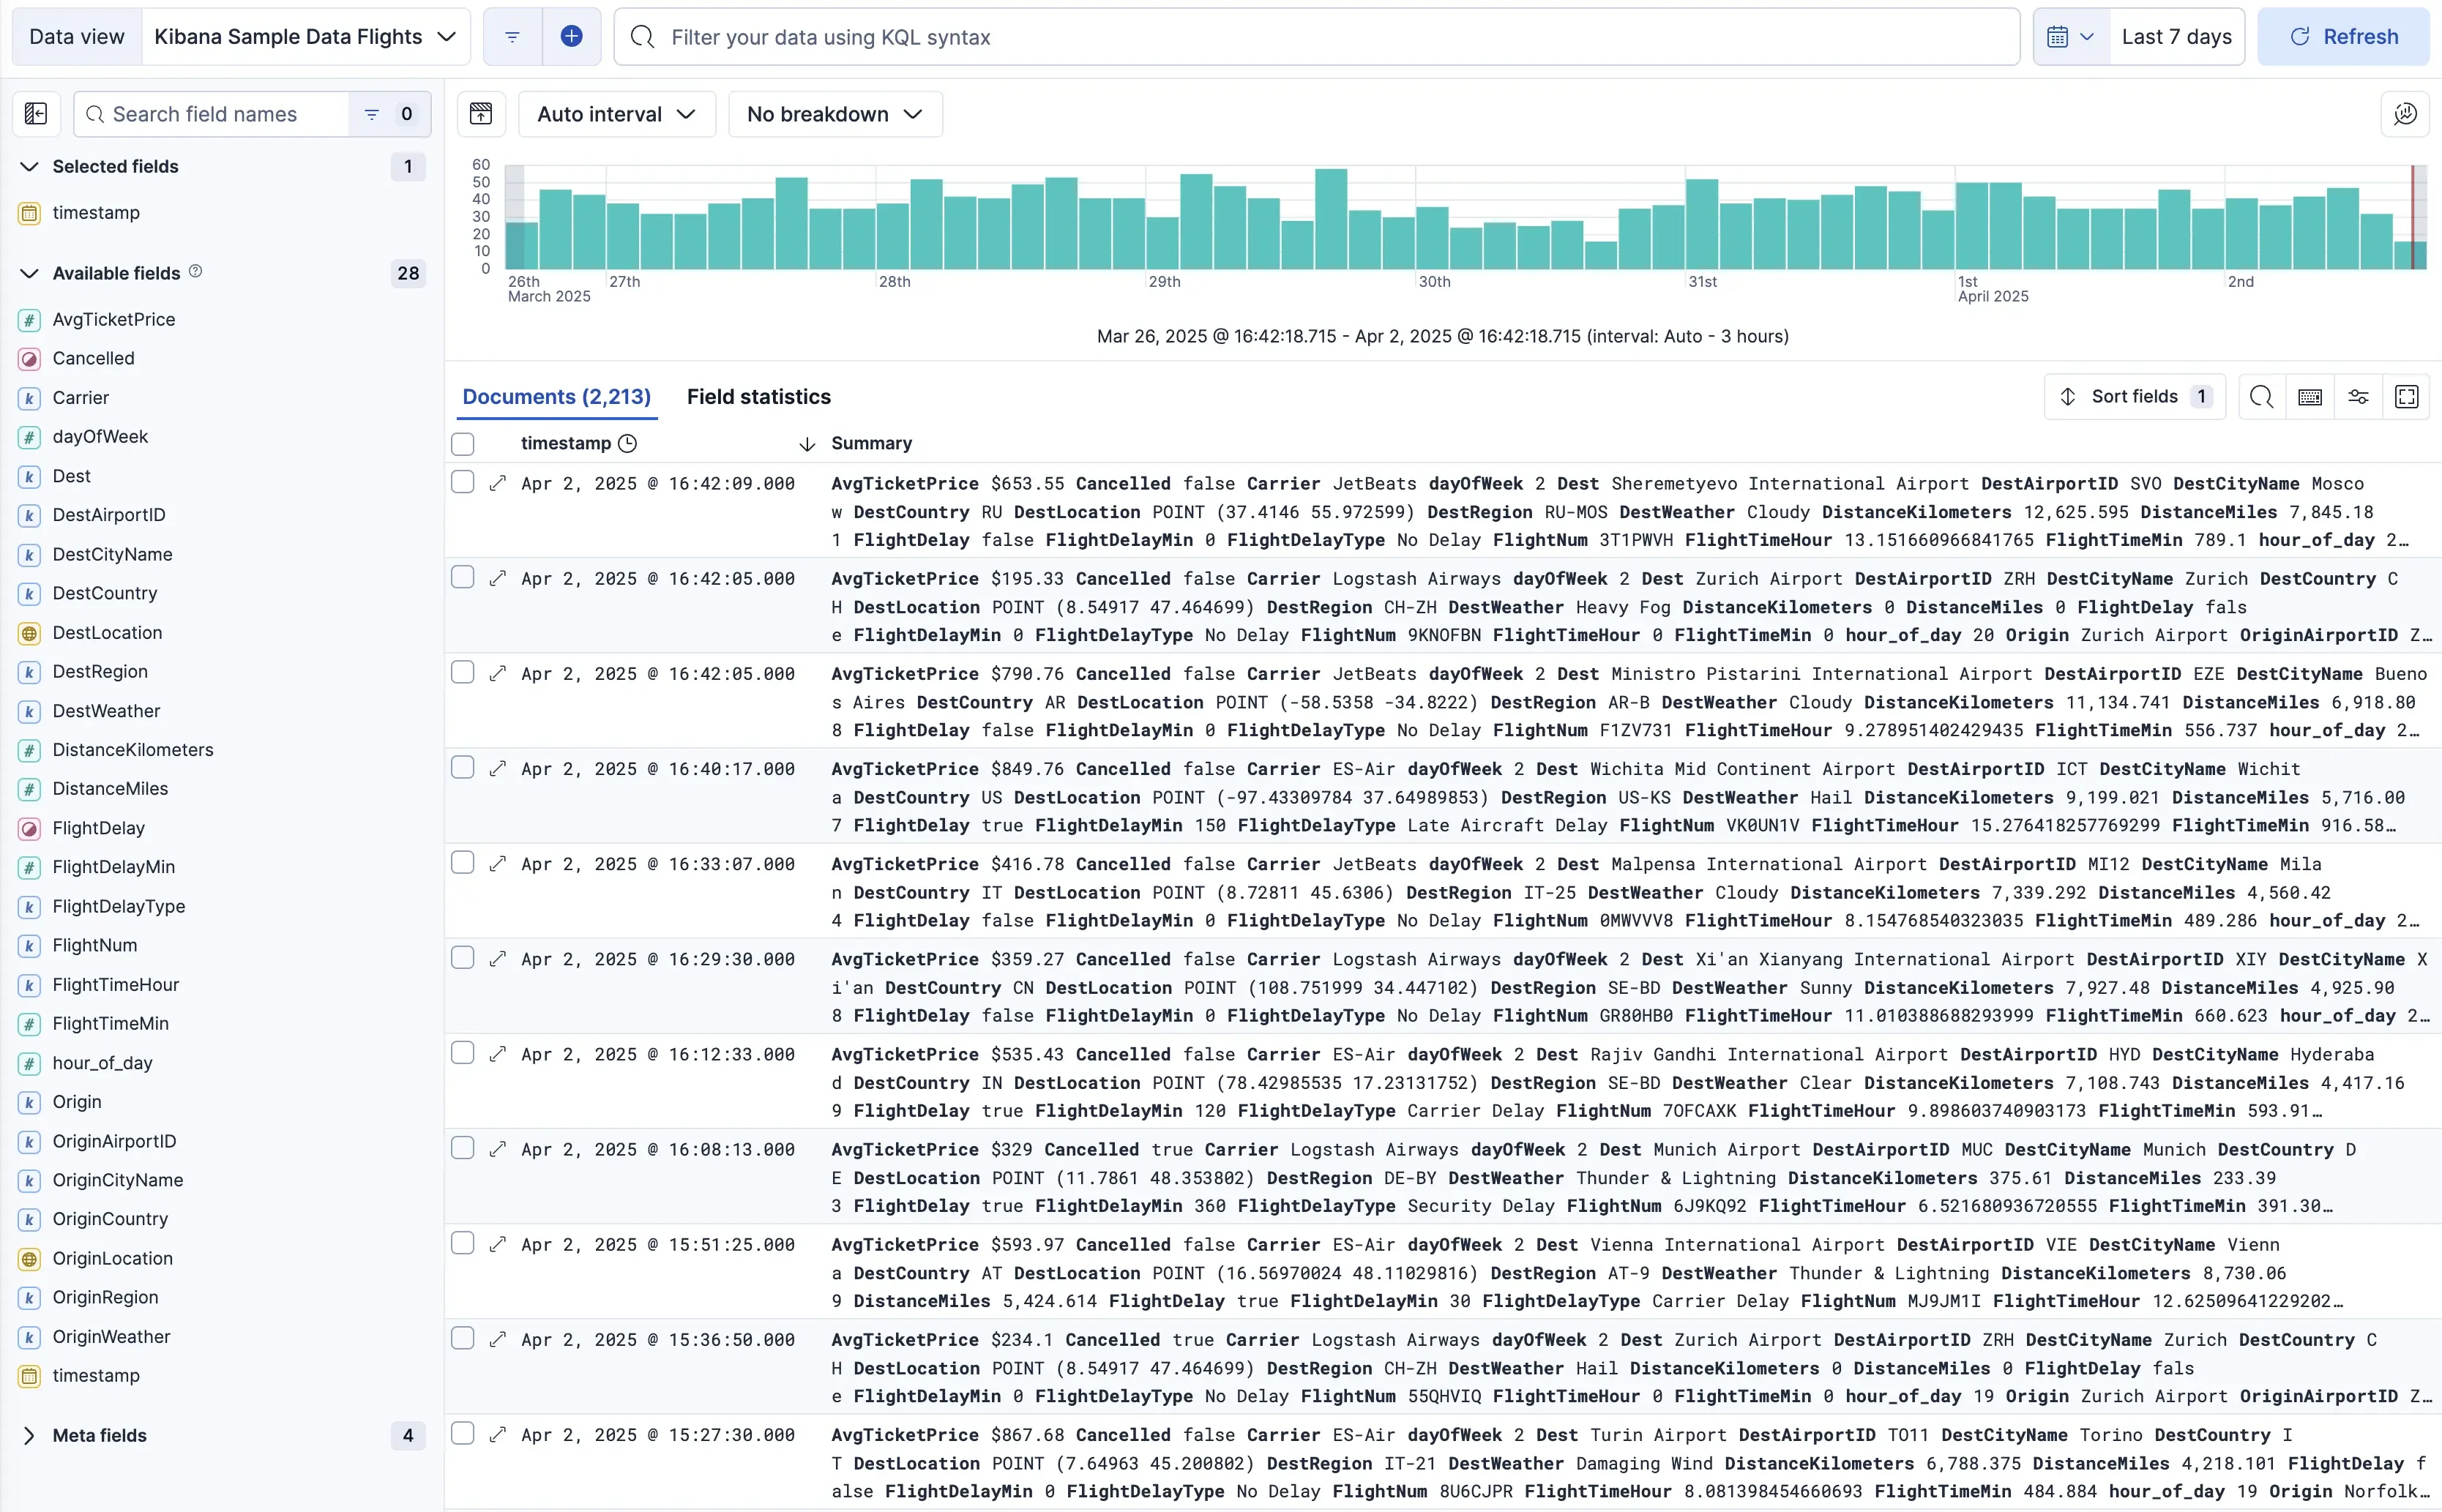
3. Elastic Stack (ELK) / OpenSearch
The classic stack for log aggregation, consisting of Elasticsearch (search/storage), Logstash (ingestion), and Kibana (visualization). OpenSearch is a popular open-source fork.
Best for: Deep log search and analysis.
Key Features: Extremely powerful full-text search, rich log analytics, and visualization capabilities in Kibana. The stack has expanded with "Beats" for data shipping and an APM module for traces.
Pricing: Free and open-source. Elastic offers a commercial "Elastic Observability" product.
Limitations: Running an ELK stack at scale is notoriously resource-intensive (both compute and memory). While it has added APM, its roots are in logging, and correlating logs with traces and metrics can be less seamless than in other platforms.
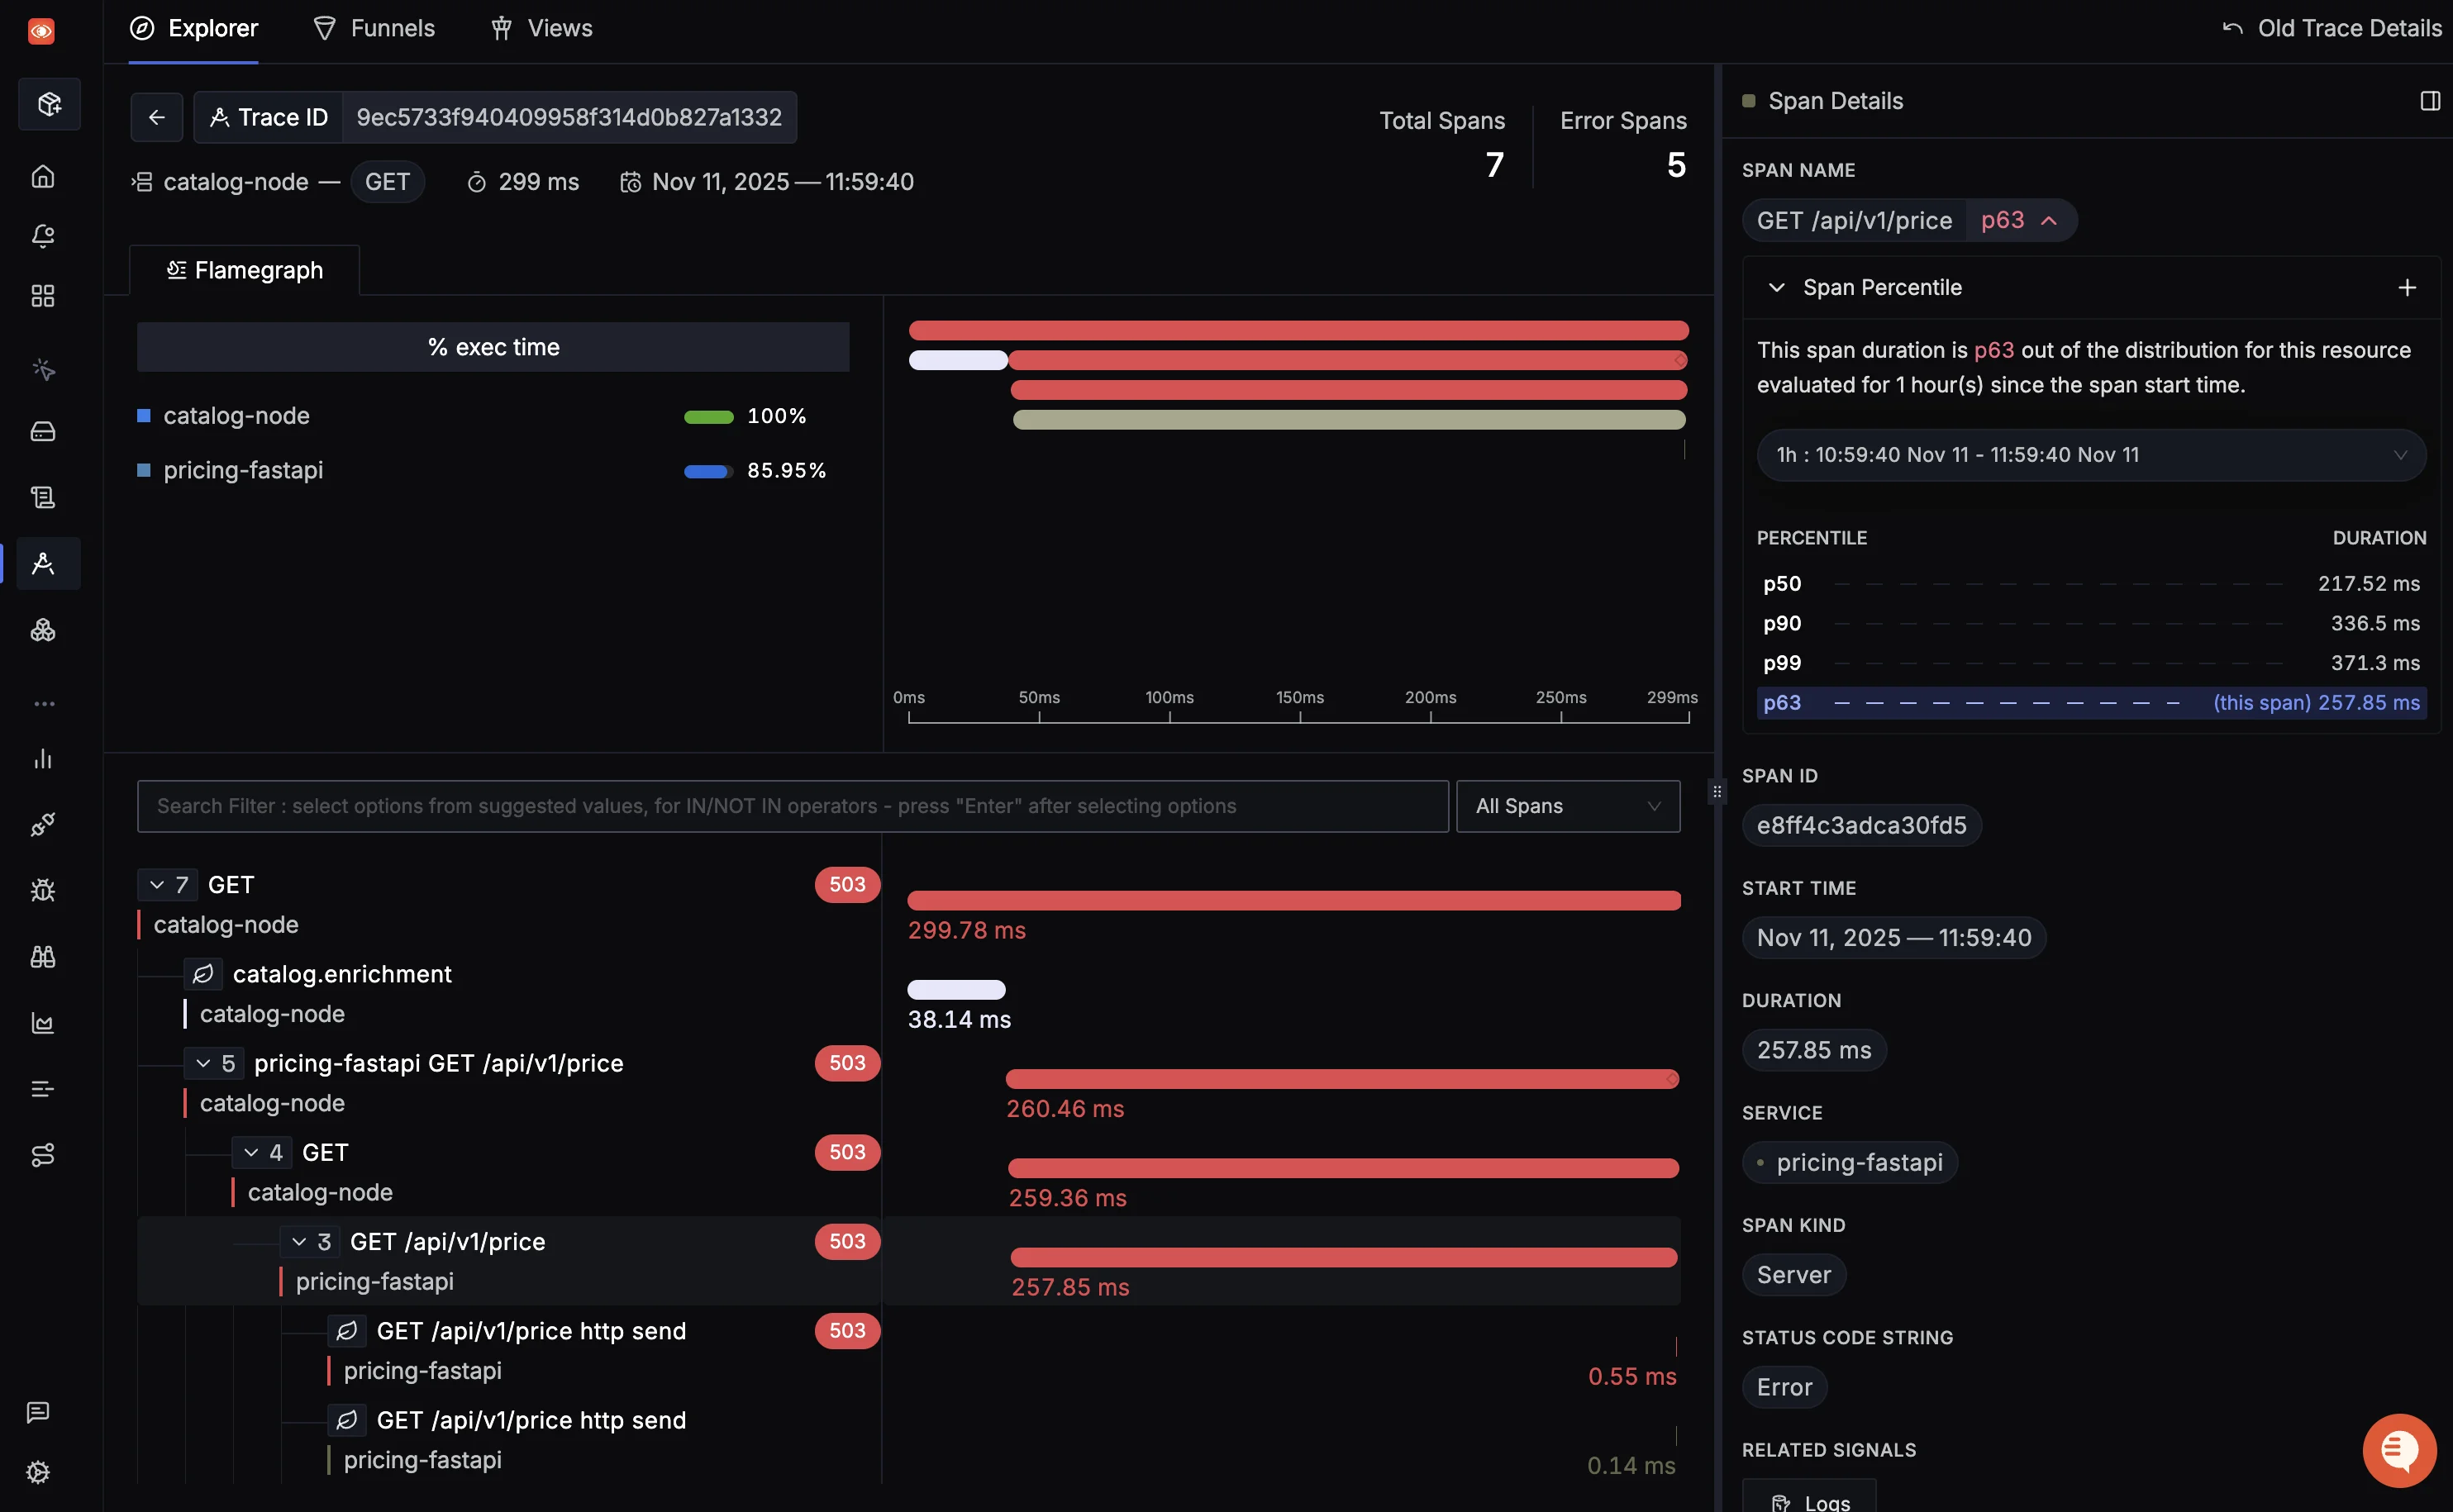
4. SigNoz
An open-source, OpenTelemetry-native platform that unifies metrics, traces, and logs in a single application.
Best for: Teams who want a unified, OTel-native, open-source alternative to tools like Datadog, with flexible self-hosting or a cost-effective cloud option. Mailmodo, for example, uses SigNoz to manage over 200GB of daily logs from 200+ microservices, saving significant developer time.
Key Features:
- Unified UI: A single interface for metrics, logs, and traces, allowing you to correlate data (e.g., click from a chart to the related traces and logs).
- OTel-Native: Built from the ground up to use OpenTelemetry, with no vendor lock-in.
- Columnar Storage: Uses ClickHouse as its storage backend, which is extremely fast and efficient for high-volume telemetry data.
- Service Map: Auto-generates a service map from trace data.
Pricing: Open-source (self-hosted). SigNoz Cloud has a generous free trial, then charges based on GB ingested, which is often more affordable than per-host pricing.
Limitations: It doesn't yet have the full-featured Synthetics or Real User Monitoring (RUM) modules that some mature commercial platforms offer.
Get Started with SigNoz
You can choose between various deployment options in SigNoz. The easiest way to get started with SigNoz is SigNoz cloud. We offer a 30-day free trial account with access to all features.
Those who have data privacy concerns and can't send their data outside their infrastructure can sign up for either enterprise self-hosted or BYOC offering.
Those who have the expertise to manage SigNoz themselves or just want to start with a free self-hosted option can use our community edition.
Top Commercial & SaaS Platforms
Commercial platforms offer an all-in-one, managed experience. You get a polished UI, AI-powered features, and professional support, in exchange for a subscription fee.
1. Datadog
A dominant, all-in-one SaaS observability platform that covers infrastructure, APM, logs, security, and more.
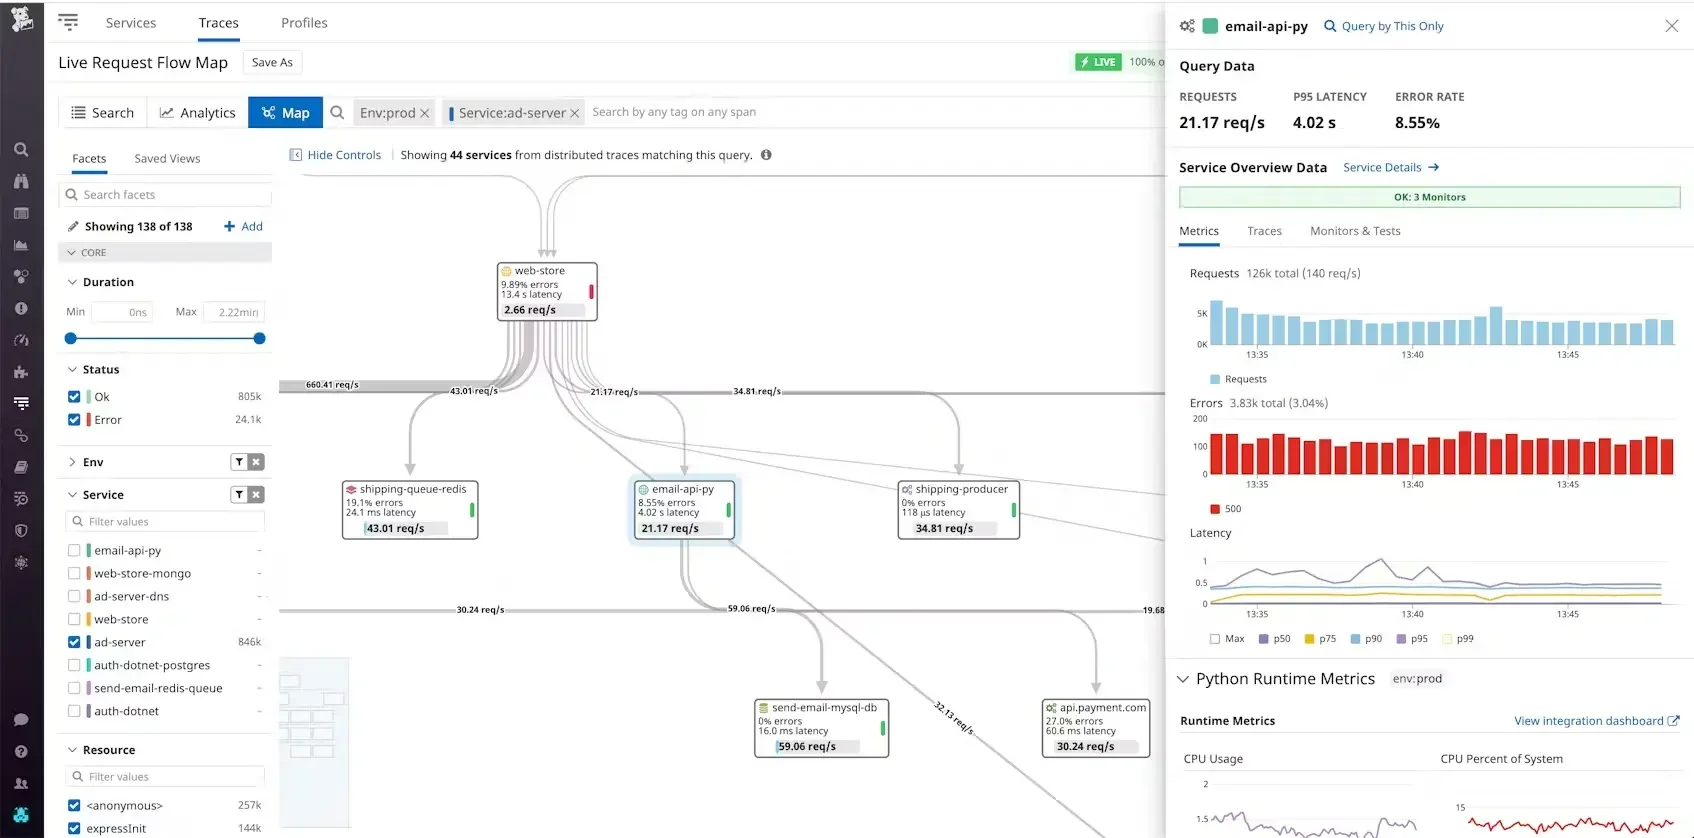
Datadog dashboard (credits: datadog)
Best for: Teams who want a powerful, turnkey solution that "just works" and integrates with hundreds of technologies.
Key Features: A seamless, unified UI. Powerful APM and distributed tracing. AI-powered "Watchdog" for anomaly detection. Extensive service mapping and over 1000+ integrations.
Pricing: Per-host, per-GB ingested (logs), and per-million trace spans. Pricing is its most common complaint, as costs can scale rapidly.
Limitations: Cost. The per-host pricing model can become very expensive in a dynamic microservices environment where you scale pods up and down.
2. New Relic
A veteran APM provider that has evolved into a full-stack observability platform.
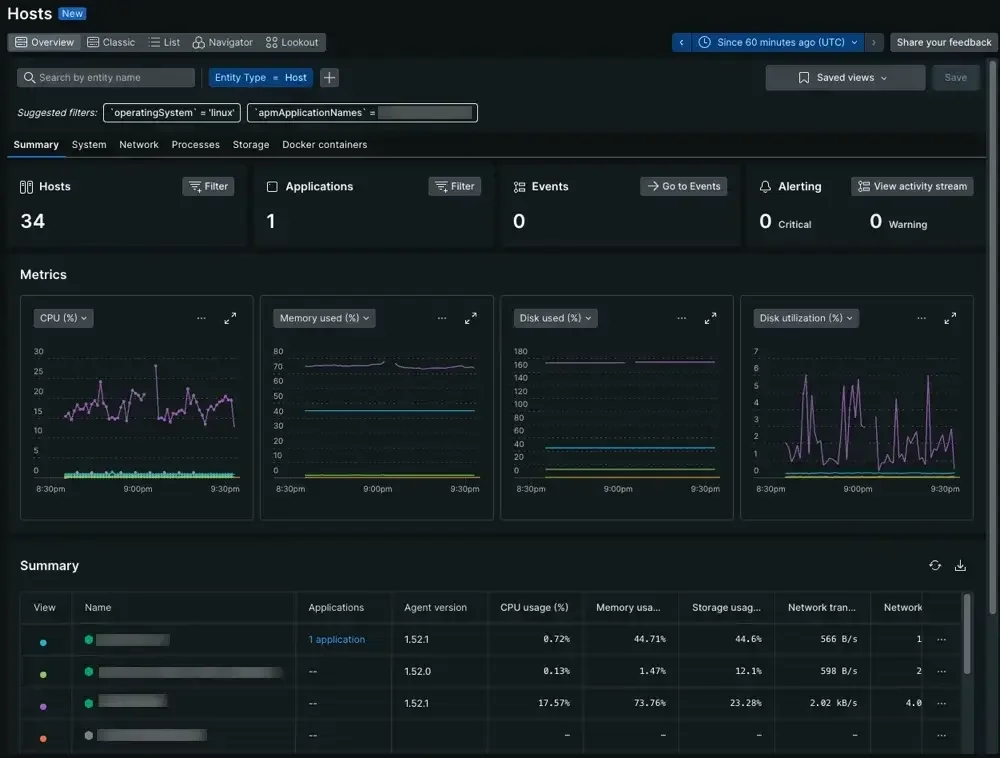
New Relic dashboard (credits: New Relic)
Best for: Teams with a developer-centric focus who need deep, code-level performance diagnostics.
Key Features: Very strong APM with deep code-level visibility and database monitoring. Good distributed tracing and a unified UI for all telemetry.
Pricing: Per-user and per-GB ingested. This simplified pricing model is often more predictable than per-host models.
Limitations: While powerful, some users find the UI and query language (NRQL) to have a steeper learning curve compared to other platforms.
3. Dynatrace
An enterprise-grade observability platform focused on automation and AI-powered answers.
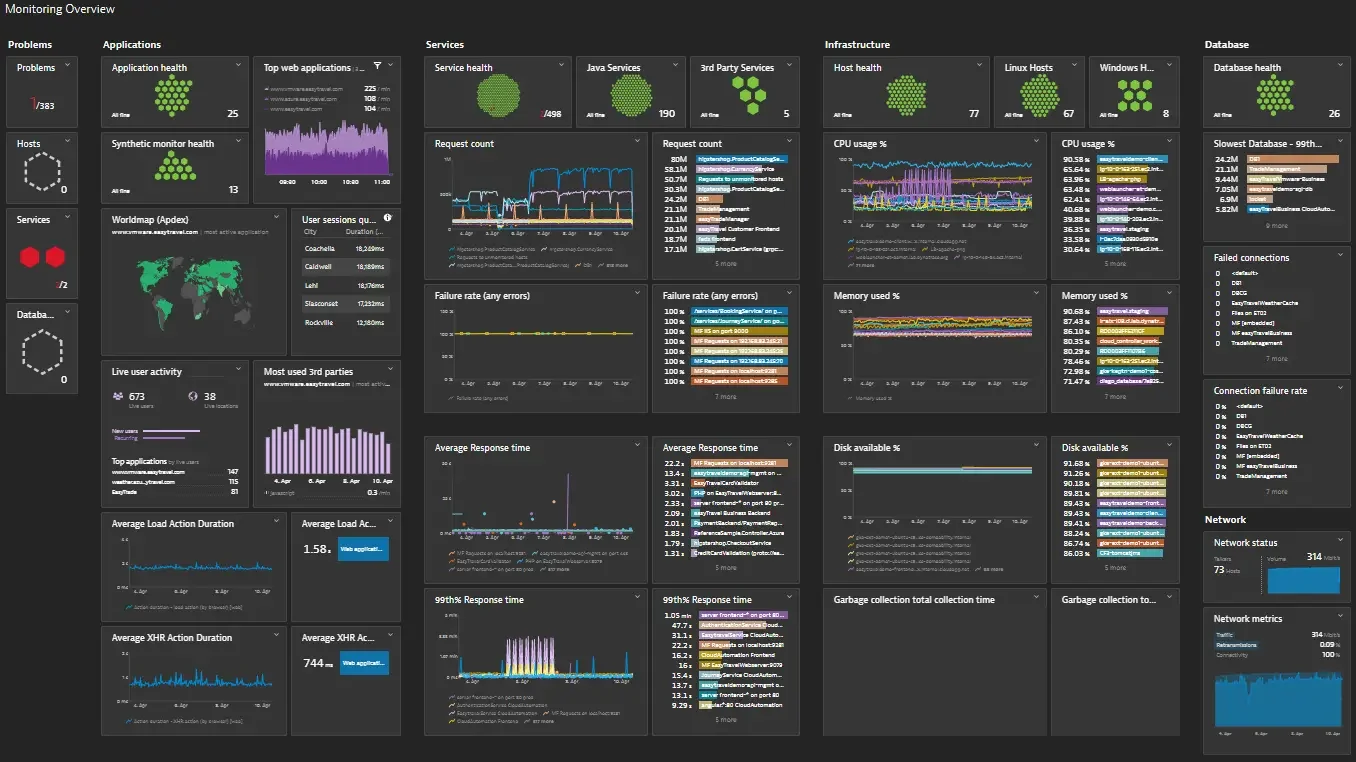
Dynatrace dashboard (credits: Dynatrace)
Best for: Large enterprises that need automatic discovery and AI-driven root-cause analysis with minimal configuration.
Key Features:
- OneAgent: A single agent that automatically discovers all processes, services, and dependencies.
- Davis AI: An AI engine that automatically detects anomalies and provides root causes, reducing alert noise.
- SmartScape: A real-time, dynamic service map.
Pricing: A complex, host-unit and data-based model. It is generally considered one of the more expensive enterprise solutions.
Limitations: It's a high-end, "heavy" solution. This automation comes at a high cost and may be overkill for smaller teams or startups.
4. Splunk Observability
The observability suite from Splunk, a leader in log analytics. It combines infrastructure monitoring, APM, and logging.
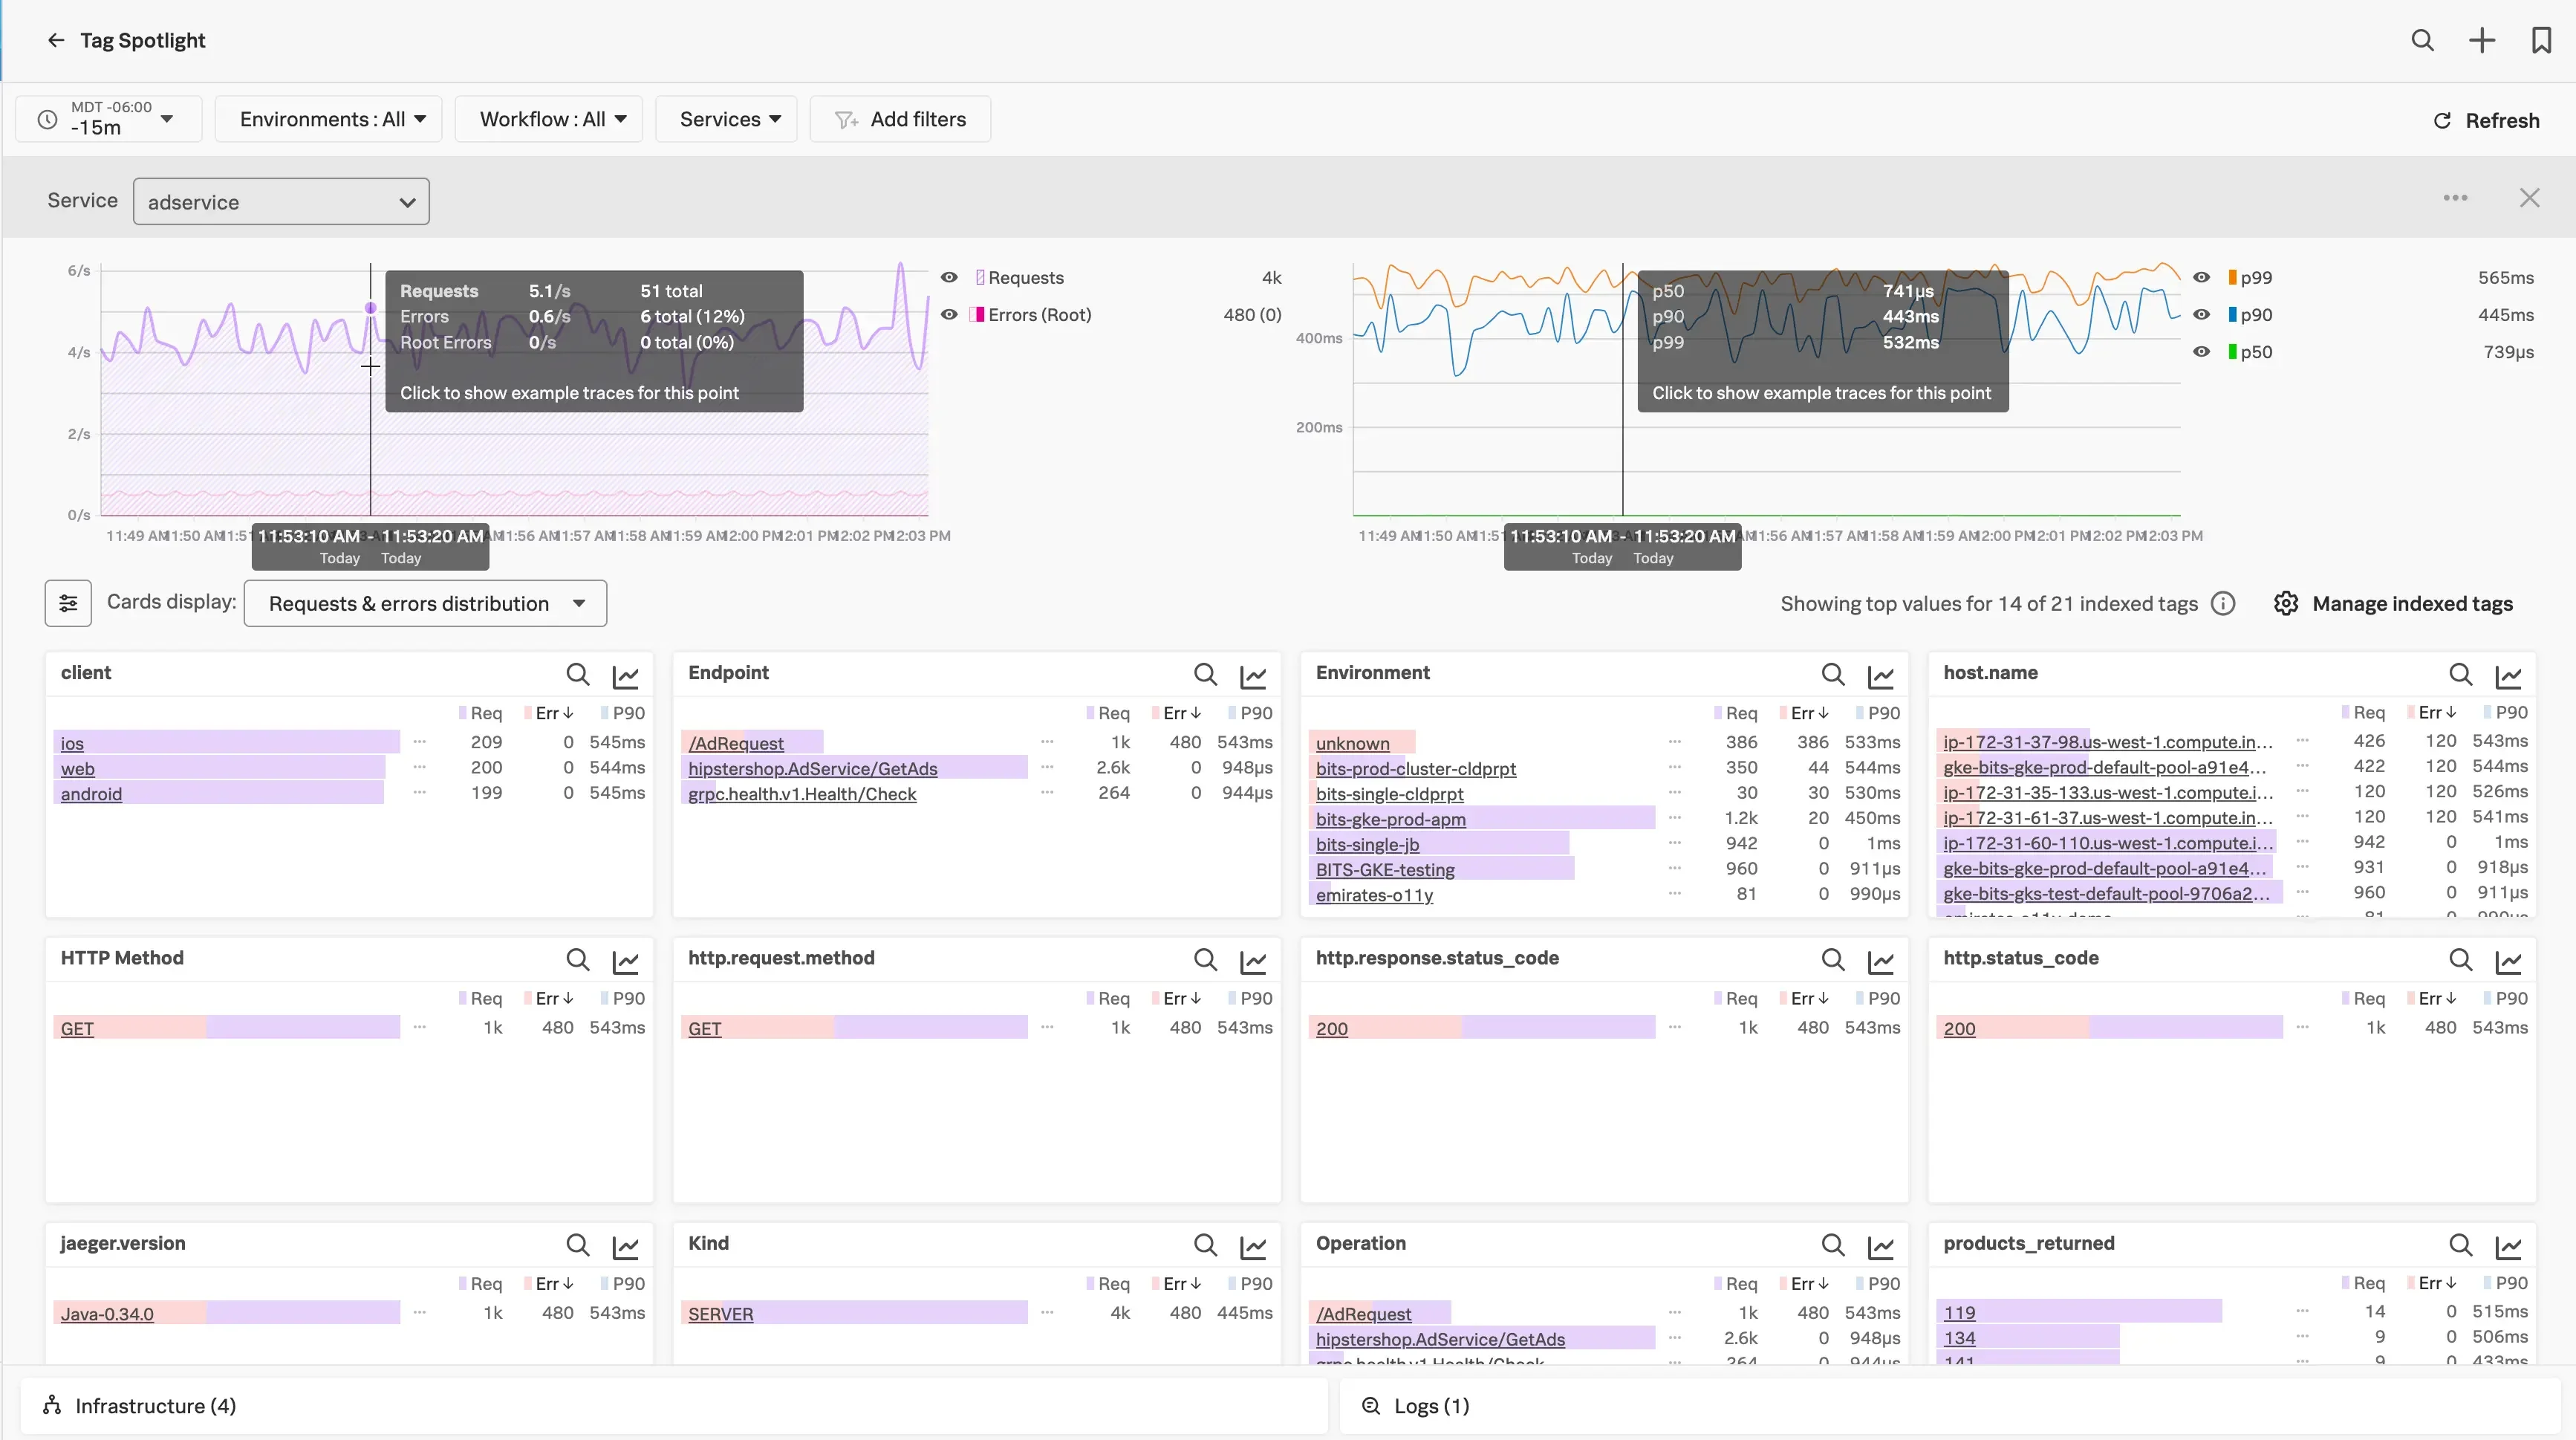
Splunk Observability Cloud dashboard (credits: Splunk)
Best for: Large enterprises, especially those already using Splunk for logs or security.
Key Features: "NoSample" full-fidelity tracing (it captures 100% of traces). Powerful log analytics (as expected from Splunk). Real-time streaming analytics.
Pricing: Per-host and per-GB ingested. Can be very expensive at scale.
Limitations: Its primary strength and focus remain in logs. The APM and metrics products are newer (via acquisitions) and are still integrating.
Comparison of Top Monitoring Tools
| Tool | Primary Use | Unified MELT? | OTel-Native? | Best For |
|---|---|---|---|---|
| Prometheus + Grafana | Metrics & Dashboards | No (Metrics only) | Via Exporters | OSS Kubernetes Metrics |
| Jaeger | Distributed Tracing | No (Traces only) | Yes | OSS Tracing |
| SigNoz | Metrics, Logs, Traces | Yes | Yes | Unified OSS & OTel |
| Datadog | Metrics, Logs, Traces | Yes | Yes (supported) | All-in-One SaaS |
| New Relic | APM, Logs, Traces | Yes | Yes (supported) | Deep Code-Level APM |
| Dynatrace | APM, Logs, Traces | Yes | Yes (supported) | AI-Powered Enterprise |
Kubernetes Monitoring Architecture
How you deploy these tools in Kubernetes generally follows two paths:
- The Open-Source Stack: You deploy the OpenTelemetry Collector as a DaemonSet or Deployment. Your microservices send OTel data to the Collector, which then routes metrics to Prometheus (often scaled with Thanos), logs to Loki or OpenSearch, and traces to Jaeger. Grafana sits on top for visualization.
- The SaaS Platform Stack: You deploy the vendor's lightweight agent (e.g., Datadog Agent, OneAgent) as a DaemonSet. This single agent automatically discovers all pods, scrapes metrics, collects logs, and forwards everything to the vendor's cloud platform.
The OTel-native approach (used by SigNoz) is a hybrid: you deploy the OTel Collector, which forwards all data to a single, unified backend.
A Note on Cost Control
Be wary of pricing. A microservices architecture can create a cost explosion.
- Per-host pricing (Datadog, Dynatrace) is challenging. If you scale from 10 to 100 nodes/containers to handle a traffic spike, your monitoring bill can 10x with them.
- Per-GB pricing (SigNoz, Splunk) is often more aligned with microservices. You pay for what you log. This incentivizes you to be smart about what you log (e.g., sample debug logs) but doesn't penalize you for scaling out your compute.
Conclusion
Choosing a microservices monitoring tool is a trade-off between control and convenience.
If you are a large enterprise with a big budget and value an all-in-one, AI-powered solution, Datadog or Dynatrace are powerful choices.
If you are an open-source enthusiast with a strong engineering team, you can build a best-in-class stack by combining Prometheus, Grafana, and Jaeger.
If you want the best of both worlds—a unified, easy-to-use platform that is still open-source and OpenTelemetry-native—SigNoz is an excellent modern choice. It gives you a single tool for metrics, traces, and logs, with a cost-effective pricing model and the flexibility to self-host or use the cloud.
Hope we answered all your questions regarding microservices monitoring tools. If you have more questions, feel free to use the SigNoz AI chatbot, or join our slack community.
You can also subscribe to our newsletter for insights from observability nerds at SigNoz, get open source, OpenTelemetry, and devtool building stories straight to your inbox.
