New Relic vs Prometheus - Detailed Comparison for 2026
New Relic and Prometheus are popularly used tools for monitoring applications and systems. New Relic excels in providing comprehensive application monitoring solutions, while Prometheus specializes in metric collection.
In this post, I have compared New Relic and Prometheus on important features like data collection, visualization capabilities, APM, data storage, etc.

Testing environment
💡 I configured two sample applications: one in Python and the other in PHP, alongside a MySQL database. I sent their data to both New Relic and Prometheus for evaluation. Some takeaways are subjective and based on personal preference.
New Relic vs Prometheus: An Overview
New Relic is a versatile monitoring tool that offers a wide range of features, including Application Performance Monitoring (APM), log monitoring, infrastructure monitoring, and real-user monitoring. In contrast, Prometheus focuses on monitoring time-series data.
Prometheus is open-source and free to use, while New Relic is a paid tool, which can become expensive as usage scales. Prometheus is commonly used in conjunction with Grafana, where Grafana serves as the visualization layer, providing a user interface to visualize Prometheus metrics.
To use New Relic, you simply need to sign up, create an account, and follow the onboarding steps to get started. As Prometheus is open-source, it requires self-installation and management. However, managed services for Prometheus are available from many cloud vendors, including AWS.
Getting Started: New Relic
New Relic
New Relic is cloud-based. All it requires is for you to sign up, and your account is created within seconds.
Prometheus
Prometheus provides several deployment alternatives, such as utilizing Docker, installing from source, using configuration management systems like Ansible, using pre-compiled binaries on multiple operating systems (Darwin, Linux, Windows, etc.), and using Homebrew, the macOS package manager. I utilized Docker to set up Prometheus on my machine.
The deployment processes for both tools are straightforward, but New Relic's process is particularly seamless, requiring only a simple sign-up.
Data Collection: New Relic
New Relic
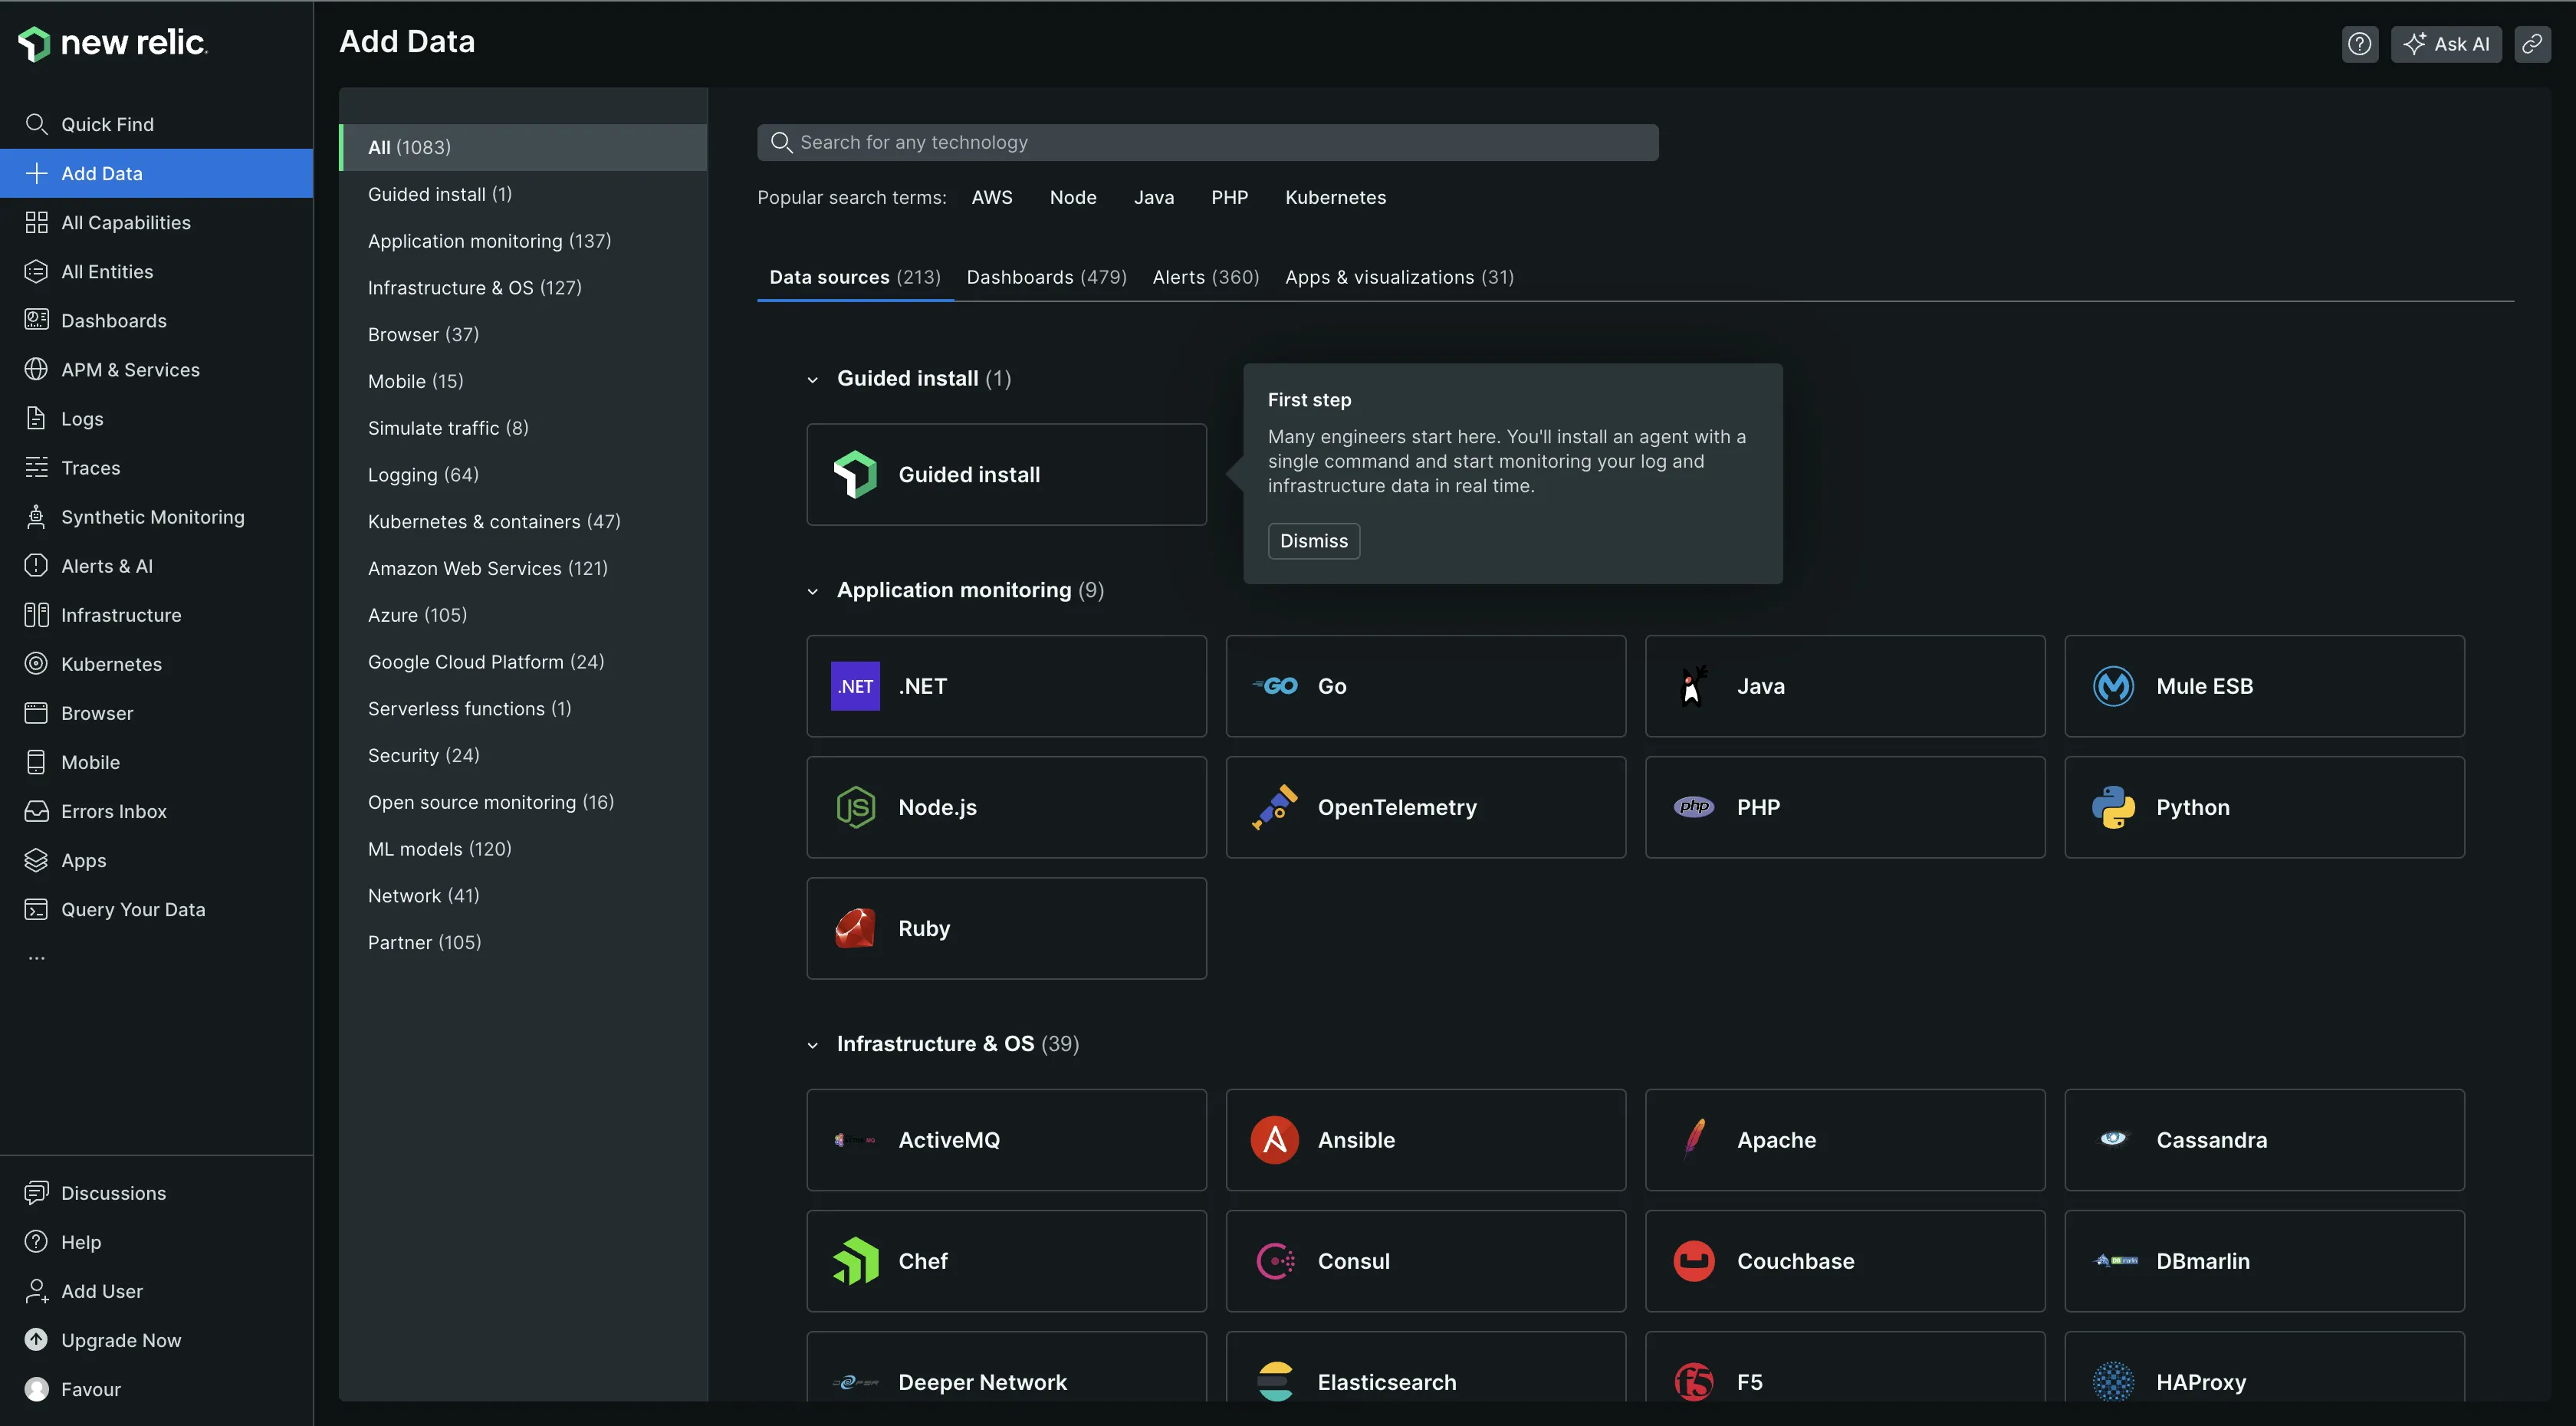
New Relic provides a total of 1083 data sources for data collection without the need for any configuration. Collecting data from my sample Python application was very easy. All I had to do was install the New Relic agent on my system and start the application with the agent.
New Relic also provides the flexibility to collect custom data in cases where New Relic does not automatically support a given data source. This could include custom trace data, custom infrastructure data, and custom attributes and events.
Prometheus
Prometheus also supports data collection from different data sources. It collects data through a pull-based model, where it actively scrapes metrics from configured targets at regular intervals. These targets can be servers, applications, or services that expose metrics in a format that Prometheus can understand, typically over HTTP. It uses a configuration file to define the targets it should scrape, including the URL, the scrape interval, and any specific metrics to collect. From the below image, you can see I was able to scrape metrics from several target endpoints.
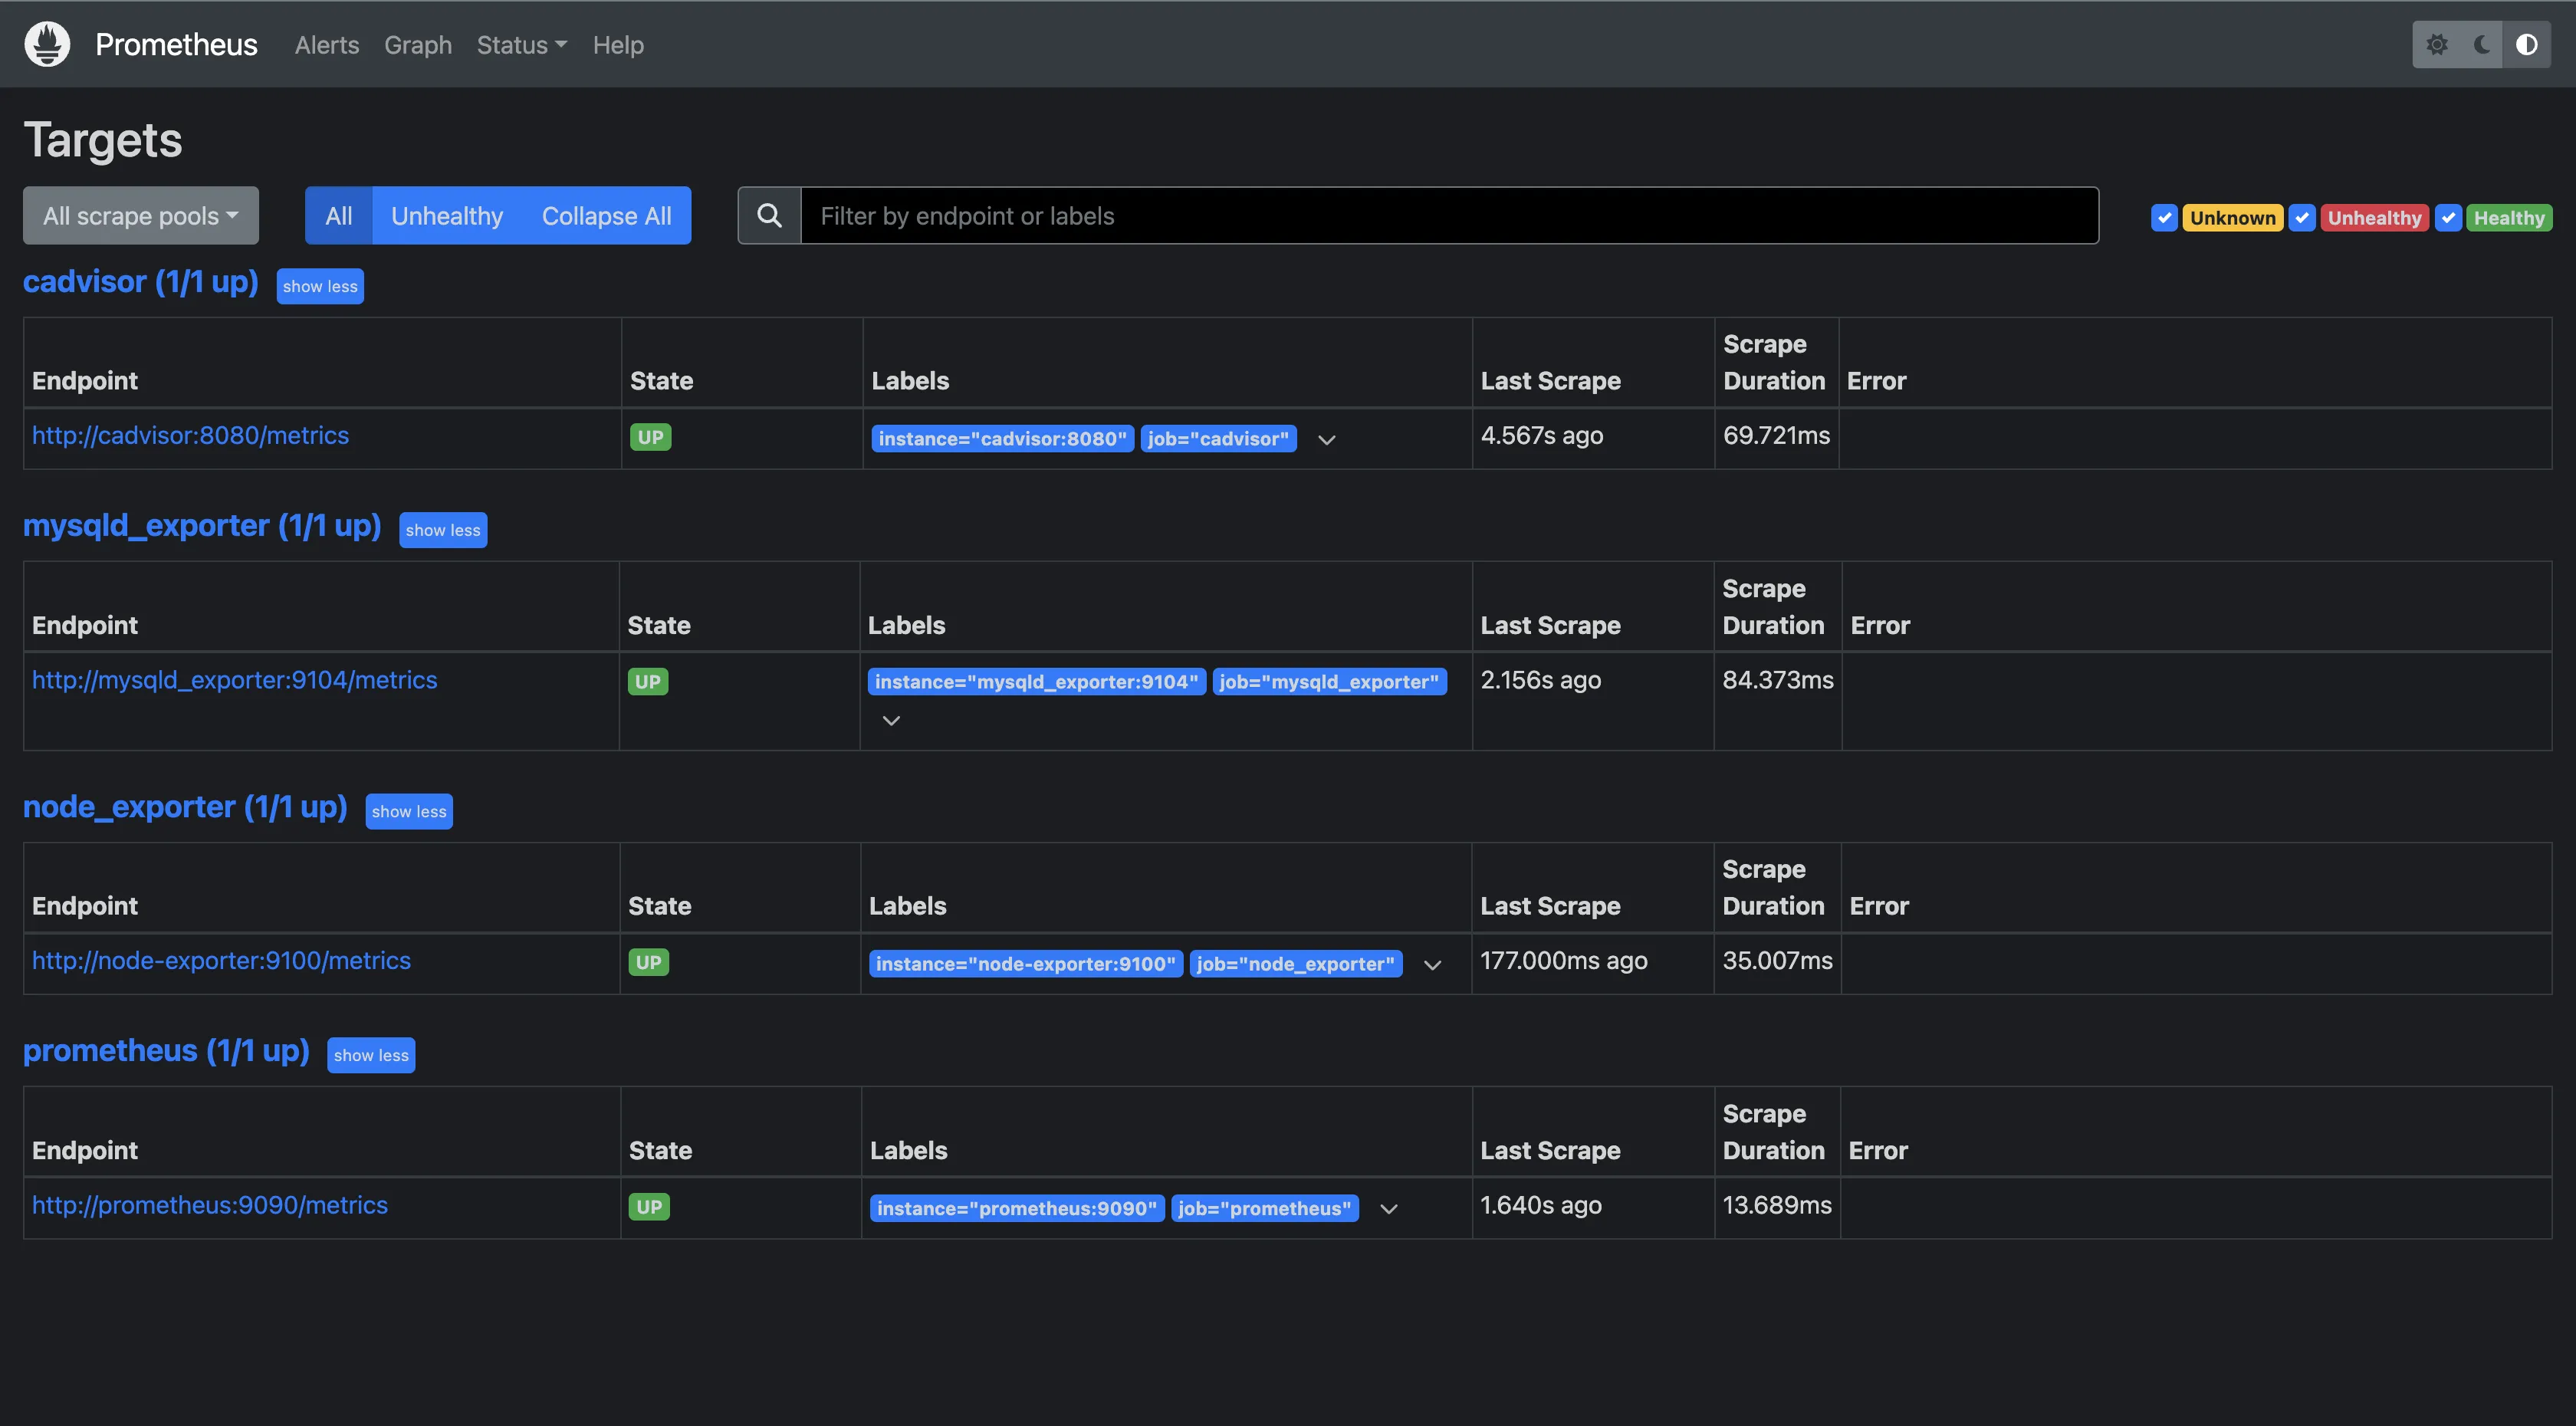
Both tools have impressive data collection capabilities, but New Relic stands out for the broader range of data it can accept.
Migrate from New Relic - Save up to 67% on your New Relic bill
Tired of New Relic's user-based pricing? Even for teams of 10-15 devs, New Relic's pricing for user seats can be a significant portion of your monthly bill.
Visualization Capabilities: New Relic
New Relic
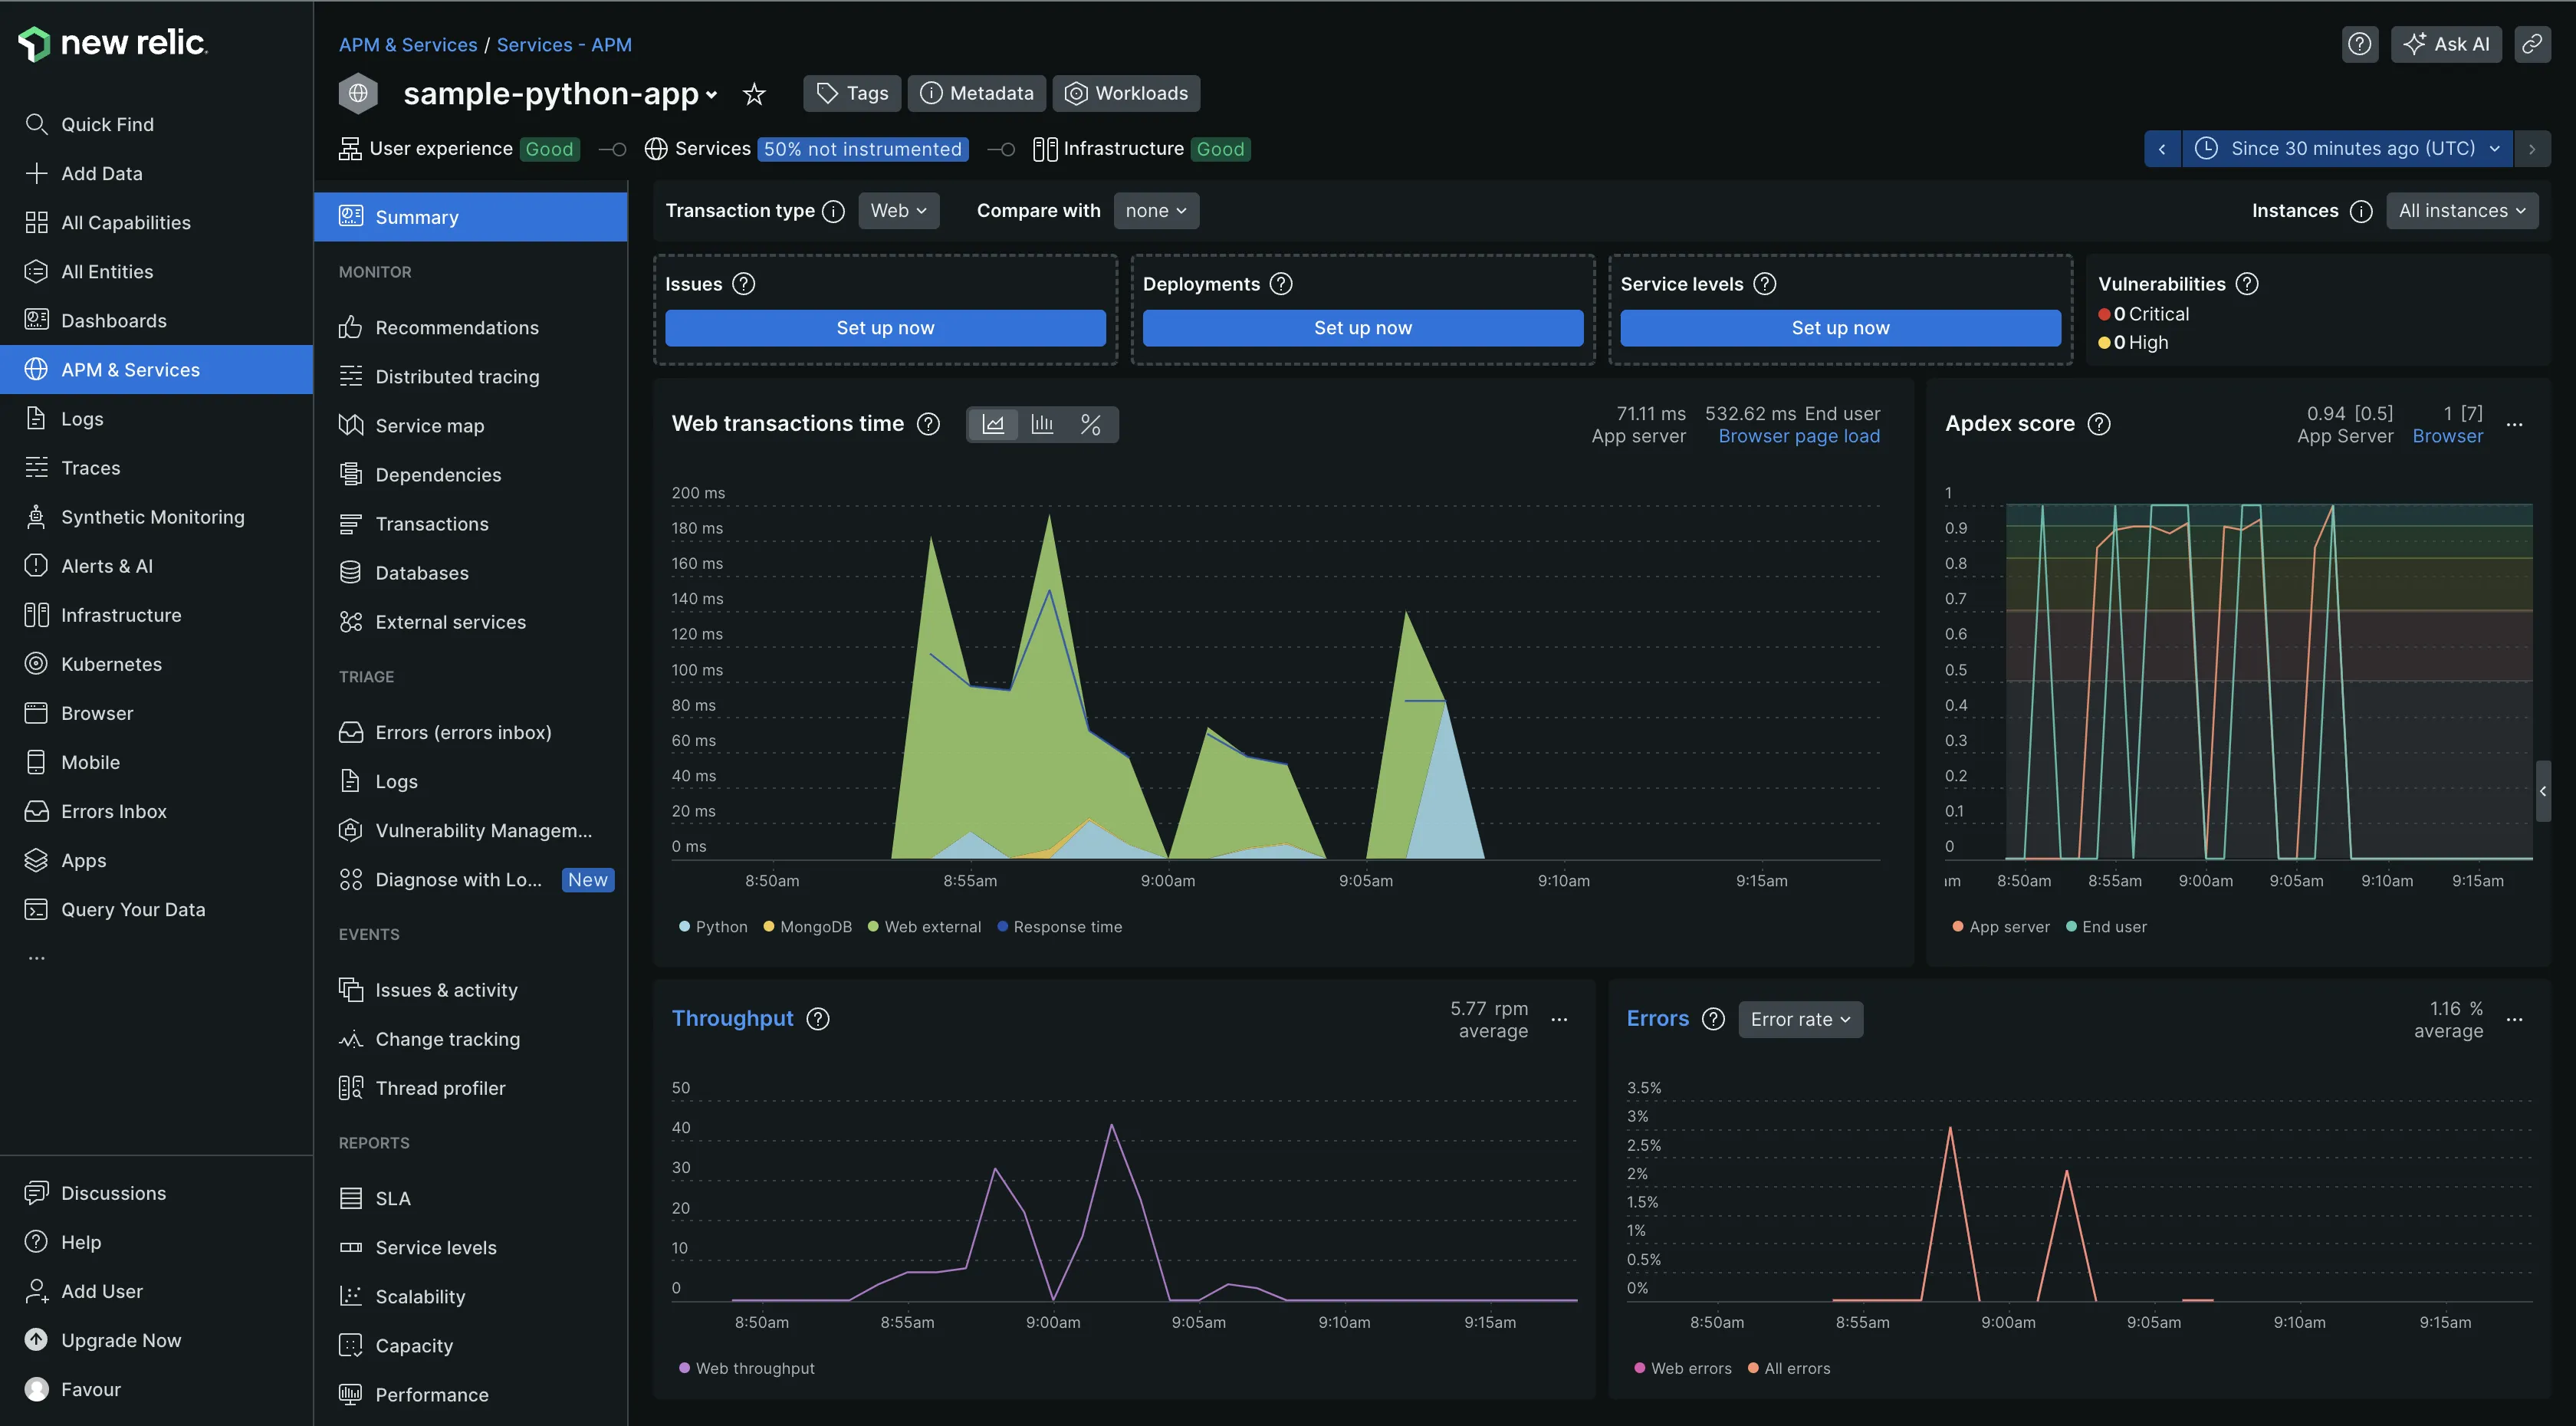
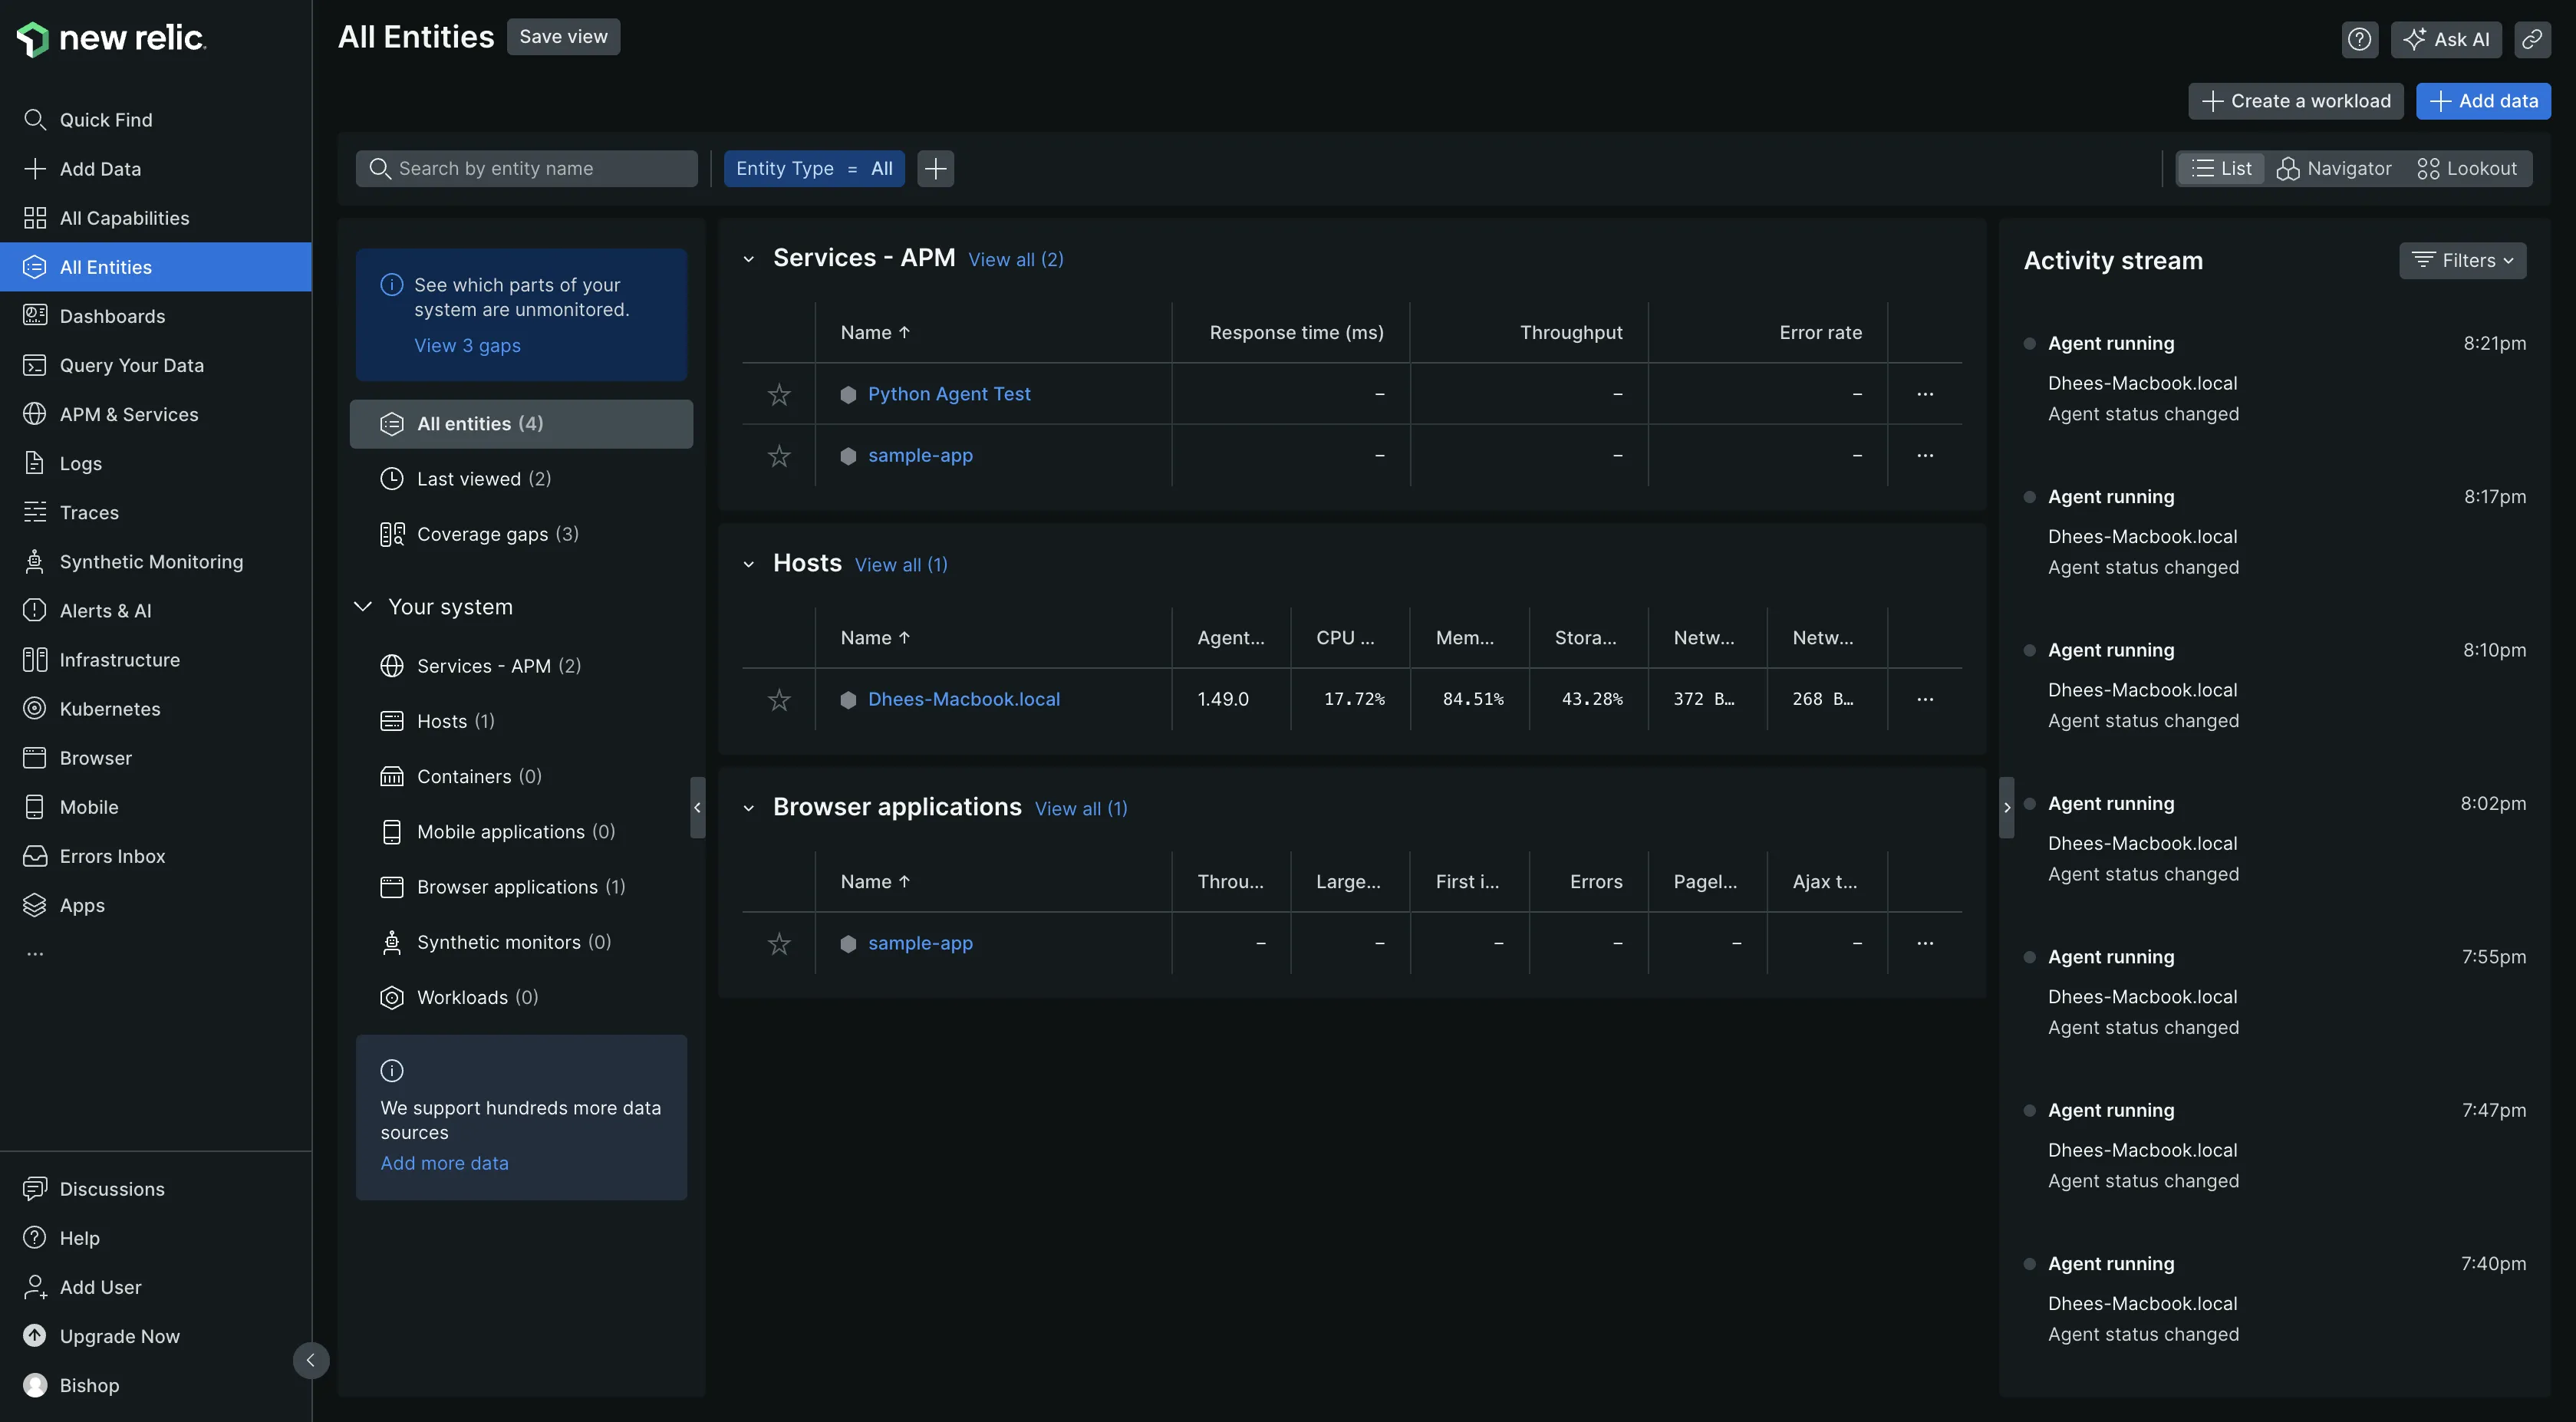
New Relic has impressive visualization capabilities. It provides pre-built dashboards for easy understanding and analysis of data, ensuring that you can quickly identify trends and insights. After the New Relic agent collected and sent my application data to New Relic, I could visualize and monitor my application without needing to create a dashboard.
Users also have the flexibility to create and customize dashboards from scratch or by using custom queries to monitor the exact application metrics needed.
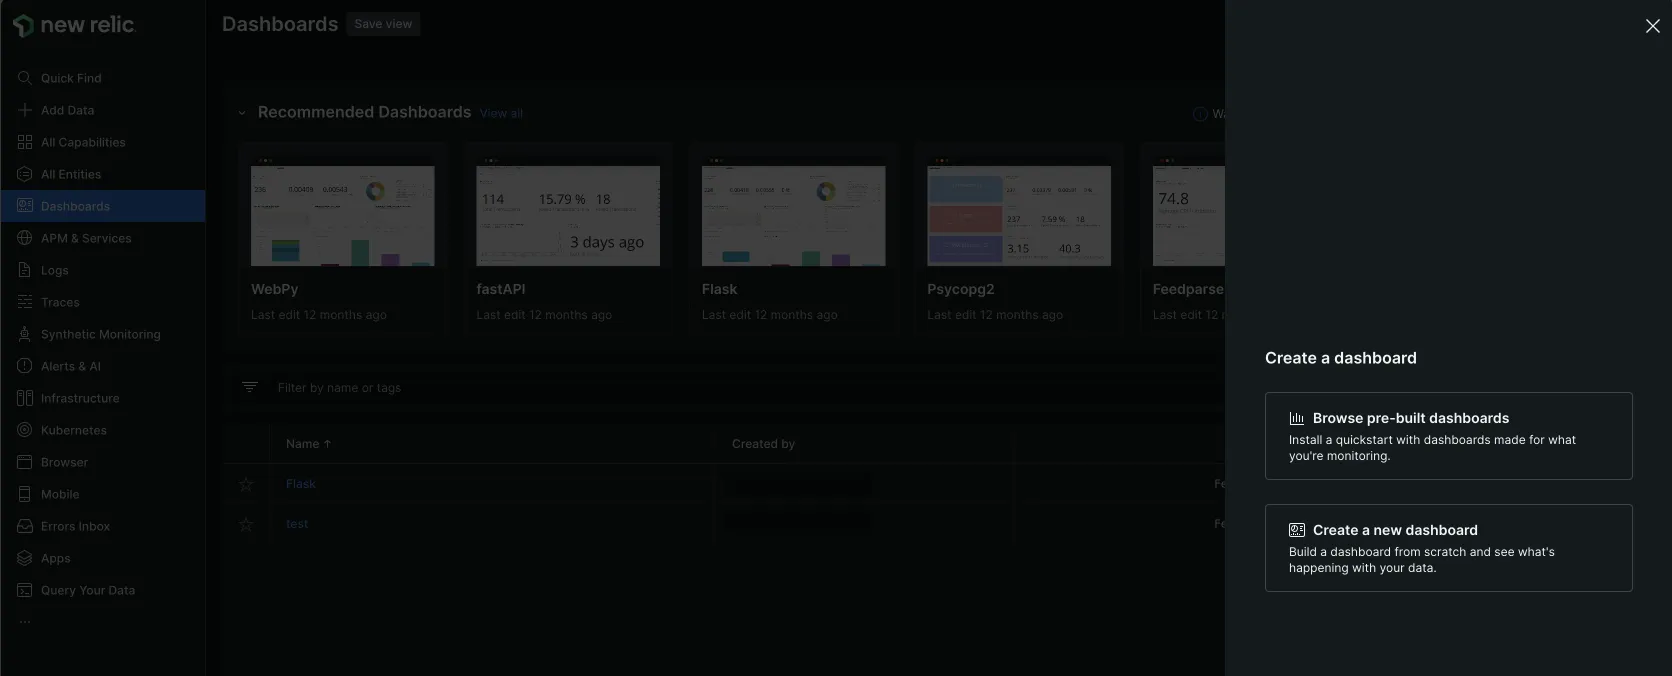
For users who may require more customization options beyond what the standard charts and dashboards can offer, New Relic allows the development of New Relic Apps or the customization of existing apps from the App catalog.
Prometheus
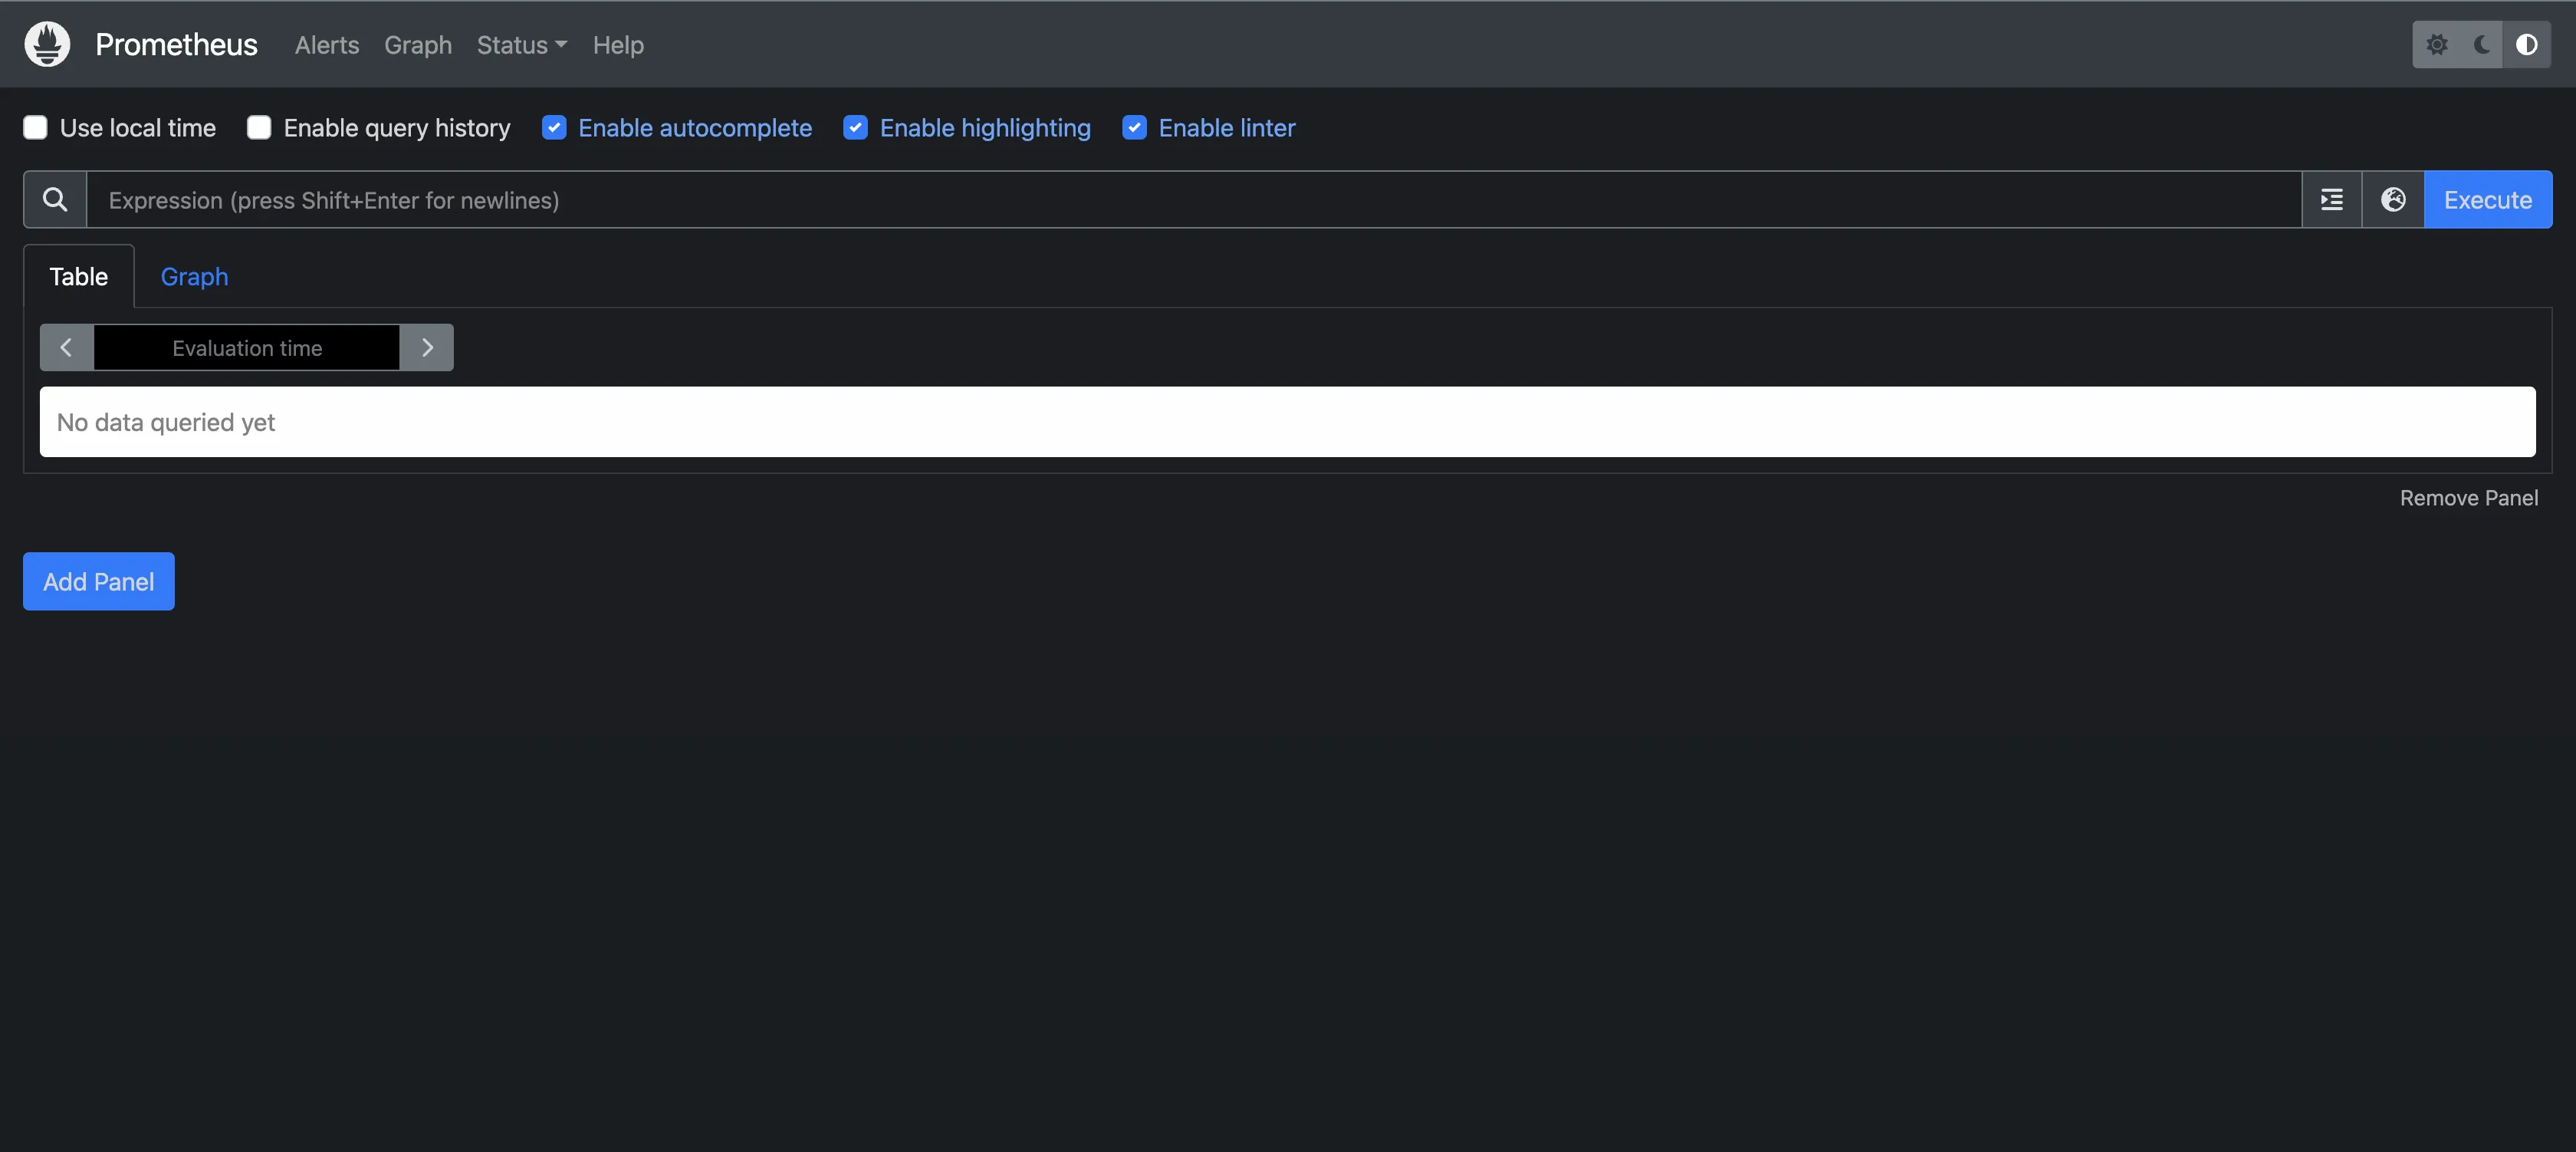
Prometheus, on the other hand, has limited visualization capabilities. It has a very basic built-in expression browser for visualizing metrics, but this doesn’t provide much information about your metrics data. Prometheus provides only table and graph visualization options. I couldn't make sense of my application metrics using them, so I had to send my application data to Grafana for visualization, which required setting up Grafana separately.
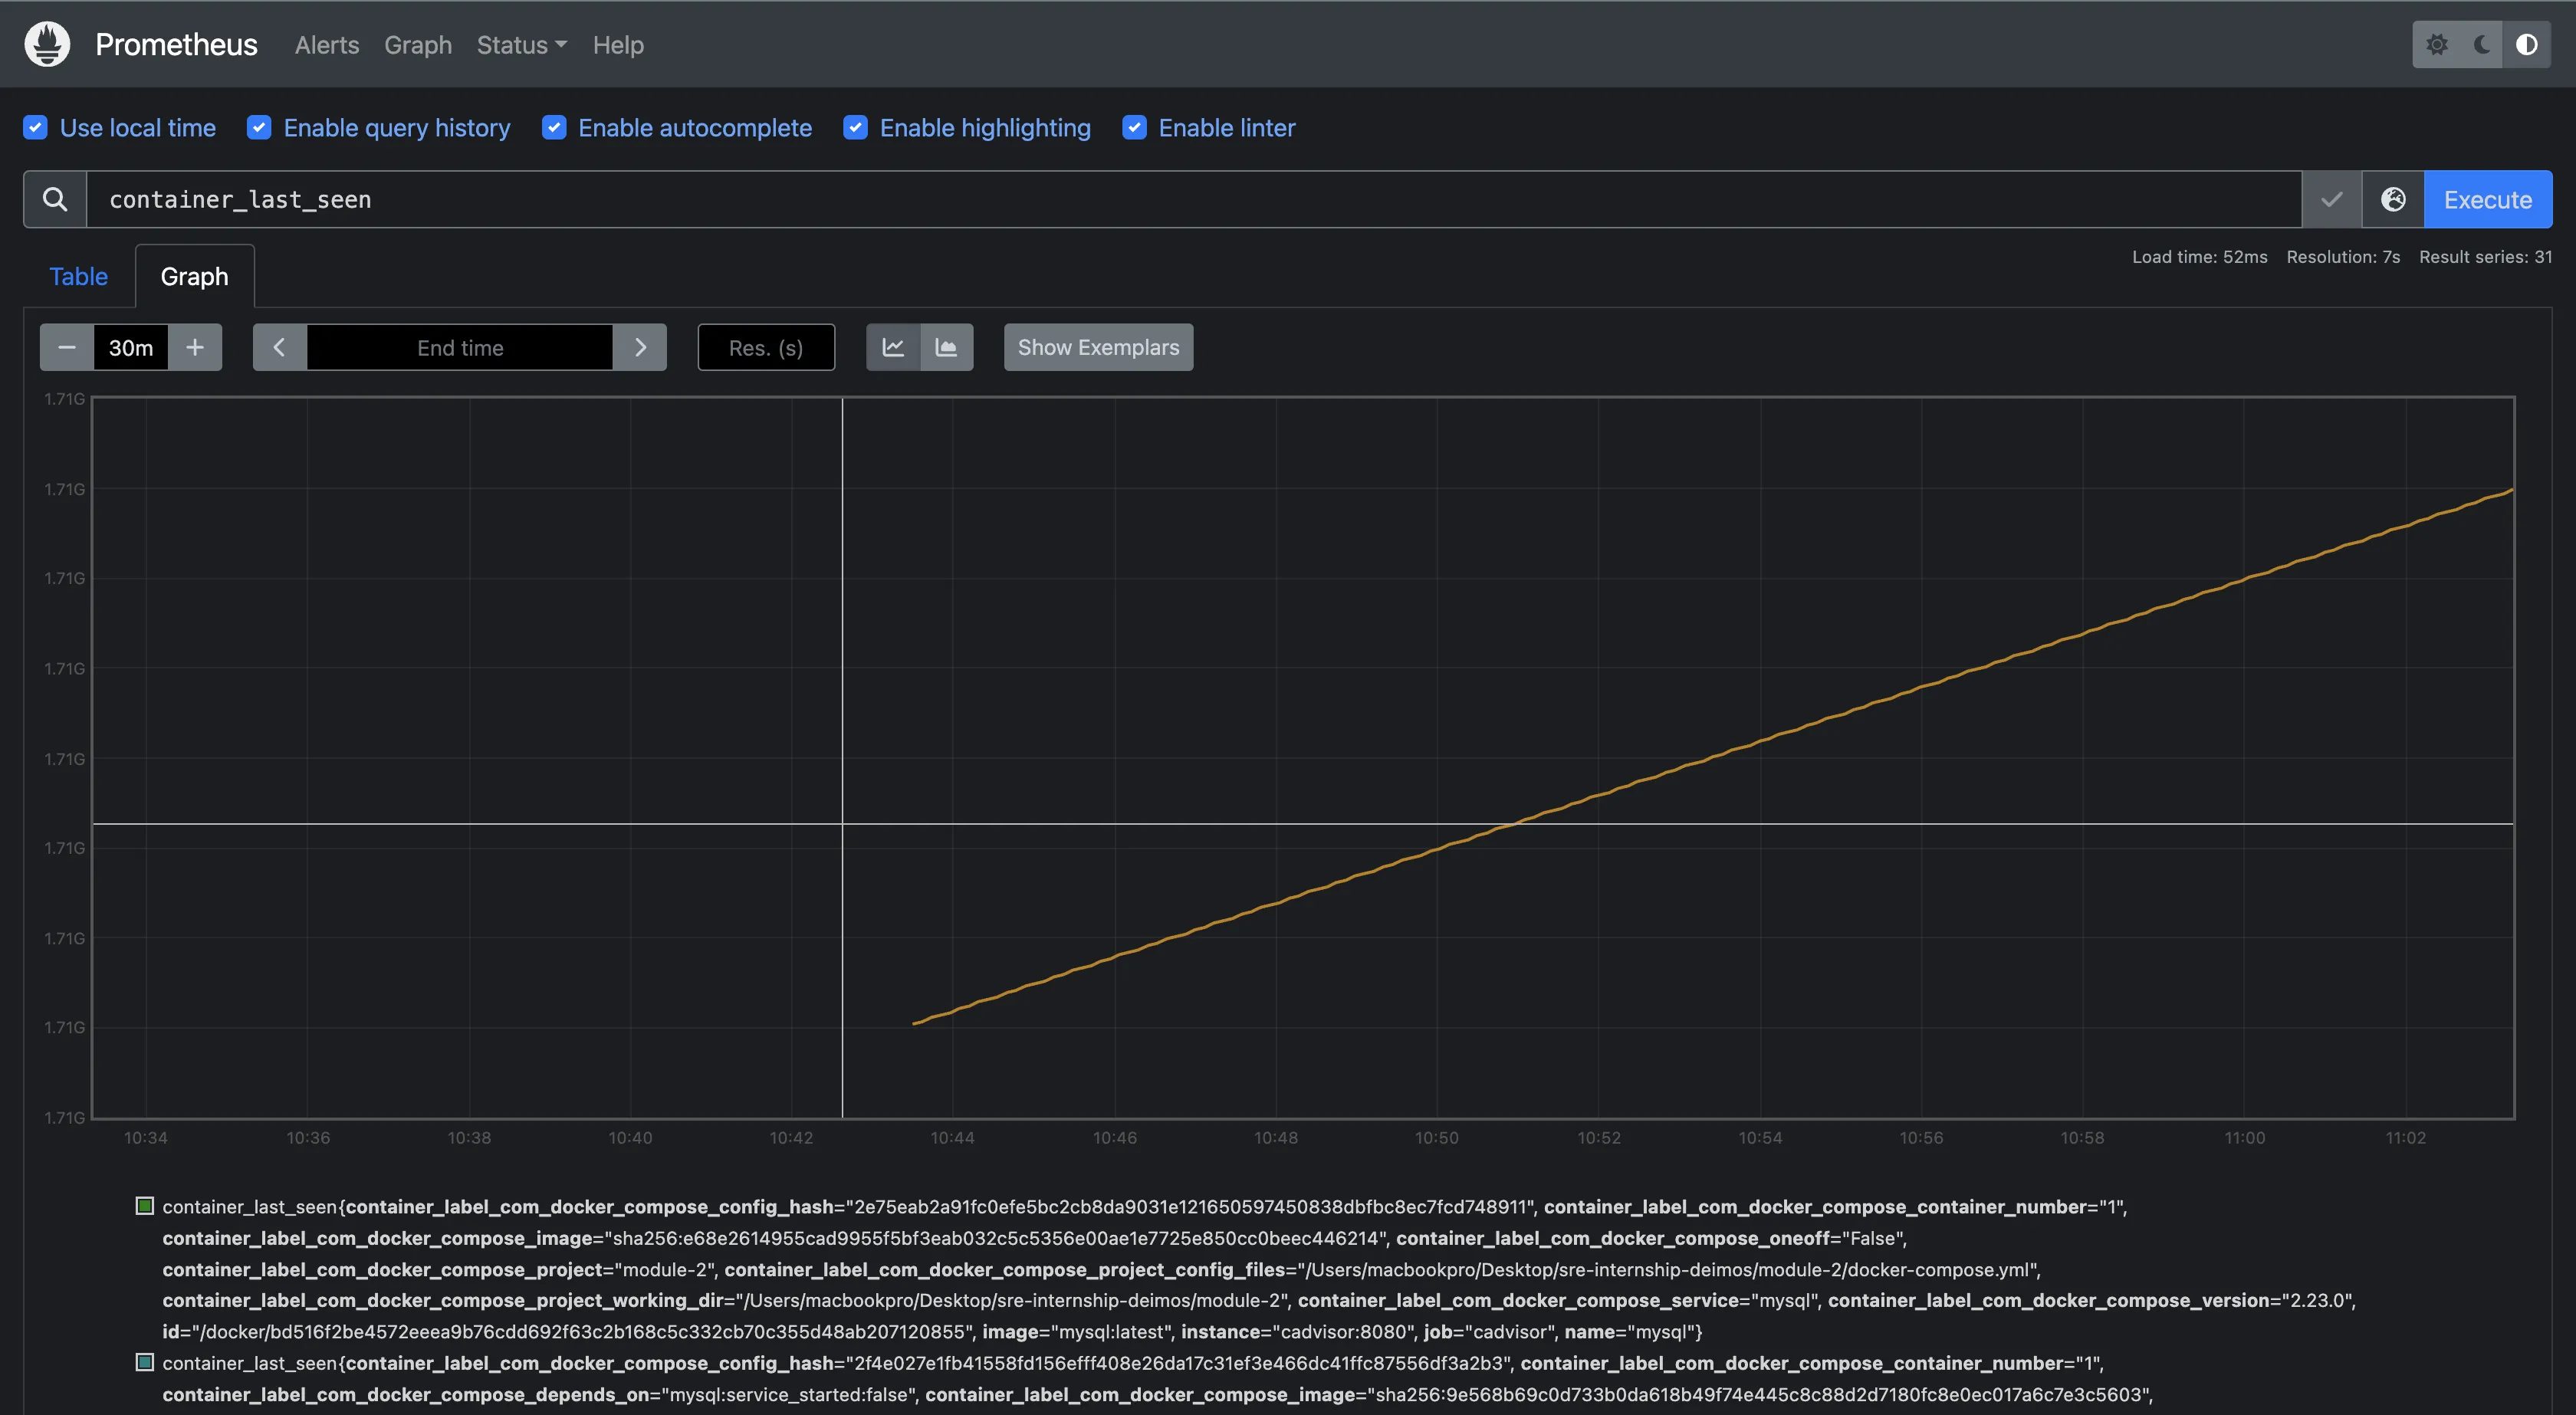
New Relic clearly provides advanced visualization capabilities as opposed to Prometheus.
APM (Application Performance Monitoring): New Relic
New Relic
New Relic's APM feature offers extensive monitoring capabilities for all your applications and microservices. It provides real-time monitoring of application telemetry data, including metrics, logs, events, and transactions, through a combination of pre-built and custom dashboards.
Additionally, it extends its functionality with features like service maps, offering visualization of inter-service relationships and dependencies within an application, SLA reports, vulnerability management, and much more. New Relic’s APM feature is comprehensive, and I was particularly impressed by the depth of information it provided about my application.
Prometheus
Prometheus currently lacks APM functionality as it is focused on the collection of metrics data only.
Of both tools, New Relic stands out with its impressive APM feature.
Data Storage: New Relic
New Relic
New Relic utilizes the New Relic Database (NRDB) for data storage, a system designed to handle vast volumes of data efficiently. NRDB is capable of ingesting massive datasets, enabling it to deliver queries with exceptional speed. Because NRDB is hosted in the cloud, it benefits from a distributed architecture that supports unlimited scalability. This setup ensures that your data storage needs are met, regardless of the volume of data you generate.
The default data retention period is a minimum of 8 days, with the option to extend this period up to a year for certain data types, such as metrics.
Prometheus
Prometheus has an in-built time-series database optimized for the efficient handling of high-performance time-series data. This database facilitates rapid querying and the retrieval of historical data, ensuring that users can access and analyze metrics collected over time with ease. Unlike New Relic, Prometheus does not provide long-term data storage capabilities. To manage data over extended periods, it requires integration with other tools.
New Relic’s NRDB architecture makes it a clear win over Prometheus for data storage.
Data Query: Tie
New Relic
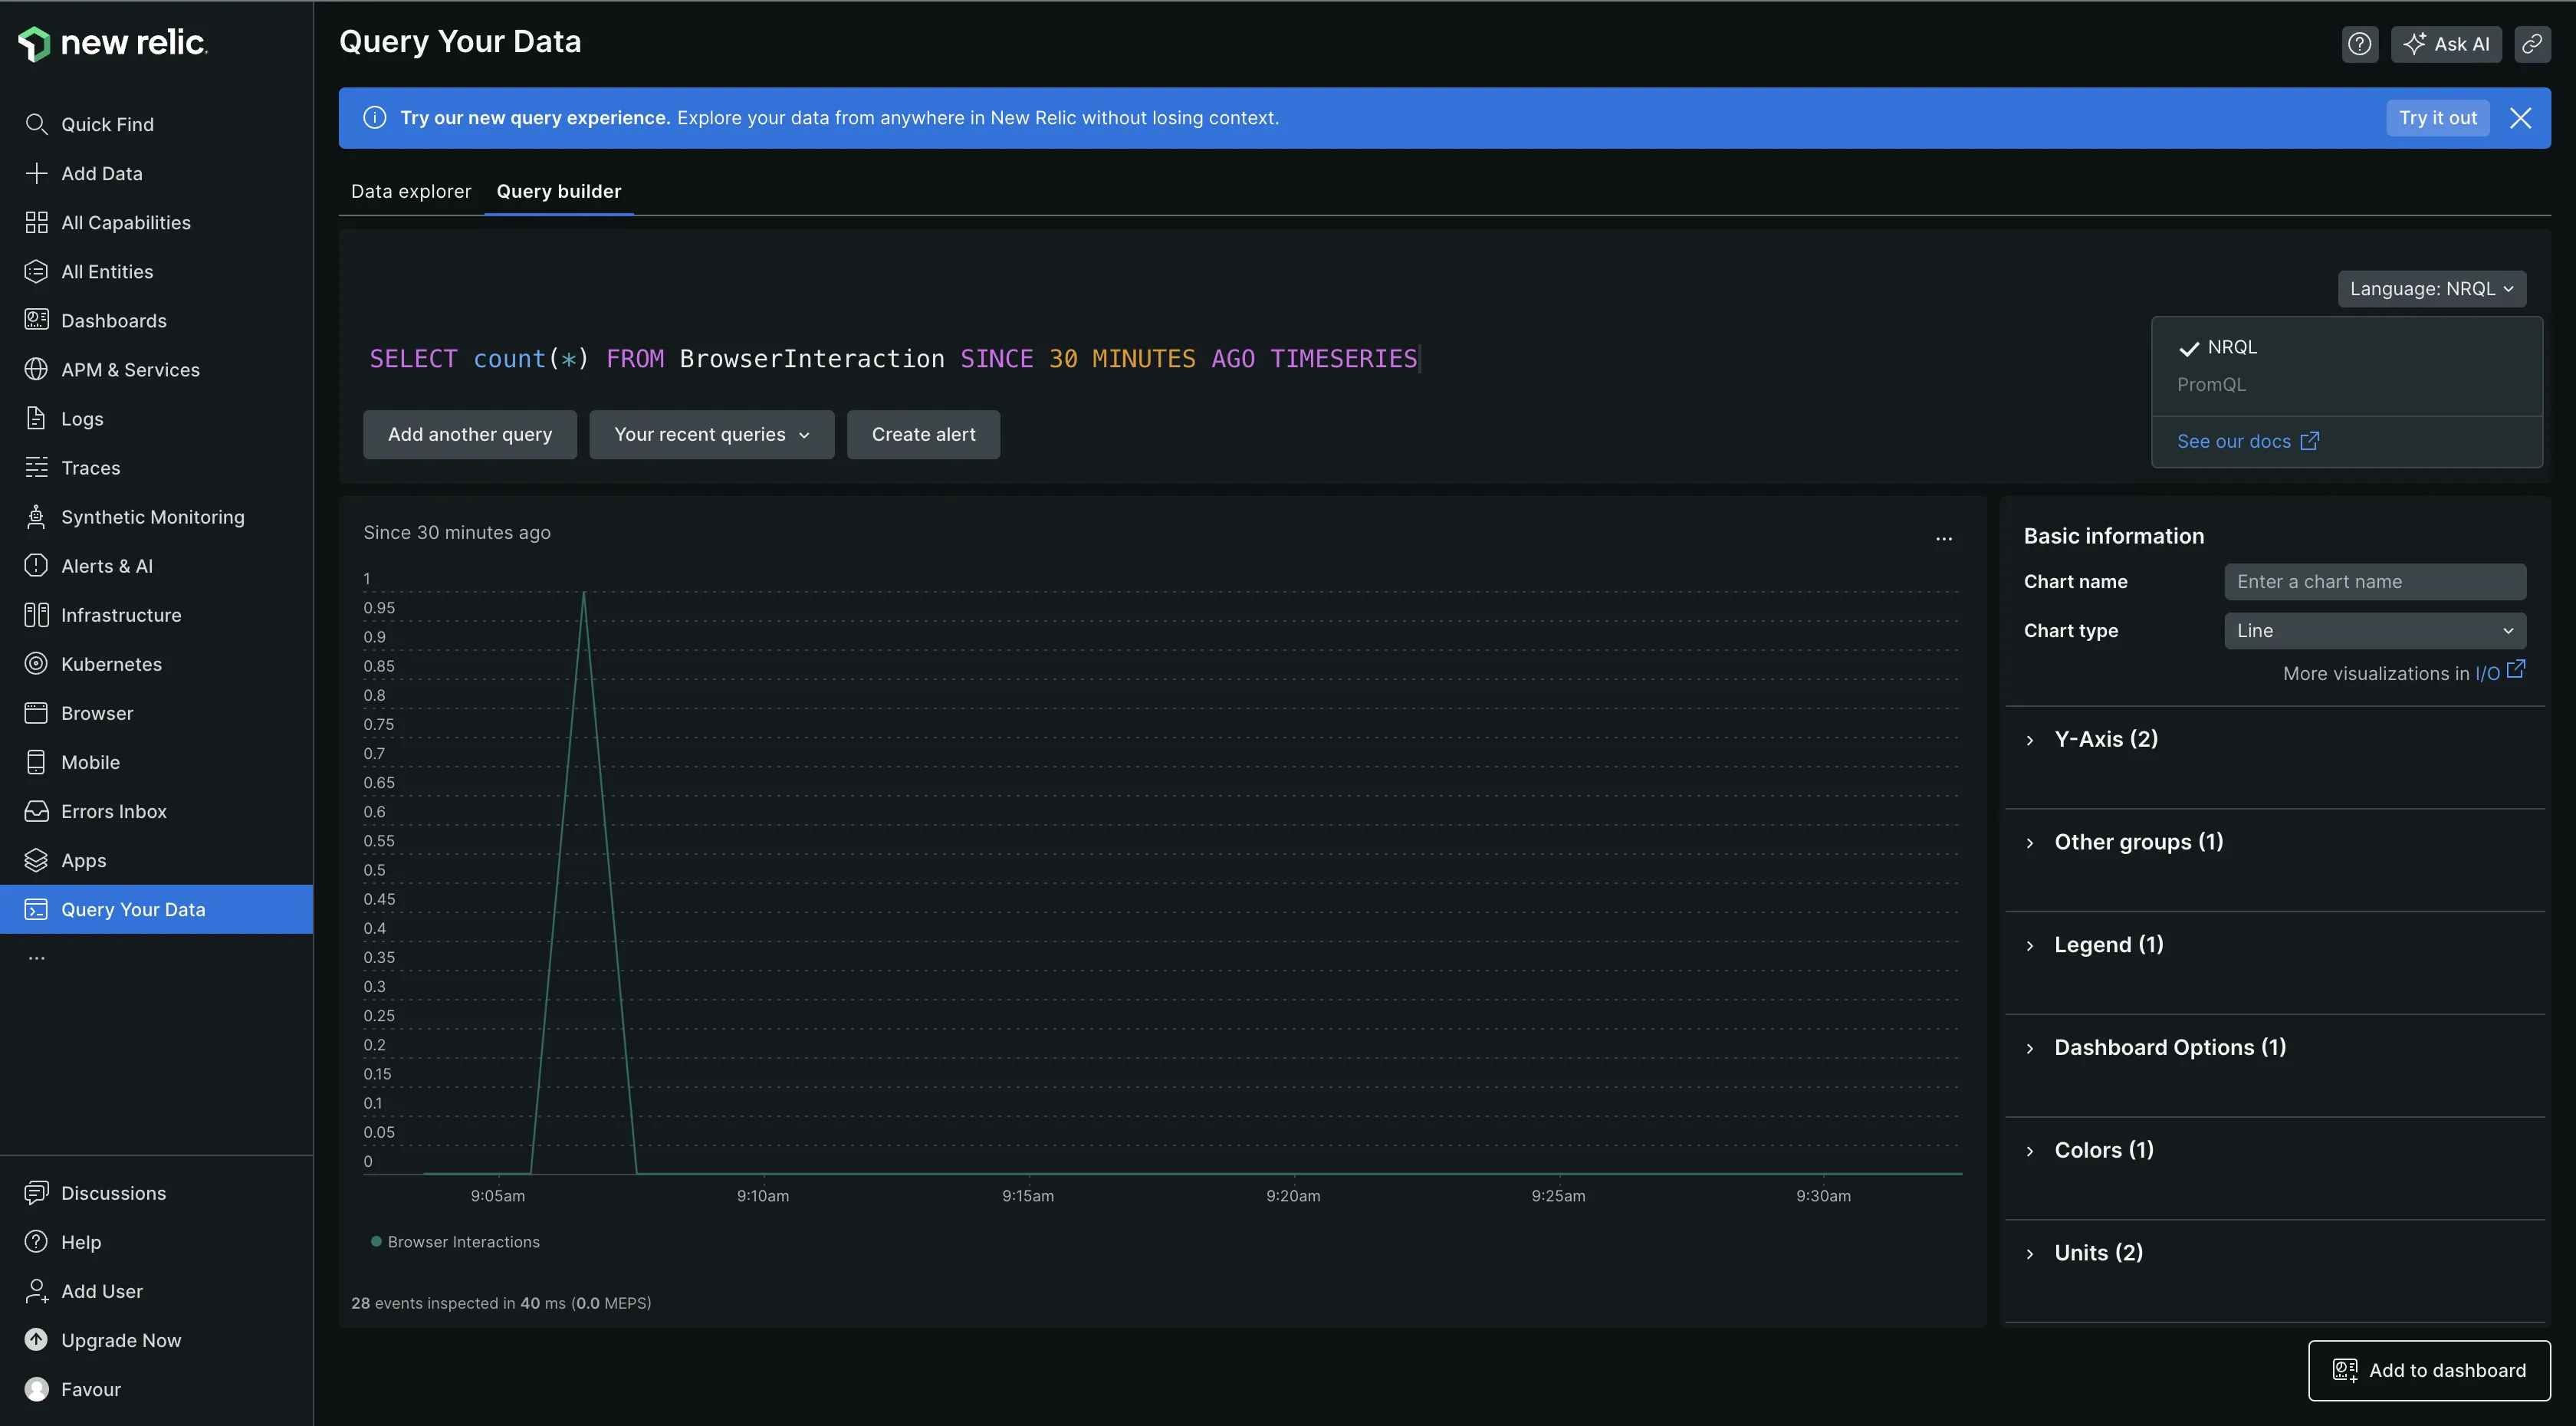
New Relic uses the New Relic Query Language (NRQL) for data queries. NRQL allows for the creation of custom charts, addresses troubleshooting and business analysis questions, and configuration of NRQL-based alerts.
Additionally, NRQL integrates with New Relic's APIs, such as NerdGraph, for more complex data retrieval needs. It can be used to create simple queries, such as fetching rows of data in a raw tabular form to give insight into individual events and run powerful calculations on the data before it's presented to you, such as crafting funnels based on how end users are using your site or application.
Prometheus
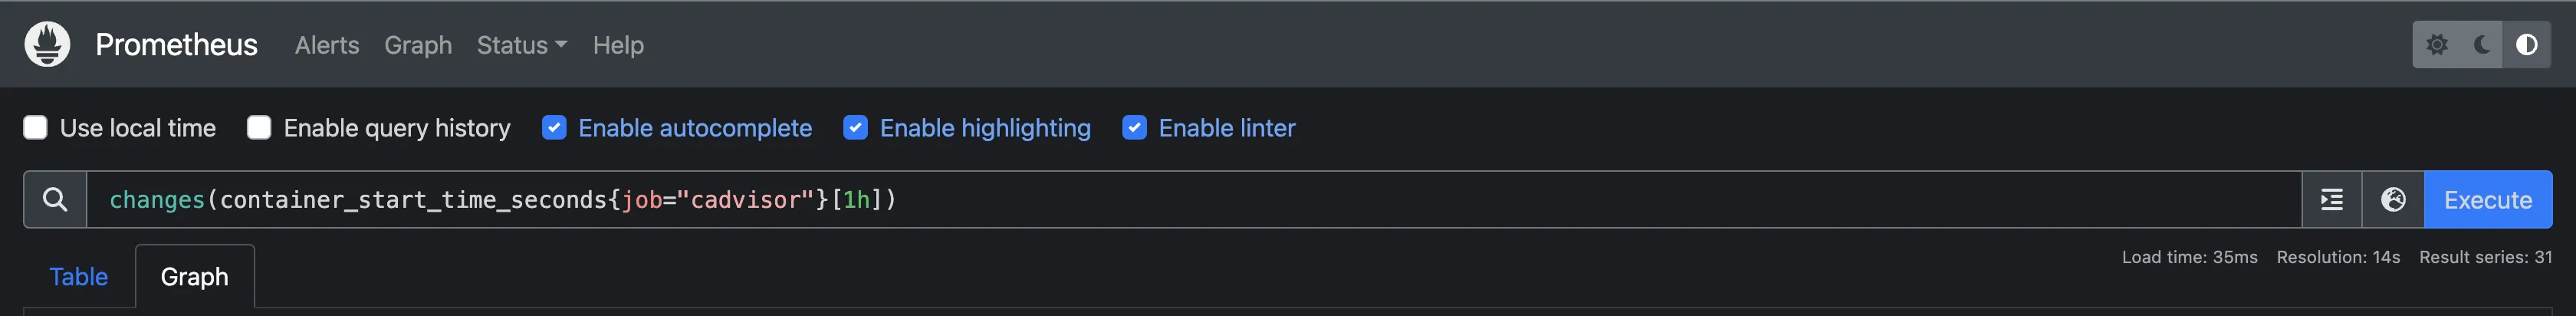
Prometheus provides a powerful and flexible querying language known as PromQL (Prometheus Query Language) for querying and analyzing time-series data. PromQL allows users to perform a wide range of operations, including filtering, aggregation, and mathematical transformations, on the collected metrics data. Users can write expressive queries to extract valuable insights and monitor system performance effectively. With support for functions like rate, sum, and histogram_quantile, PromQL enables advanced analysis and visualization of metrics data.
Both tools have good data query capabilities.
Alerting: New Relic
New Relic
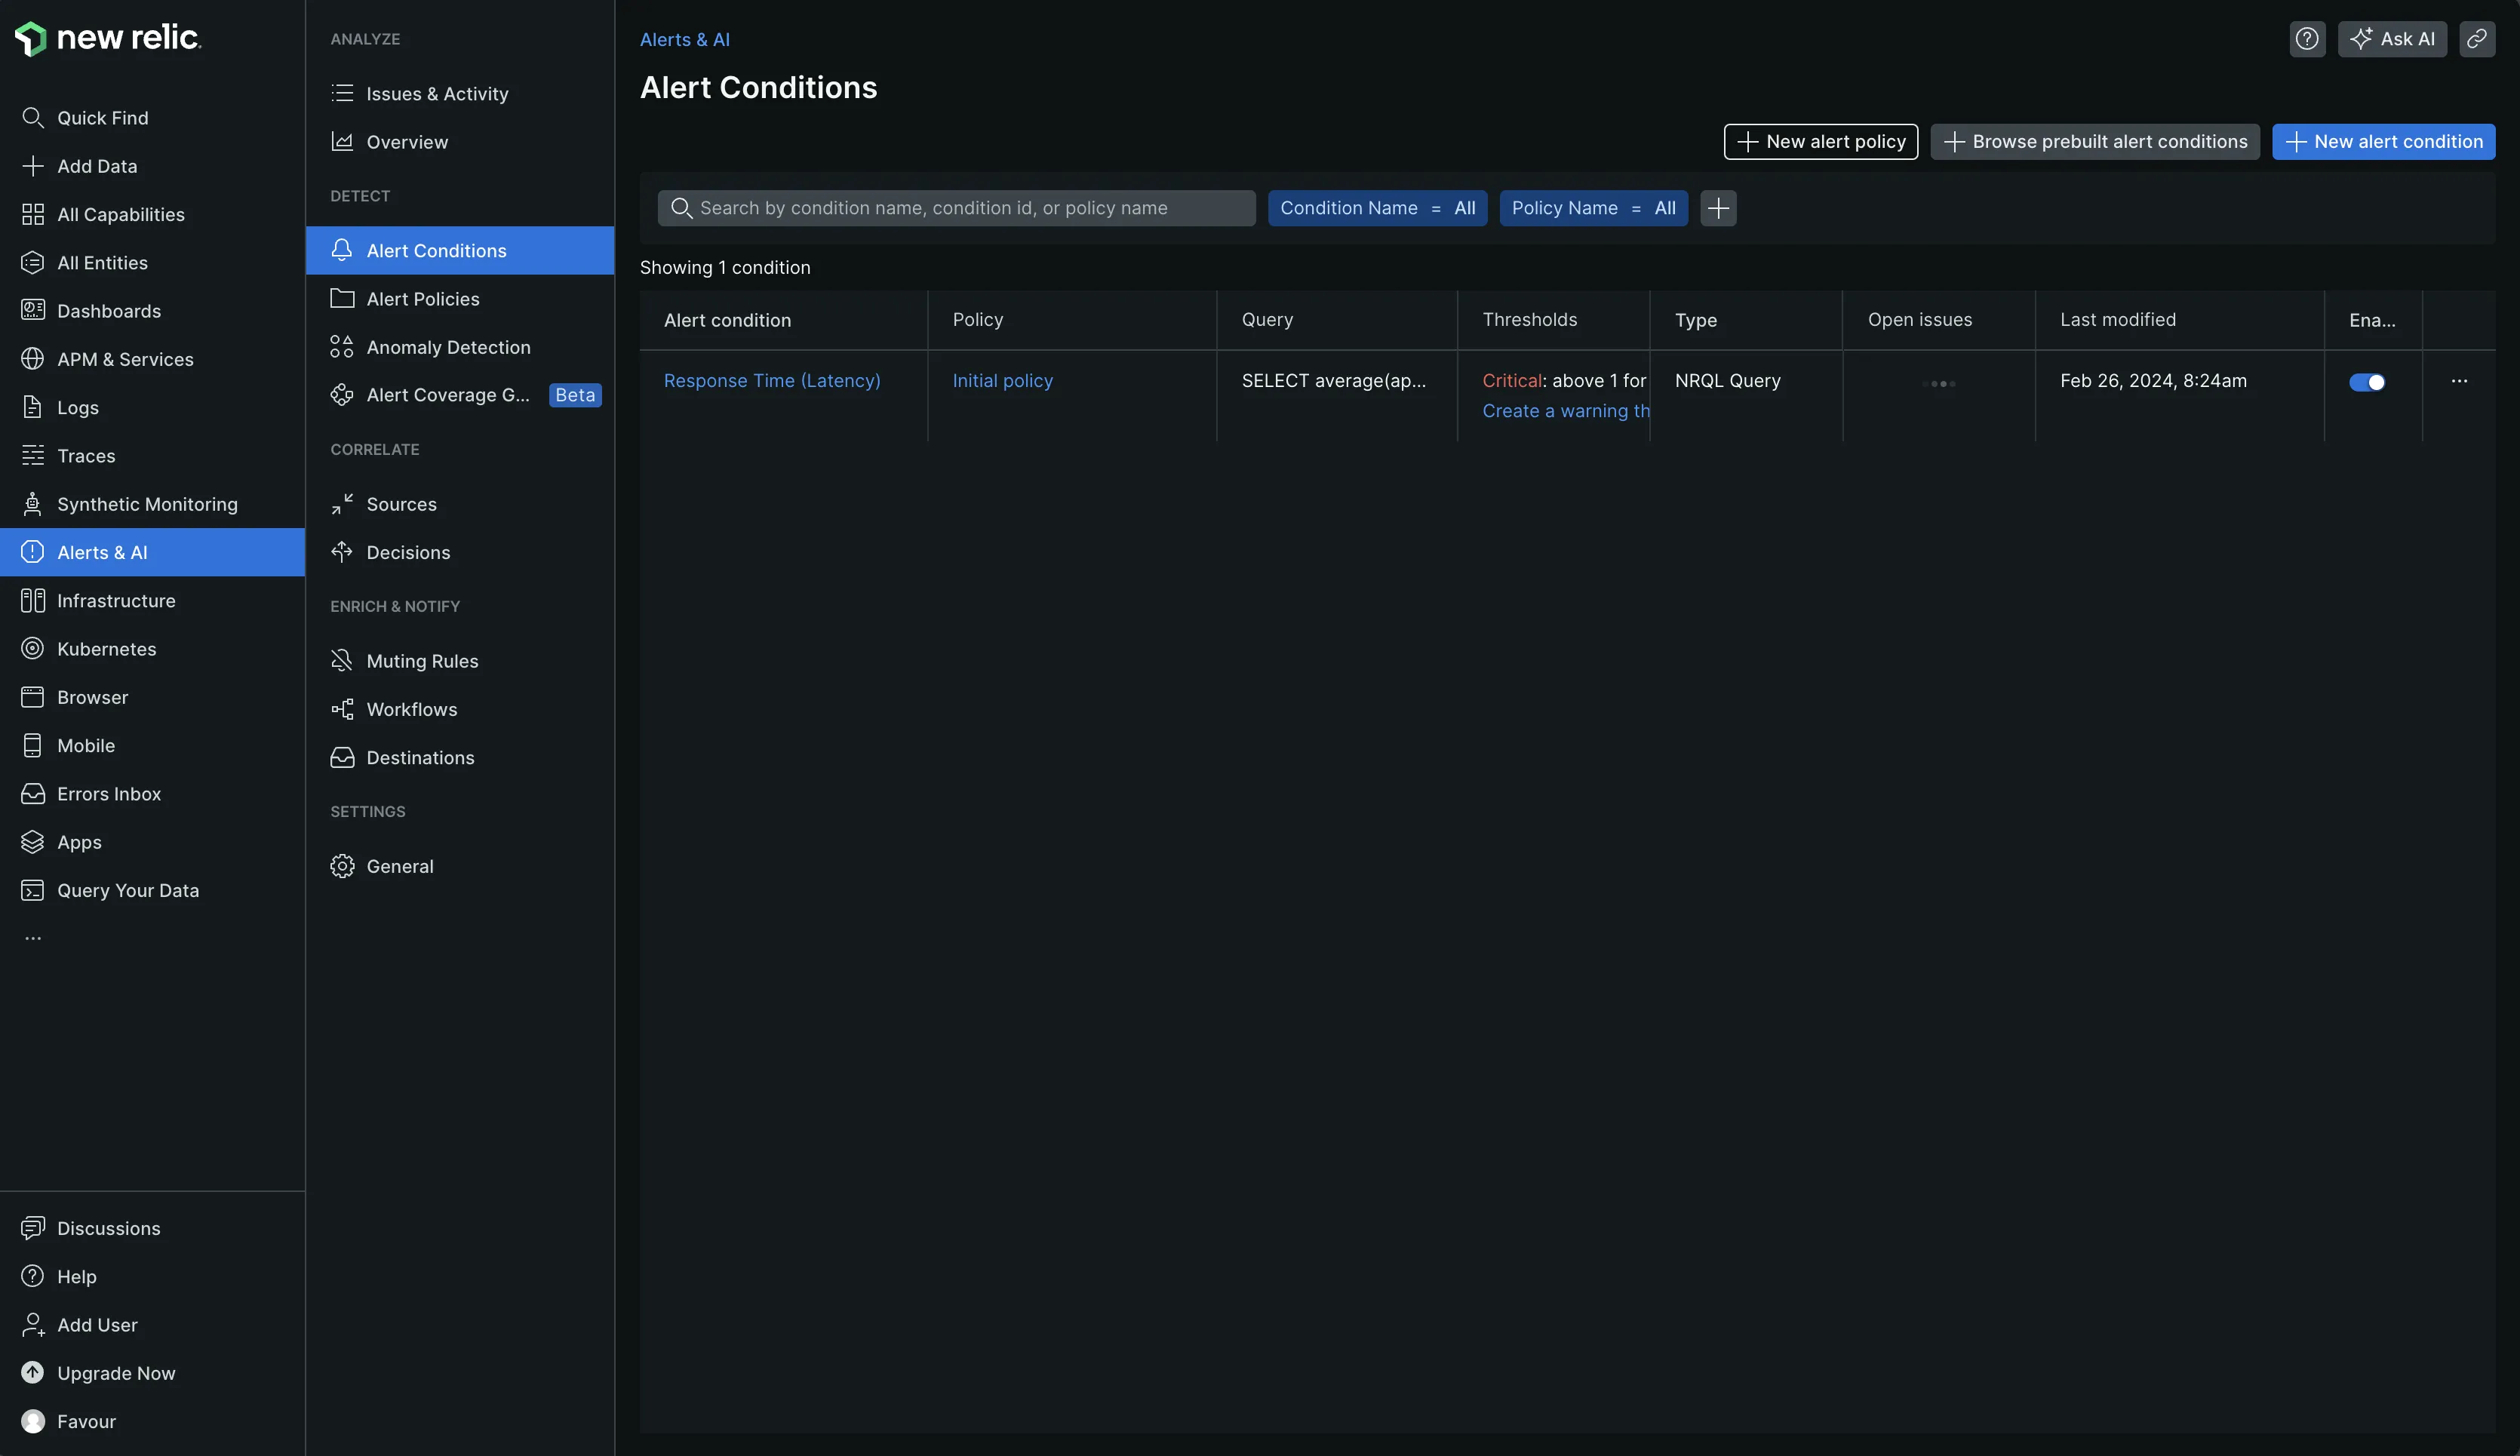
New Relic's alerting feature, in collaboration with its AI capabilities, provides a robust and intelligent system for managing alerts and addressing issues. It supports anomaly detection, alert organization through tagging, signal evaluation at predetermined thresholds, and issue routing via notifications.
The alerting system is equipped with extensive capabilities, including the configuration of signals for evaluation at specific thresholds, root cause analysis, alert organization through tagging, the identification of anomalies, and the routing of issues to systems via notifications. The AI feature enhances the alerting system by enriching issue notifications with additional New Relic data, providing deeper insights into each alert. It correlates incoming incidents to identify patterns and suppresses noise, ensuring that you receive notifications only when necessary.
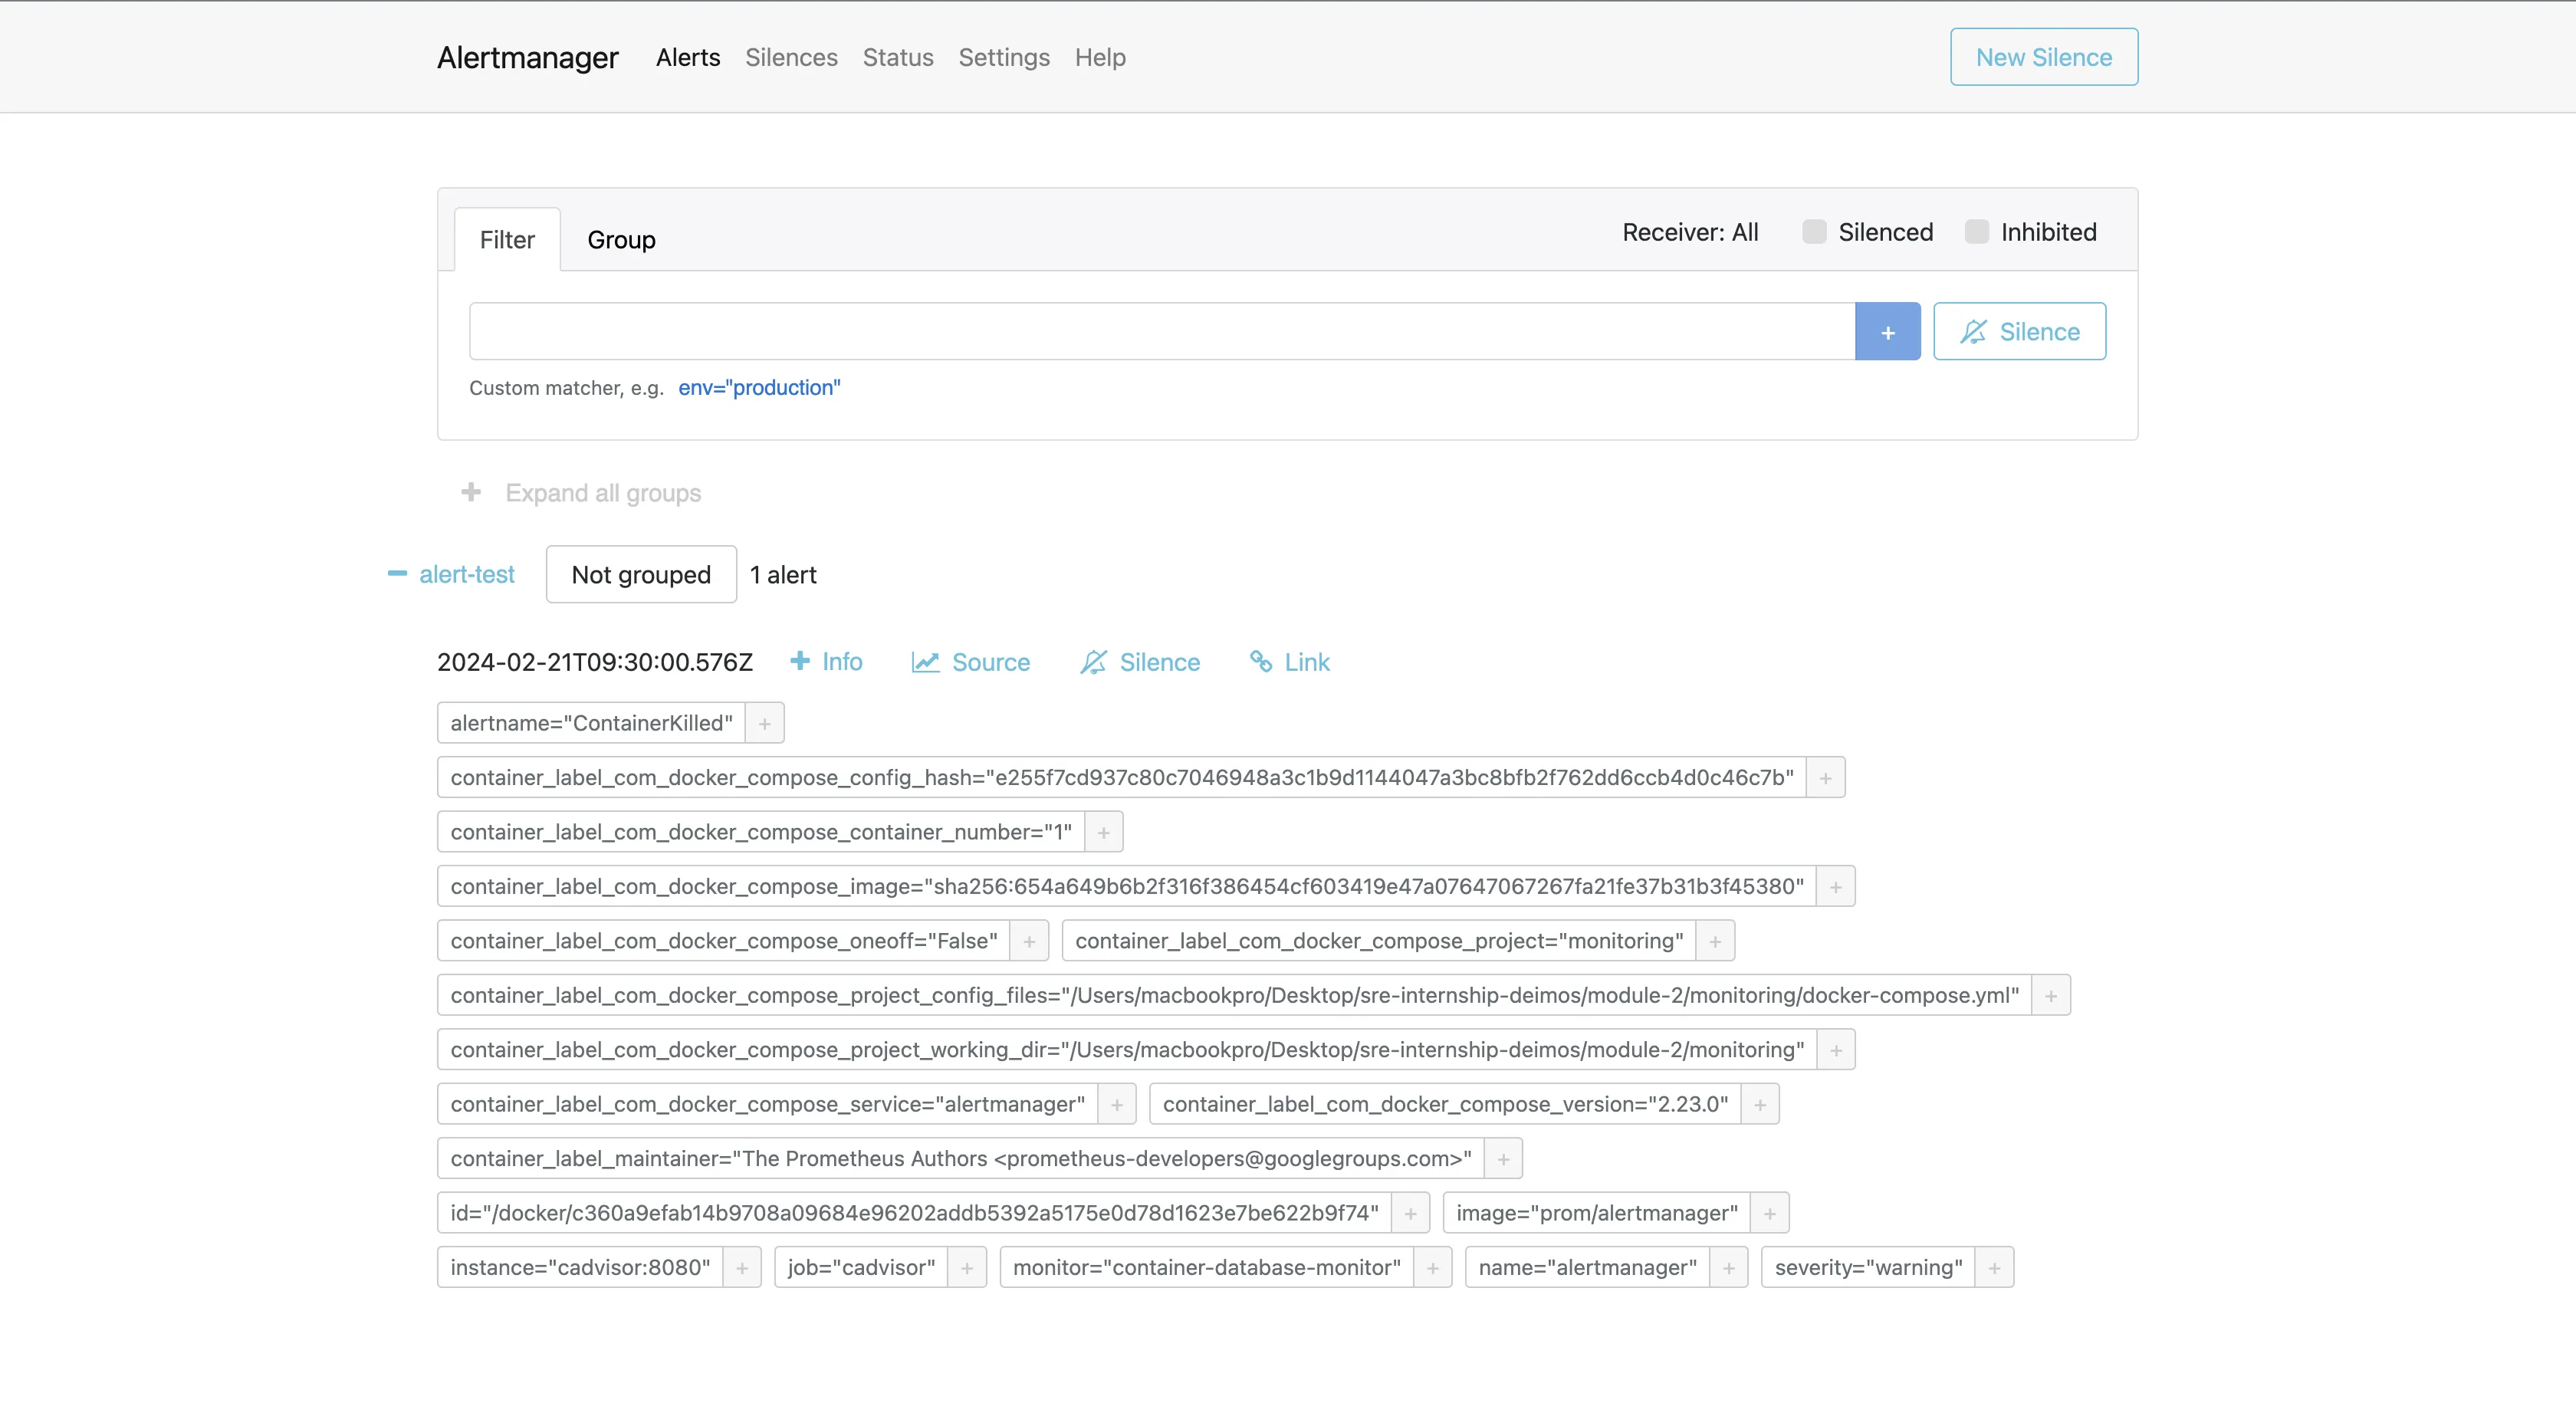
Prometheus
In contrast, Prometheus lacks a built-in mechanism for explicitly configuring alert rules. Instead, alerting is handled by a component known as Alertmanager. Alertmanager handles alerts, including silence, inhibition, aggregation, and notification transmission. It can be set up to send alerts through a variety of channels, including email, on-call notification systems, and chat platforms, through the definition of alert rules. Once the conditions in the alert rules are met, Prometheus creates the alert instances and sends them to Alertmanager.
The integration of AI with New Relic's Alerting feature enhances its alerting capabilities, making it a superior alerting option.
UI/UX: New Relic
New Relic
New Relic's user interface is designed to be straightforward and accessible, making it very beginner-friendly. As a new user, I find it incredibly easy to navigate. The UI provides all the necessary information, with minimal need to refer to the documentation for navigation, significantly enhancing the user experience.
Prometheus
Prometheus provides a basic web interface, primarily focused on querying and visualizing time series data. The UI is functional but relatively minimalistic, with options for executing PromQL queries, viewing graphs, and exploring metrics. The user experience in Prometheus is straightforward and efficient.
Overall, New Relic has a better user experience and user interface.
Pricing: Prometheus
New Relic
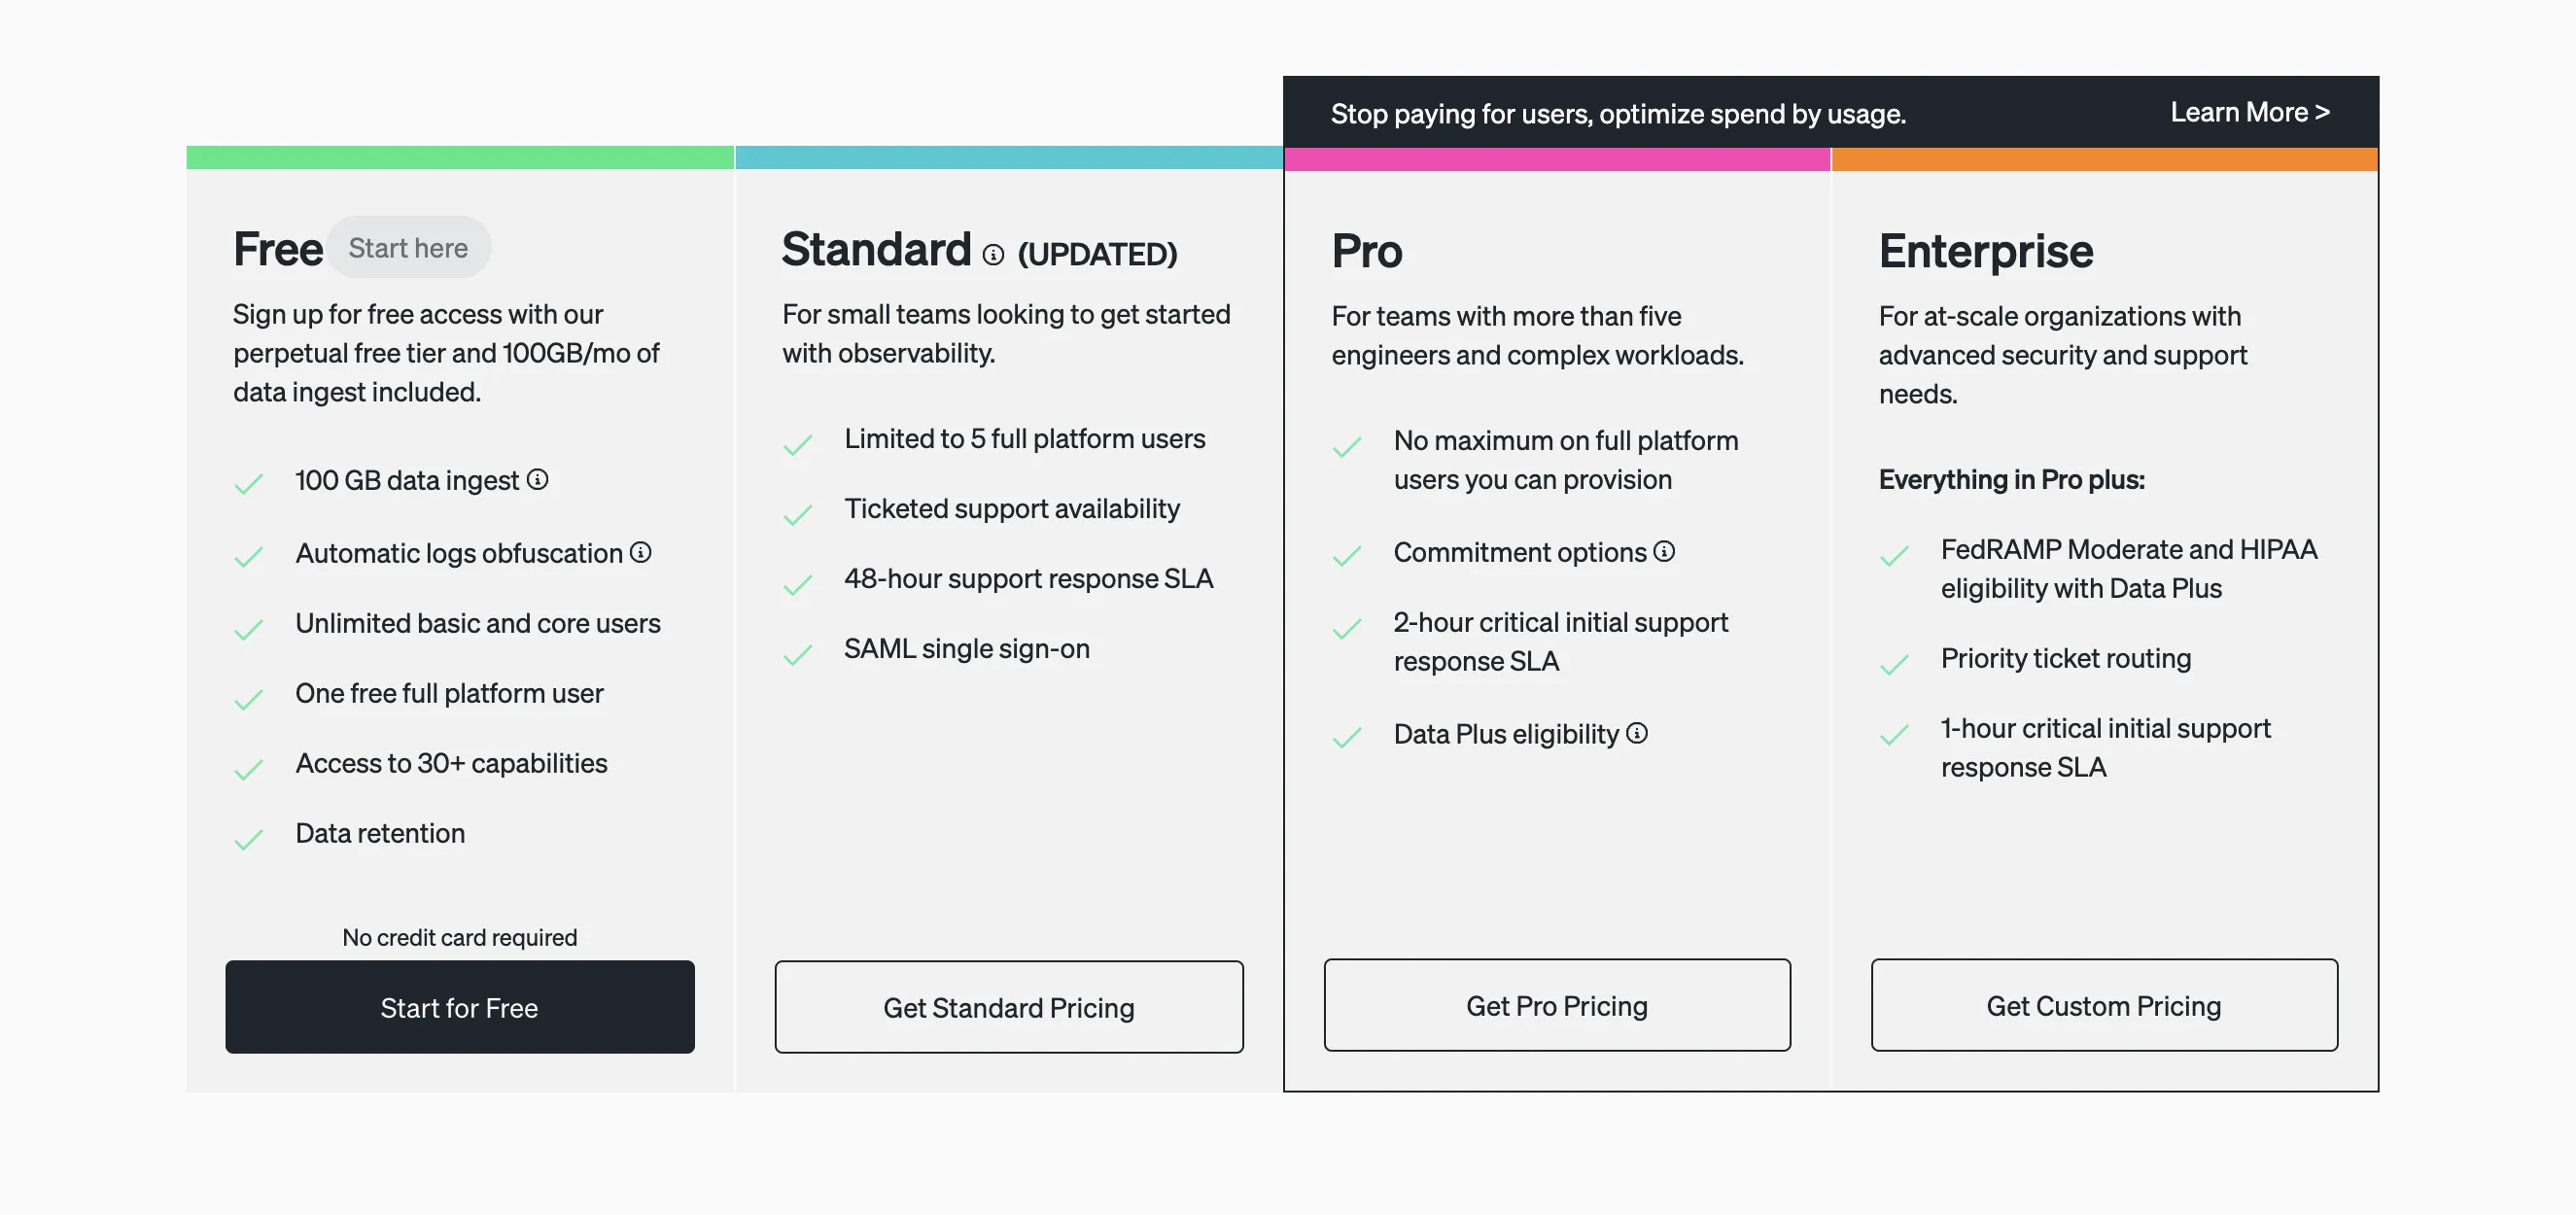
New Relic’s pricing is usage-based. Pricing is calculated by the volume of data ingested per month and the number of users.
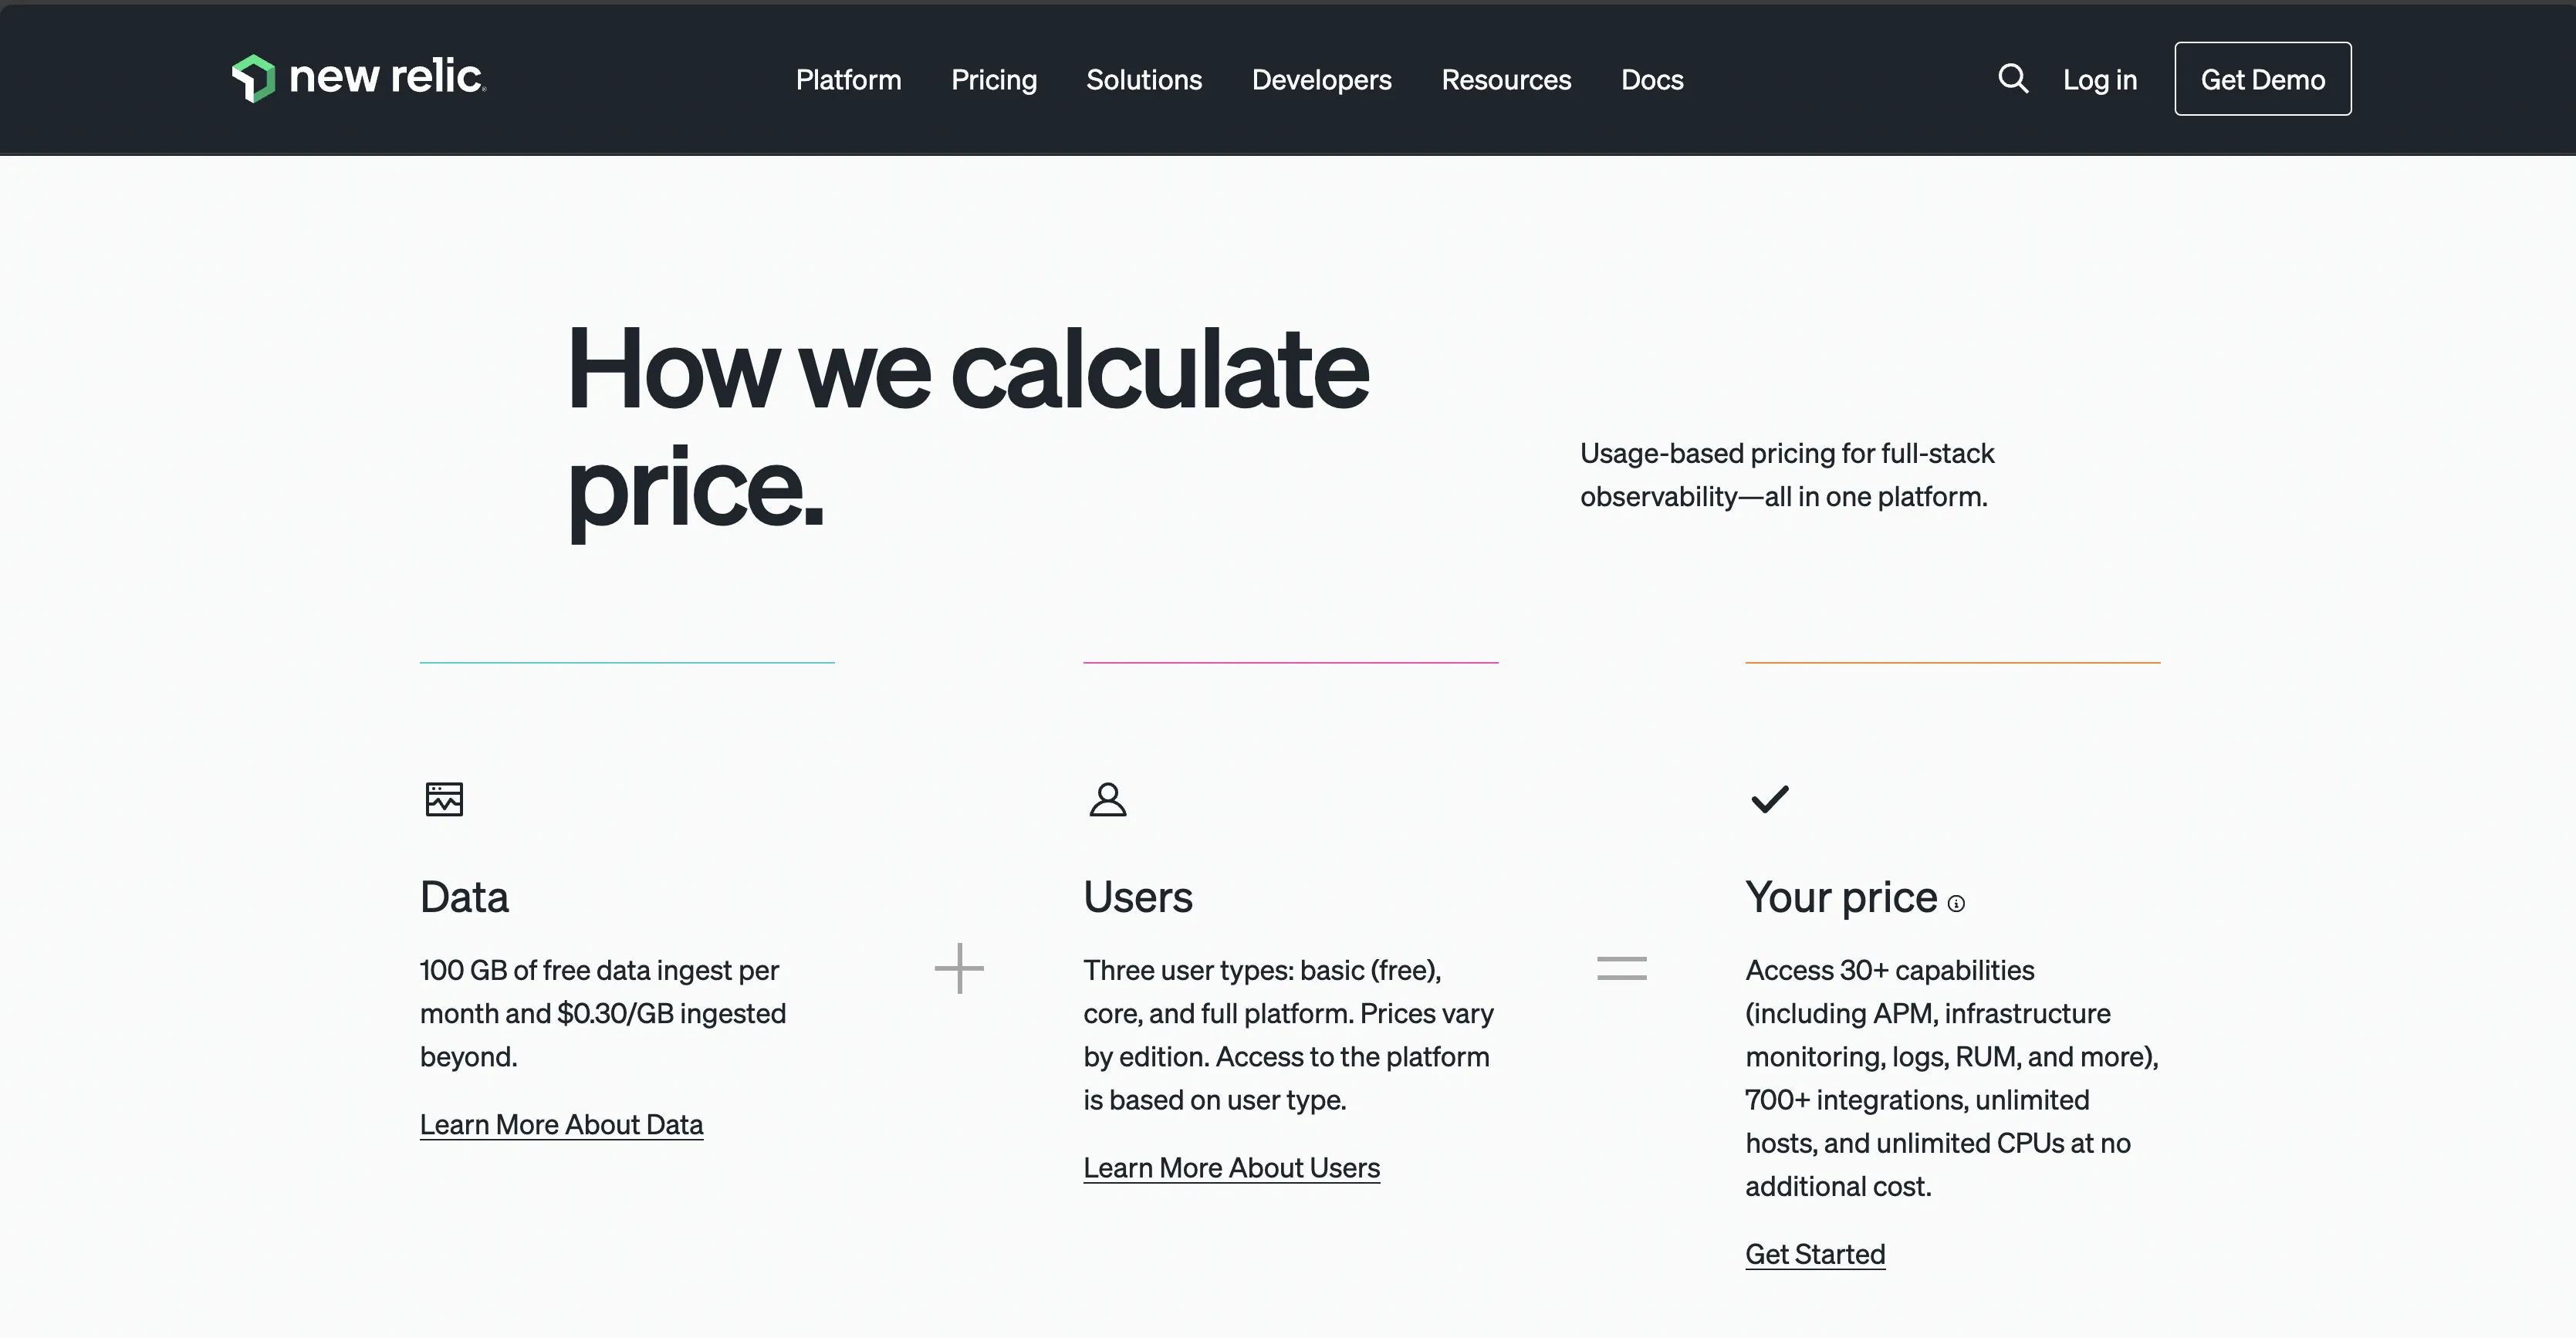
It has 4 different pricing tiers, with a free forever tier offering access to all 30+ New Relic platform capabilities and 100 GB of free data ingestion per month.
New Relic can be seen as a good option based on its free forever plan, which allows new users to evaluate its capabilities without incurring immediate costs.
Prometheus
Prometheus is open-source licensed, which makes it free to use. It doesn’t have a paid version.
Prometheus has a better advantage over New Relic regards pricing.
Documentation and Community Support: New Relic
New Relic
The platform includes a support center where users can create support cases for assistance, access a knowledge base, and a developer forum for developer resources. New Relic also provides New Relic University, an online learning platform that offers courses and learning paths to help users develop their skills in observability, monitoring, and application performance management.
Prometheus
Prometheus has similar comprehensive and user-friendly documentation as that of New Relic. It has an active and responsive community that provides ample support through forums, mailing lists, and chat rooms where users can seek assistance, exchange insights, and contribute to the collective knowledge base.
Given that users pay for its services, New Relic provides more support compared to Prometheus.
New Relic vs Prometheus: The final verdict
When evaluating monitoring solutions, it's essential to consider the specific use cases and requirements of your environment. New Relic and Prometheus each excel in different scenarios, catering to diverse needs.
Here’s a use-case-based guide for New Relic vs Prometheus:
- If you want better application performance management, choose New Relic.
- If your use case is real-user monitoring, then choose New Relic.
- If you require a tool with comprehensive monitoring and observability, choose New Relic.
- If your use case is solely collection of metrics, then choose Prometheus.
- If your use case is comprehensive monitoring besides metrics alone, choose New Relic.
- If you want to visualize and understand your application data, choose New Relic.
If you require a better monitoring and observability tool with OpenTelemetry support and better monitoring and observability capabilities, consider SigNoz.
Why choose SigNoz over New Relic and Prometheus?
While New Relic and Prometheus are valuable monitoring solutions, they are not without their limitations and drawbacks. SigNoz emerges as a compelling alternative, offering several advantages over both platforms.
Here are a few reasons why you should choose SigNoz over New Relic and Prometheus:
-
Open-Source
SigNoz offers both an open-source and cloud version, providing users with flexibility based on their specific requirements. Users can choose between the versions depending on their use case: opt for the self-hosted (open-source) version for complete control over environment management, or choose the cloud version for hassle-free management without the need for self-hosting. -
OpenTelemetry support
SigNoz is designed to natively support OpenTelemetry, a CNCF project rapidly gaining popularity and emerging as the standard for observability. It generates and manages telemetry data (logs, metrics, and traces) which are vital for achieving comprehensive application observability and monitoring. OpenTelemetry also frees you from vendor lock-in, enabling users to export data to any backend of choice. -
Transparent Pricing
Unlike New Relic's usage-based model, which charges based on the number of users, SigNoz Cloud allows you to invite an unlimited number of team members without additional charges for user seats. SigNoz offers transparent and predictable pricing, where you are billed solely based on the volume of data you send, preventing unexpected costs.The open-source version is also completely free to use and can save costs for new users looking to try out SigNoz.
Getting Started with SigNoz
SigNoz Cloud is the easiest way to run SigNoz. Sign up for a free account and get 30 days of unlimited access to all features.

You can also install and self-host SigNoz yourself since it is open-source. With 24,000+ GitHub stars, open-source SigNoz is loved by developers. Find the instructions to self-host SigNoz.
Further Reading:
