Splunk vs Dynatrace - Which Tool To Choose? [2026 Guide]
Splunk and Dynatrace are monitoring tools that provide a wide range of products and services for monitoring. In this post, I have compared Splunk and Dynatrace on important features like APM, log management, application security, etc.
💡 I instrumented a sample application and sent data to Splunk and Dynatrace to evaluate my experience. Some takeaways are subjective and based on personal preference.
Splunk vs Dynatrace: A Quick Overview
| Features | Splunk | Dynatrace |
|---|---|---|
| APM | ✅ | ✅ |
| Log Management | ✅ | ✅ |
| Application Security | ✅ | ✅ |
| Real User Monitoring | ✅ | 🟡 |
| Infrastructure Monitoring | ✅ | ✅ |
| Network Monitoring | ✅ | ✅ |
| AI-Driven Analytics | ✅ | ✅ |
| Security Information and Event Management (SIEM) | ✅ | ❌ |
| Synthetic Monitoring | ✅ | ✅ |
| 15-day free trial | ✅ | ✅ |
✅ - Available
❌ - Not Available
🟡 - Limited
APM: Dynatrace for comprehensive APM capabilities
Splunk
APM setup in Splunk was a bit of a struggle as I couldn’t immediately integrate my application data into the platform.
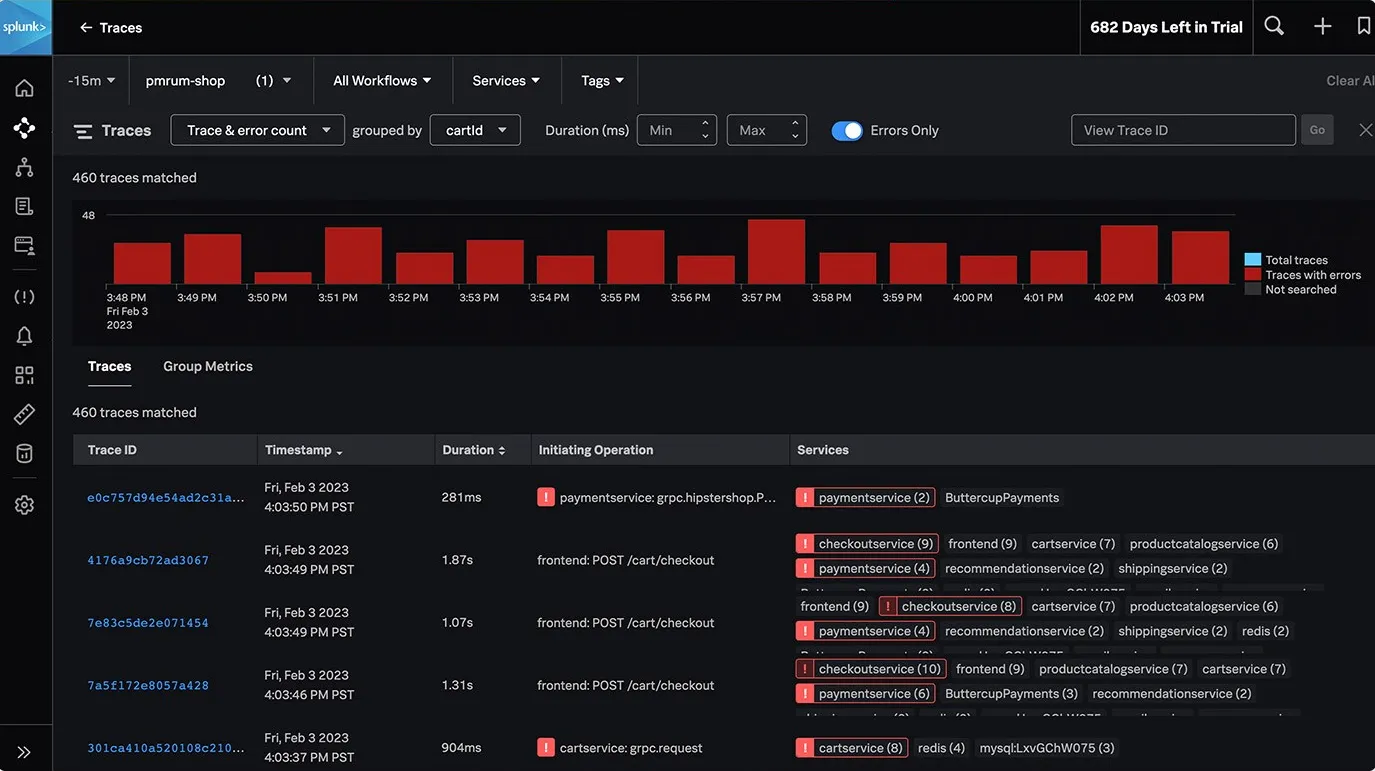
Splunk's APM feature provides end-to-end visibility into your application's performance and behavior by capturing all traces, and not just a subset. These traces can be grouped by tags, which I found useful for filtering, searching, and identifying patterns and anomalies within my application.
Splunk APM provides different visualization options to further understand your application data. The service maps and flamegraphs were particularly useful in troubleshooting as I could identify where failures occurred within my application, and analyze the latency of requests.
For detecting and alerting customer issues, Splunk APM uses a streaming analytics engine that analyzes data in real-time, allowing for immediate detection and alerting of any customer issues.
Dynatrace
APM setup in Dynatrace wasn’t very clear as the APM feature is not immediately visible within the user interface. I was eventually able to carry out the APM setup by utilizing the One Agent SDK, which works with the Dynatrace One Agent.
Dynatrace provides end-to-end visibility into the entire application stack, including user experience, application code, dependencies, databases, and infrastructure components. It utilizes advanced AI algorithms to automatically identify anomalies and root causes, enabling proactive problem-solving before they impact end-users.
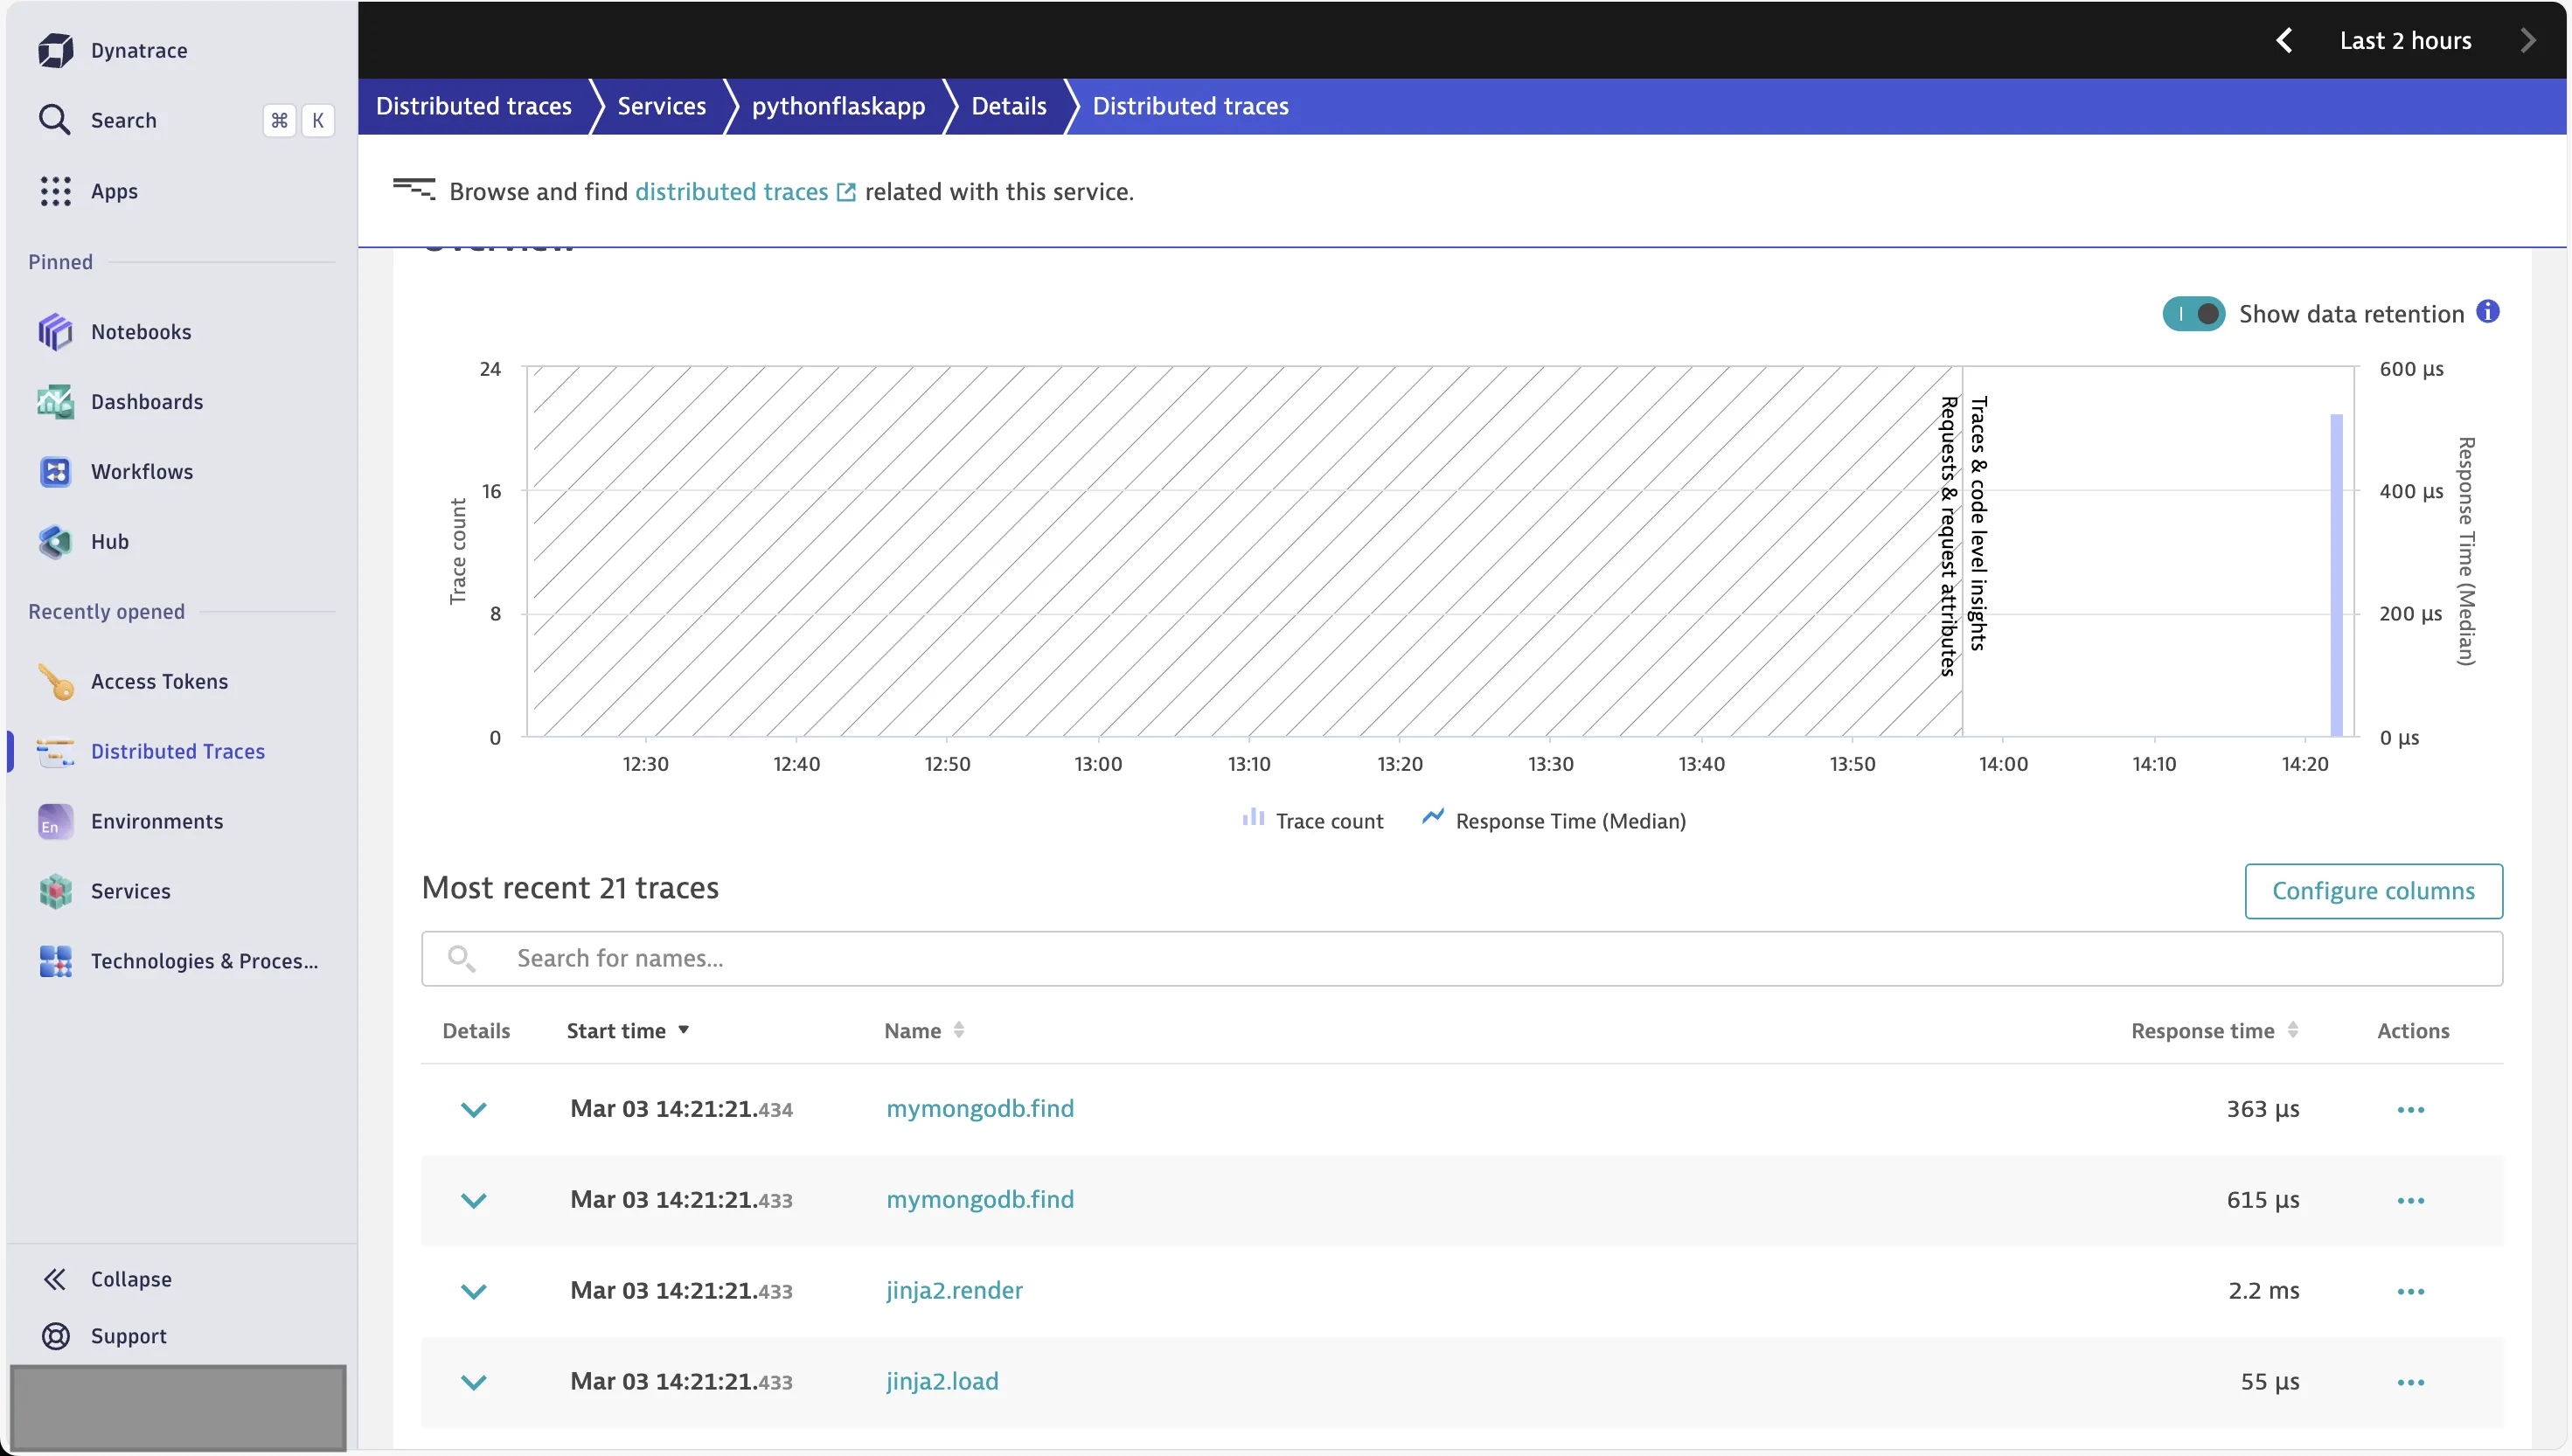
Its distributed tracing capabilities provided me with detailed insights into relevant calls for each trace as well as the logs associated with them.
If you are looking for a comprehensive, AI-driven platform that provides real-time insights into the performance and health of applications, Dynatrace is the right tool.
Log Management: Splunk for enterprise-level log management
Splunk
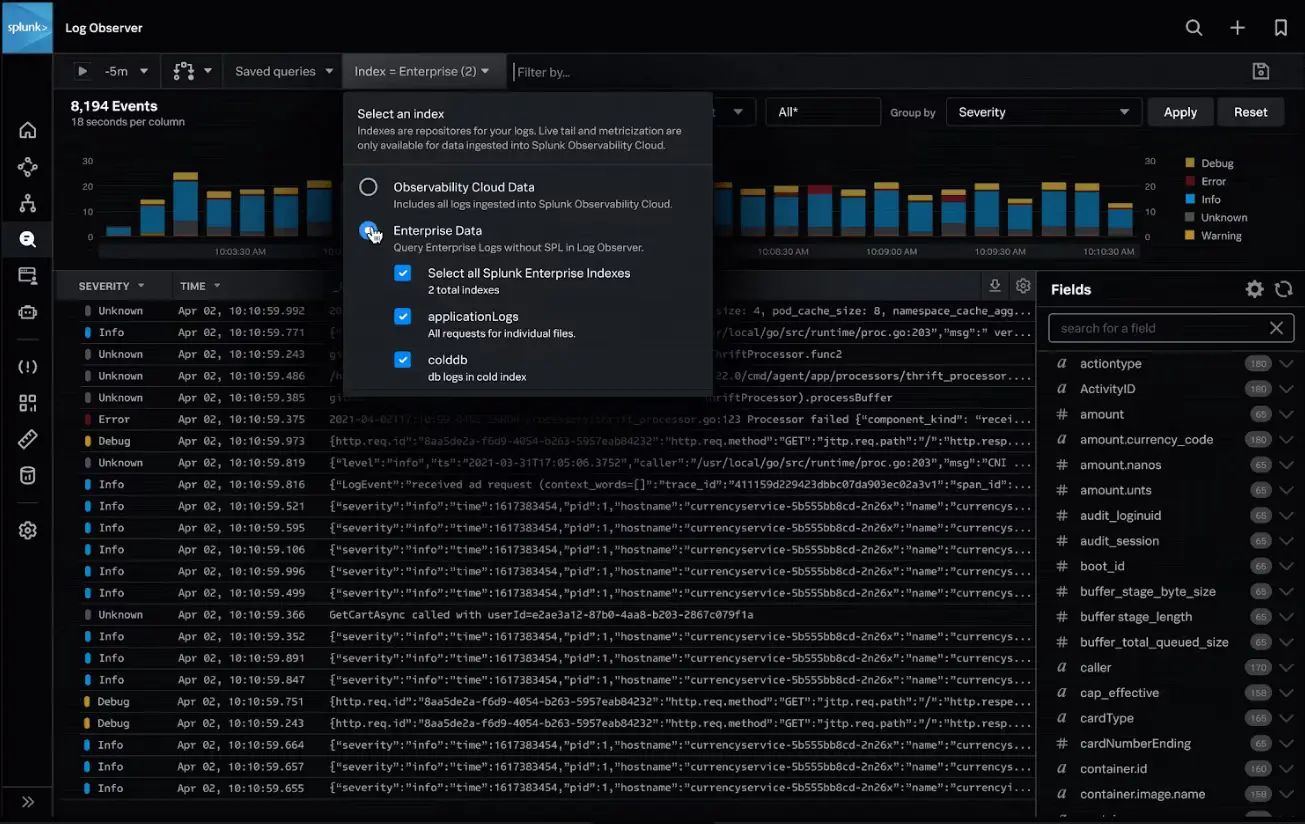
Splunk is a powerful tool designed to handle large volumes of data, making it an ideal solution for log management. It integrates log data from various Splunk platforms and data sources into the Splunk Observability Cloud, providing a centralized location for managing this data. However, it's important to note that Splunk does not automatically collect logs from applications. To capture application logs, the installation and configuration of the Universal Forwarder (UF) are necessary to ensure that application data is correctly formatted before being sent to Splunk.
For enhanced log management, Splunk utilizes the Log Observer Connect feature which enables the correlation of logs with real-time metrics and traces. This allowed me to perform log-based analysis of my data through advanced search, filtering, and visualization capabilities. It was also very useful for monitoring and troubleshooting my application’s performance in cases of failures and downtime.
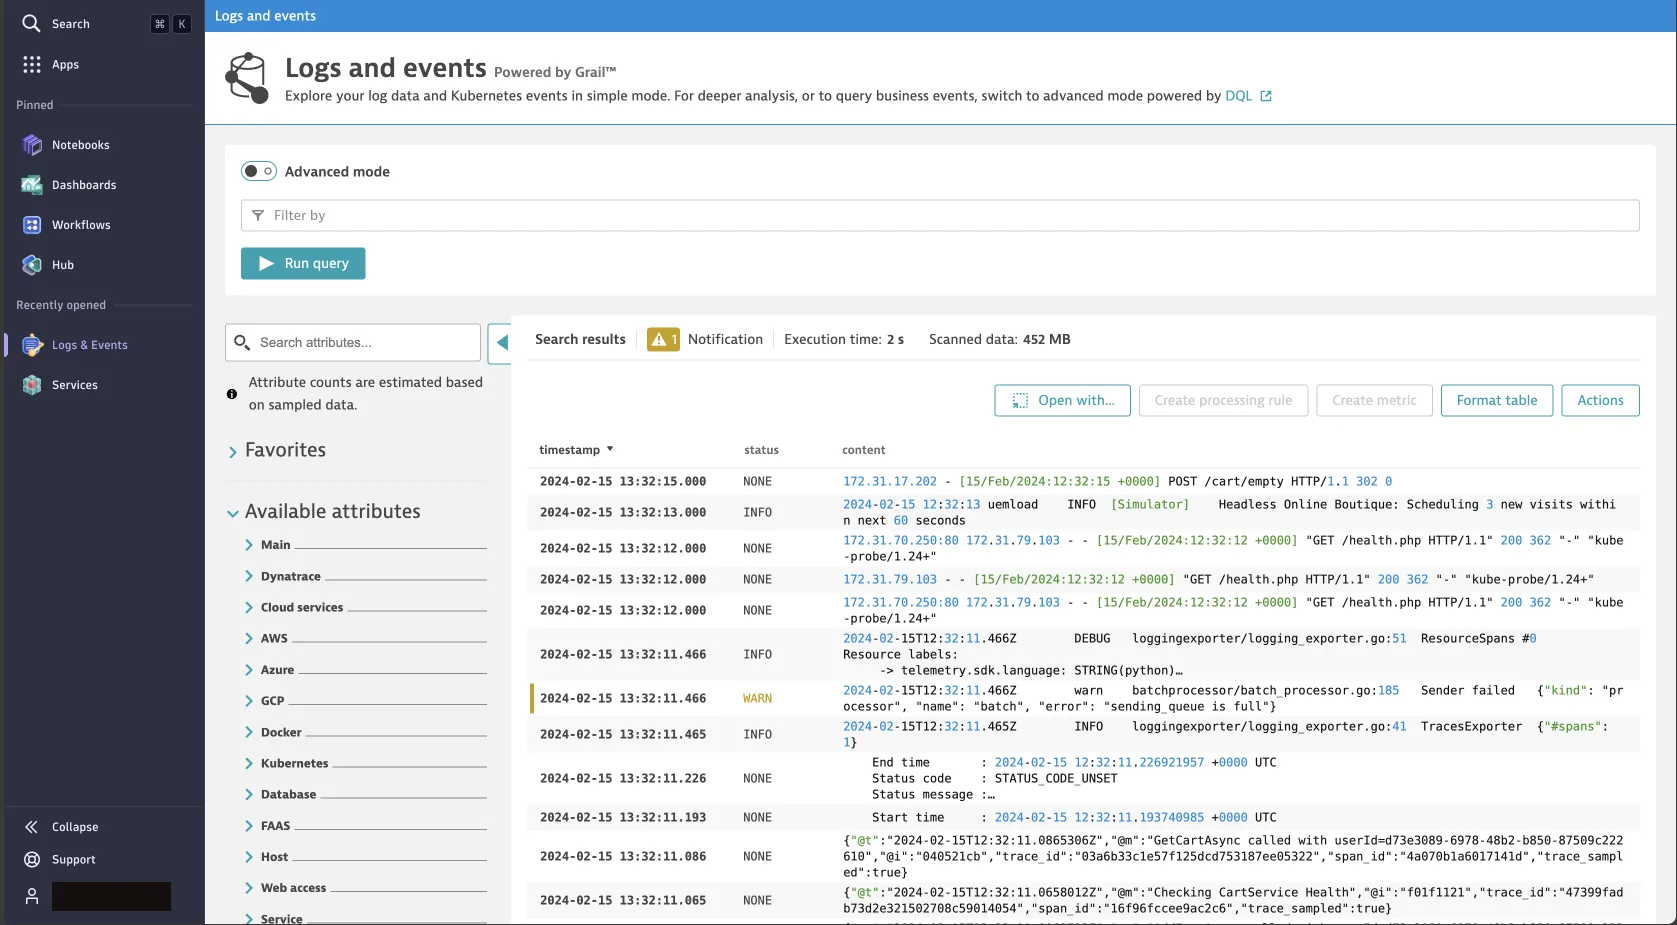
Dynatrace
Log management in Dynatrace is being powered by Grail, a powerful tool designed to manage log data efficiently without requiring schemas or indexing, which means that users can easily manage large amounts of log data, without the need for complex setup or manual intervention. Once I deployed the OneAgent on my host machine, it automatically ingested my log data into Dynatrace.
Dyntrace allows users to define custom log ingestion rules with OneAgent and control the retention of log data by placing it into designated data retention buckets. Storing log data in buckets improves query performance by reducing query execution time and the scope of data read.
If require a platform that can aggregate and analyze large log volumes from various sources, Splunk is the better choice. If you have less log management requirement, you can consider Dynatrace.
Application Security: Splunk
Splunk
Splunk has a range of security products that provide comprehensive insights into application security threats and vulnerabilities. It enables organizations to identify, investigate, and mitigate security risks in real-time, ensuring the protection of sensitive data and the integrity of applications.
Here’s what some of Splunk’s security products can do:
- The Splunk Security Essentials app provided me with a consolidated, real-time view of my entire system to detect threats.
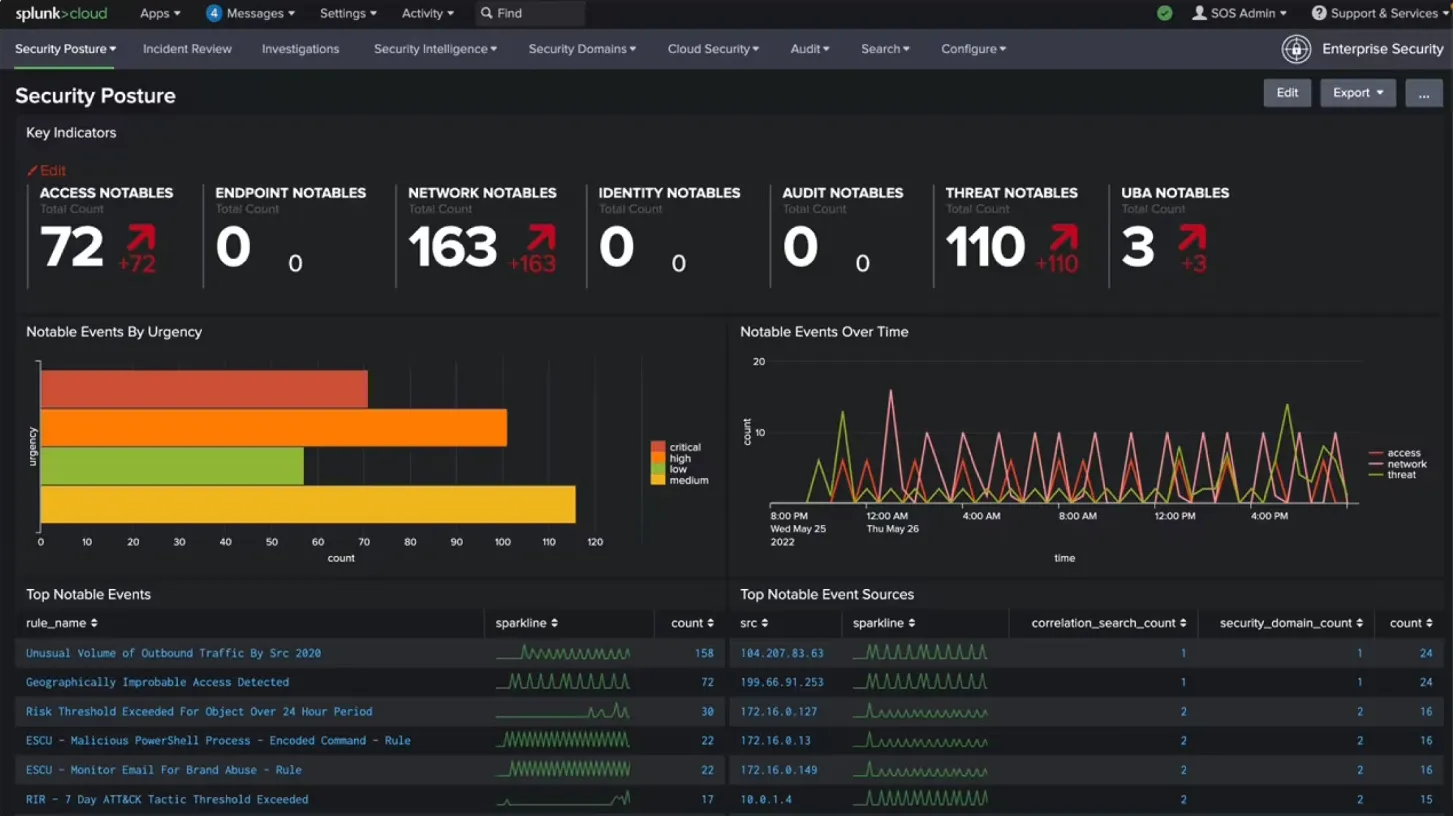
- The Splunk Enterprise Security tool allows users to understand their organization's security posture. It also identifies potential security risks by analyzing diverse data sources and recognizing suspicious patterns indicative of attacks.
- The Splunk attack analyzer helps to discover and investigate cyber-attacks and threats. It also provides information on how they can be rectified.
Dynatrace
Dyntrace uses its AI engine to protect applications and understand the security posture of your environment in real-time. This AI engine automatically assessed the risks in my application and provided me with remediation strategies. It can also detect and block threats, simplifying security analysis across all data in an environment.
If you require complete security of your entire environments and applications, Splunk is a better option as it provides different robust security products for different use cases.
Pricing: Dynatrace
Splunk
Splunk’s pricing model is complex and expensive. You get a 15-day free trial period after which you have to pay to keep using Splunk.
Splunk provides several pricing options, including workload Pricing, entity Pricing, ingest Pricing, and activity-based pricing, each tailored to different aspects of data usage and business requirements. The actual price of using Splunk is not explicitly stated on the Splunk website and so, users need to contact the sales team.
Dynatrace
Dynatrace is also expensive to use but can be less expensive in contrast to Splunk. You also get a 15-day free trial period after which payment is required.
Dynatrace uses a consumption-based pricing approach where users are billed based on the number of monitored hosts, This is more predictable compared to Splunk's data ingest-based pricing where costs can escalate significantly with the volume of data ingested, leading to potentially higher costs for organizations with large volumes of log data.
For organizations with smaller workloads or less extensive data management needs, Dynatrace offers a more cost-effective solution due to its all-in-one platform approach.
AI-Driven Analytics: Dynatrace
Splunk
Splunk performs AI-driven analytics by embedding machine learning (ML), generative AI, and customizable ML tools within the Splunk platform. Together, they help to enhance the security, and observability of applications and services, detect anomalies using powerful machine learning algorithms, and get new users up to speed using generative AI.
Dynatrace
The Davis AI engine is what powers AI-driven analytics in Dynatrace. It allows Dynatrace to monitor complex systems, automatically finding and fixing performance problems and anomalies from apps to infrastructure. It combines real-time metrics, traces, and logs to give clear insights and find the cause of issues, helping teams improve performance and keep services running smoothly before they affect customers.
Generally, Dynatrace has better AI-driven analytics.
Splunk vs Dynatrace: Final Verdict
Here's a use-case-based guide to help you determine when to utilize Splunk and Dynatrace:
- If you require comprehensive APM capabilities with end-to-end monitoring, choose Dynatrace.
- If you need to manage large log data volumes, choose Splunk.
- If you need a platform with impressive AI-driven analytics, choose Dynatrace.
- If you require complete security of your entire infrastructure and applications, choose Splunk.
- If you want a platform that is easy to get started with, choose New Relic.
SigNoz: A better Splunk and Dynatrace alternative
While Splunk and Dynatrace are good monitoring tools, it is possible they may not fit your organization's use case. A good alternative for both tools you can consider is SigNoz.
SigNoz is a comprehensive, full-stack observability and monitoring platform designed to offer deep insights into your infrastructure and applications. It efficiently generates the essential telemetry data required for monitoring your systems - Metrics, Logs, and Traces, in a single pane of glass.
Here are some notable features of SigNoz:
- It is available both as an open-source software and a cloud offering.
- It’s OpenTelemetry-native, so you can use any backend of your choice.
- SigNoz is cost-effective. There is no hidden or special pricing for custom metrics, and no user-based or host-based pricing, compared to other monitoring tools. With SigNoz, you only pay for what you use.
- It has a very intuitive UI, allows for the creation of custom dashboards, and is very easy to get started with.
- It uses Clickhouse as its underlying database so you can run queries fast, and quickly ingest, analyze, and aggregate data.
Getting Started with SigNoz
SigNoz Cloud is the easiest way to run SigNoz. Sign up for a free account and get 30 days of unlimited access to all features.

You can also install and self-host SigNoz yourself since it is open-source. With 24,000+ GitHub stars, open-source SigNoz is loved by developers. Find the instructions to self-host SigNoz.
Further Reading:
Top 11 Splunk Alternatives in 2024 [Includes Free & Open-Source Tools]
