A Trace-based alert in SigNoz allows you to define conditions based on trace data, triggering alerts when these conditions are met. You can define your trace query using Query Builder or ClickHouse queries.
This page covers the configuration options available for Trace-based alerts — from defining the trace query to setting conditions and notification preferences.
At the top of the alert creation page, you can set:
- Alert Name: A field to name the alert for easy identification.
- Labels: Add static labels or tags for categorization. Labels should be added in key-value pairs. First enter key (avoid space in key) and set value.
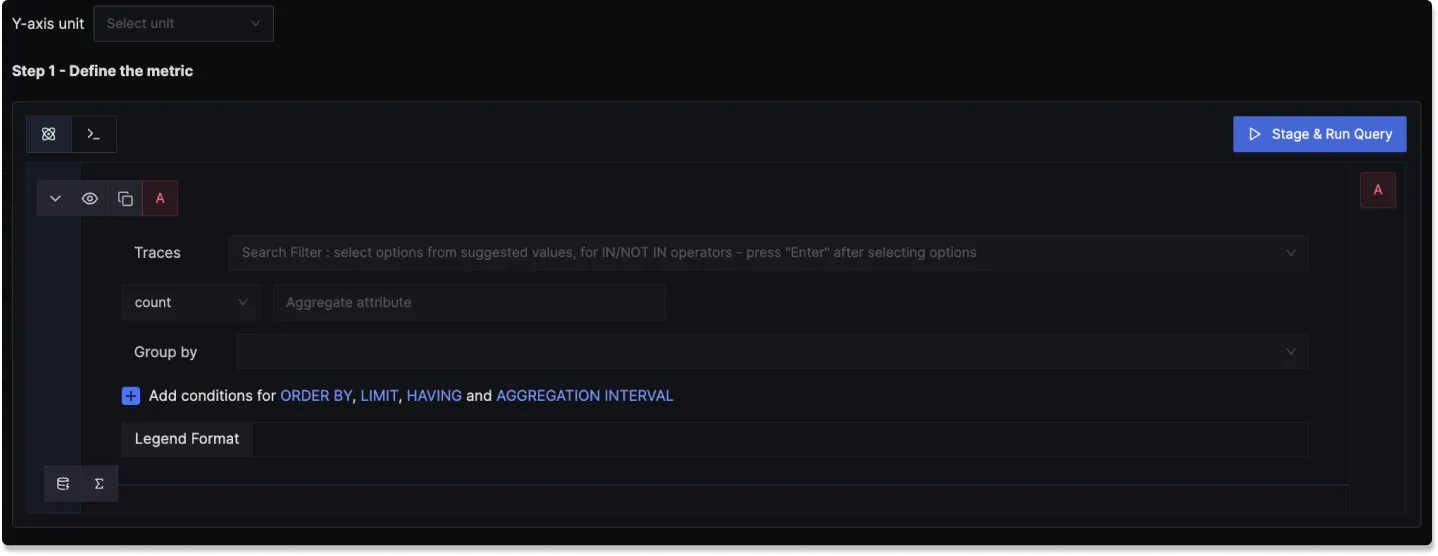
Step 1: Define the Trace Metric
In this step, you use the Traces Query Builder to perform operations on your Traces to define conditions based on traces data. The following fields are available:
Filter: Write a filter expression to search your traces (e.g.,
service.name = 'frontend' AND http.status_code >= 500). Select the span scope (All Spans,Root Spans, etc.) from the dropdown.Aggregate Attribute: Select how the trace data should be aggregated. You can use functions like
count(),p90(duration_nano),avg(duration_nano), etc.Group By: Group trace data by different span/trace attributes, like
serviceName,status, or other custom attributes.Legend Format: An optional field to define the format for the legend in the visual representation of the alert.
Having: Apply conditions to filter the results further based on aggregate value.
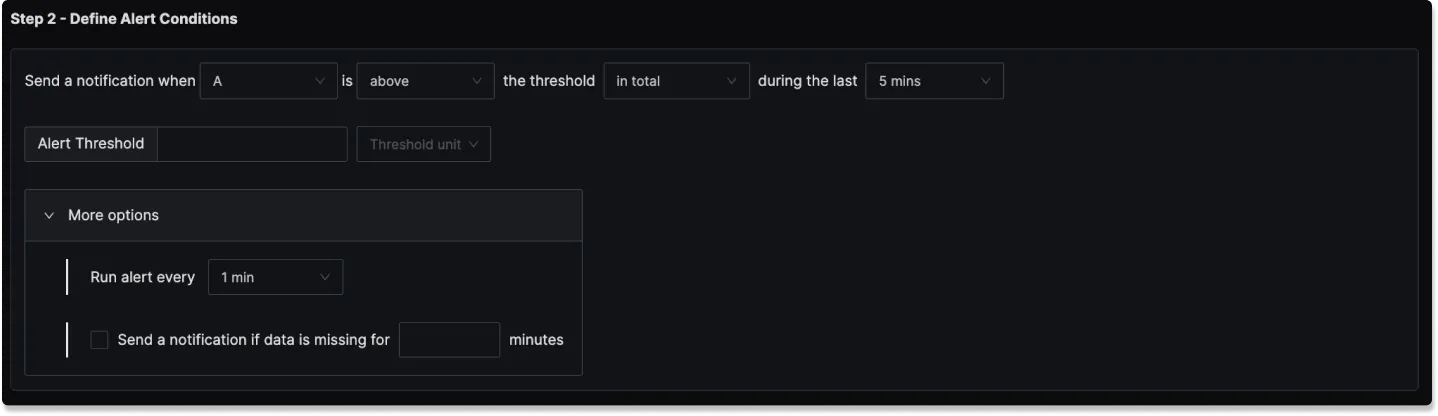
Step 2: Define Alert Conditions
In this step, you define the specific conditions for triggering the alert, as well as the frequency of checking those conditions. The condition configuration of an alert in SigNoz consists of these core parts:
Query
An alert can consist of multiple queries and formulas. But only 1 of them can be put into consideration while determining the alert condition.
You can define one or more queries or formulas to fetch the data you want to evaluate. However, only one of them can be used as the trigger for the alert condition.
For example:
A= Total request countB= Total error countC=B / A(Error rate)
You can use query C as the evaluation target to trigger alerts based on error rate.
Condition
This defines the logical condition to check against the selected query's value.
| Operator | Description | Example Usage |
|---|---|---|
Above | Triggers if the value is greater than | CPU usage Above 90 (%) |
Below | Triggers if the value is less than | Apdex score Below 0.8 |
Equal to | Triggers if the value is exactly equal | Request count Equal to 0 |
Not equal to | Triggers if the value is not equal | Instance status Not Equal to 1 |
Match Type
Specifies how the condition must hold over the evaluation window. This allows for flexible evaluation logic.
| Match Type | Description | Example Use Case |
|---|---|---|
at least once | Trigger if condition matches even once in the window | Detect spikes or brief failures |
all the times | Trigger only if condition matches at all points in the window | Ensure stable violations before alerting |
on average | Evaluate the average value in the window | Average latency Above 500ms |
in total | Evaluate the total sum over the window | Total errors Above 100 |
last | Only the last data point is evaluated | Used when only latest status matters |
Evaluation Window
Specifies the time window and mode for evaluating the condition. You can choose between two modes:
- Rolling: Monitors data over a fixed time period that moves forward continuously. For example, a 5-minute rolling window with 1-minute evaluation cadence checks continuously: 14:01:00–14:06:00, 14:02:00–14:07:00, etc.
- Cumulative: Monitors data accumulated since a fixed starting point. The window grows over time, keeping all historical data from the start.
Both modes support preset timeframes (Last 5 minutes, Last 10 minutes, Last 15 minutes, Last 30 minutes, Last 1 hour, Last 2 hours, Last 4 hours) as well as a Custom time range for specific requirements.
Threshold
This is the value you are comparing the query result against.
e.g. If you choose Condition = Above and set Threshold = 500, the alert will fire when the query result exceeds 500.
Threshold Unit
Specifies the unit of the threshold, such as:
- ms (milliseconds) for latency
- % for CPU usage
- Count for request totals
Helps interpret the threshold in the correct context and also for correct scaling while comparing 2 values.
Notification Channels
Choose the notification channels to send alerts to from those configured in Settings > Account Settings > Notification Channels. You can select multiple channels per threshold.
Advanced Options
Under the Advanced Options section, you can configure:
How often to check: How frequently SigNoz evaluates the alert condition. Default is every 1 minute.
Alert when data stops coming: Send a notification if no data is received for a specified time period. Useful for services where consistent data is expected.
Minimum data required: Only trigger the alert when there are enough data points to make a reliable decision. Helps avoid false alerts due to missing or sparse data.
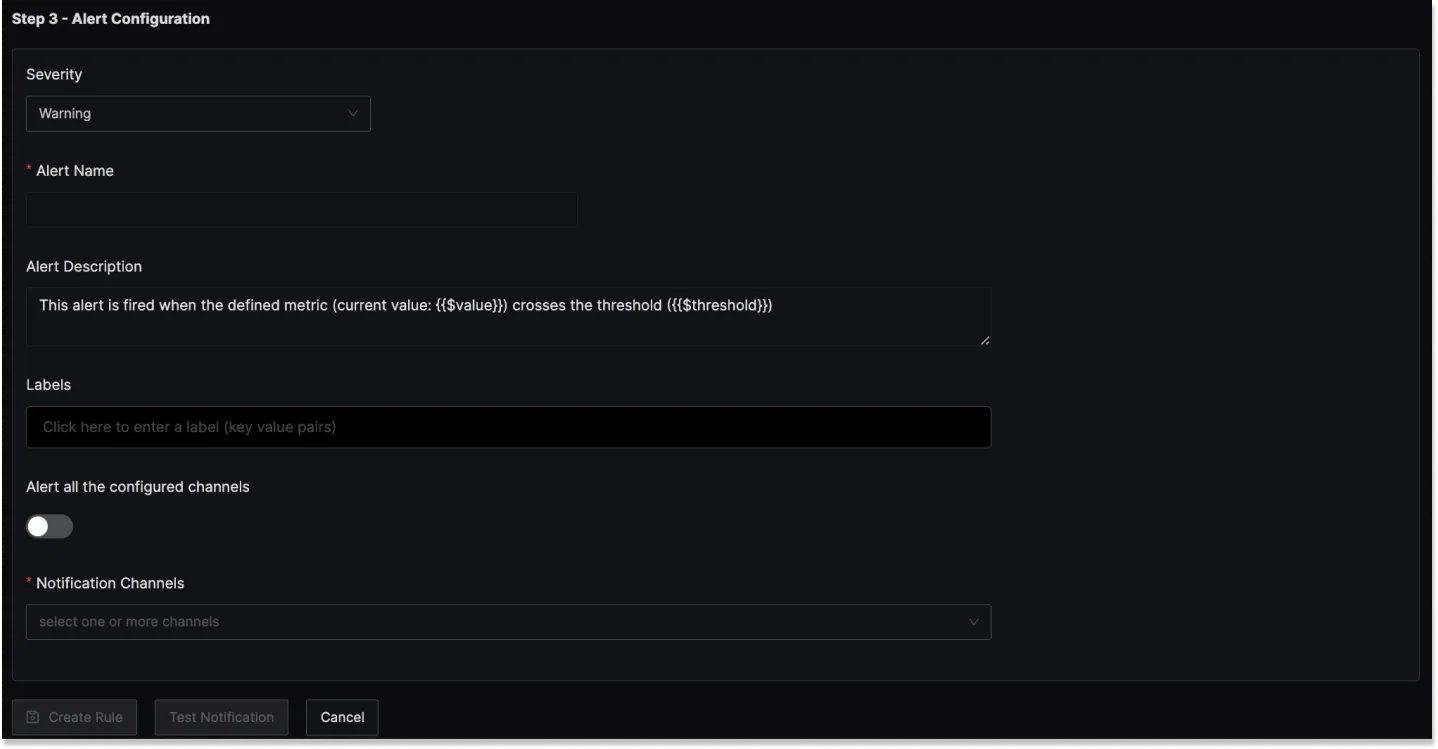
Step 3: Notification Settings
In this step, you configure how alert notifications are delivered:
Notification Message
Custom message content for alert notifications. Use template variables to include dynamic information. The default template includes the current value and threshold.
You can incorporate result attributes in the alert message to make notifications more informative:
Syntax: Use $<attribute-name> to insert attribute values. Attribute values can be any attribute used in group by.
Example: If you have a query that has the attribute service.name in the group by clause then to use it in the notification message, you will use $service.name.
Using advanced Slack formatting is supported if you are using Slack as a notification channel.
Group alerts by
Combine alerts with the same field values into a single notification. Select fields to group by (optional). When empty, all matching alerts are combined into one notification.
Repeat Notifications
Configure repeat notifications to retrigger alerts at specified intervals if they remain unresolved. To enable:
- Scroll to the bottom of the alert configuration
- Enable the Repeat Notification toggle
- Set your desired interval
- Configure the condition:
- Firing: Send repeat notifications when the alert is actively firing
- No Data: Send repeat notifications when no data is received

Test Notification
Click the Test Notification button at the bottom of the page to send a test alert to the configured notification channels. This verifies that your alert pipeline is working correctly before saving.
Examples
1. Alert when external API latency (P90) is over 1 second for last 5 mins
Here's a video tutorial for creating this alert:
Step 1: Write Query Builder query to define alert metric
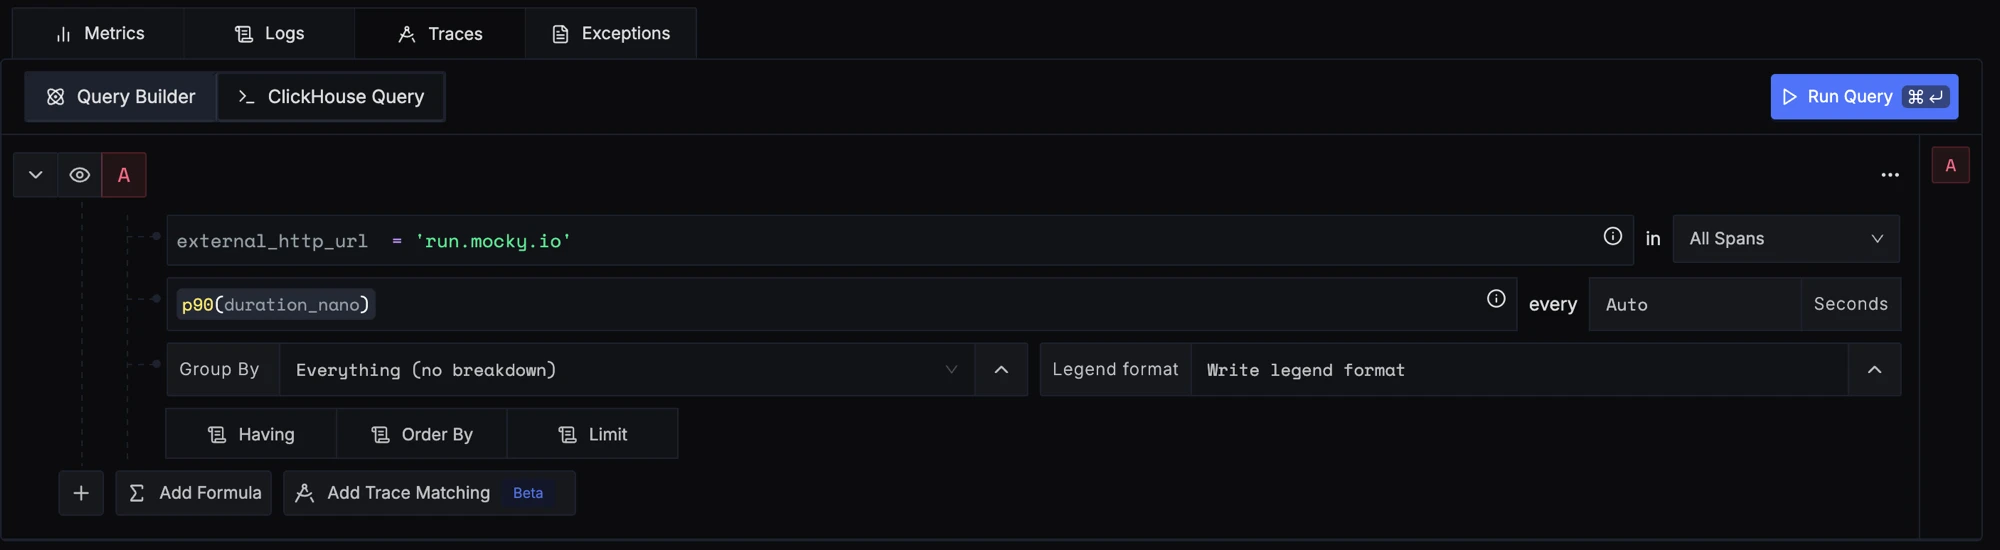
Using the external_http_url attribute we filter for a specific external API endpoint and then set the aggregation attribute to duration_nano with P90 aggregation operation to plot a chart which measures 90th percentile latency. You can also choose Avg or any other operation as aggregate operation depending on your needs.
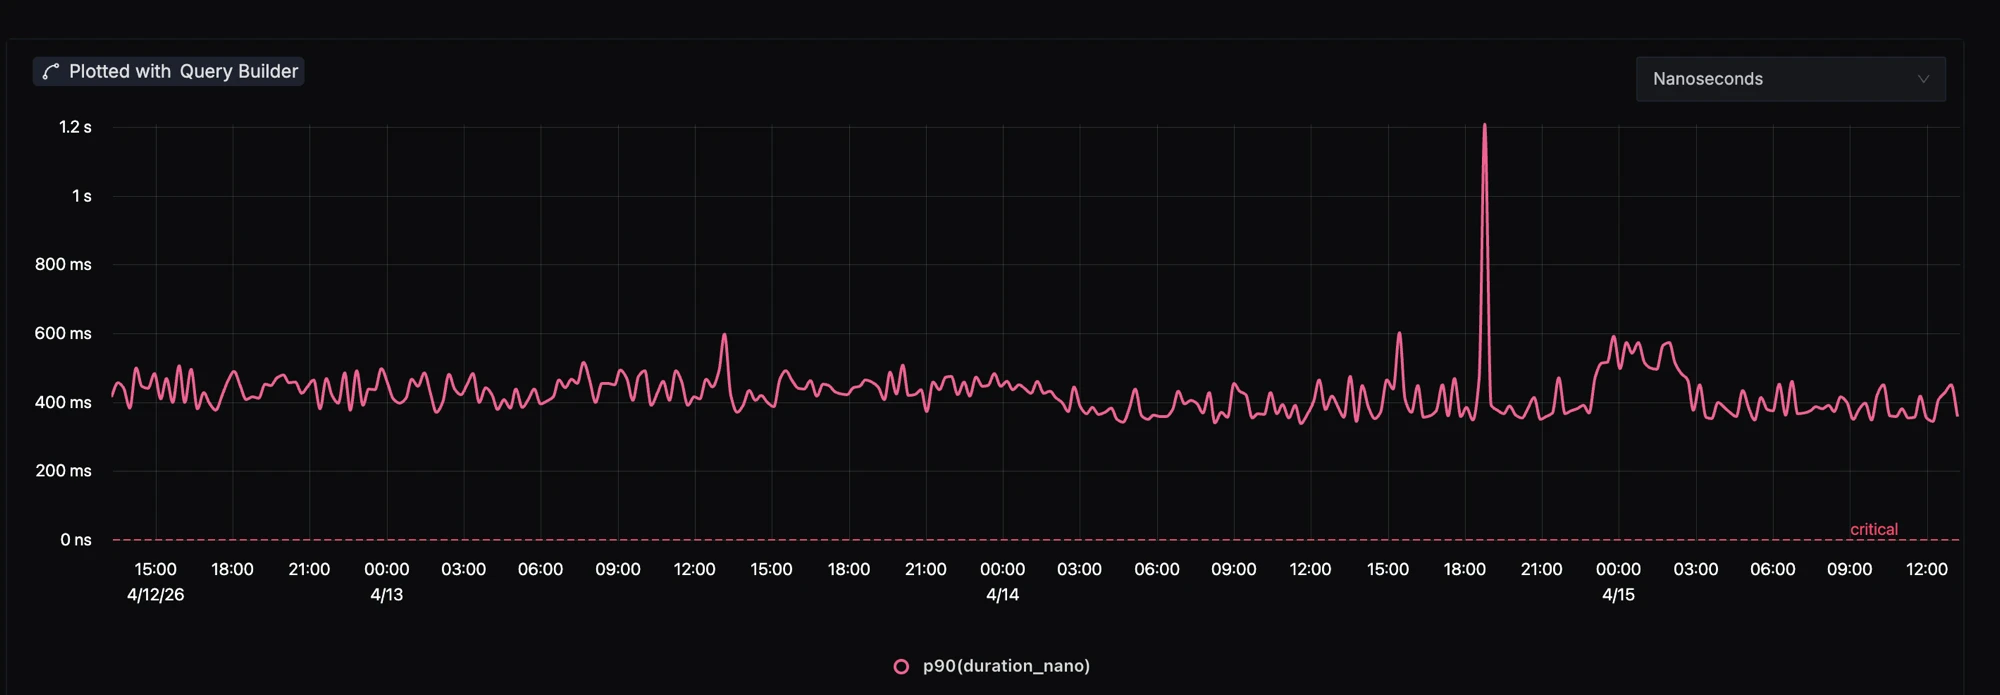
Remember to select y-axis unit as nanoseconds as our aggregate key is durationNano.
Step 2: Set alert conditions
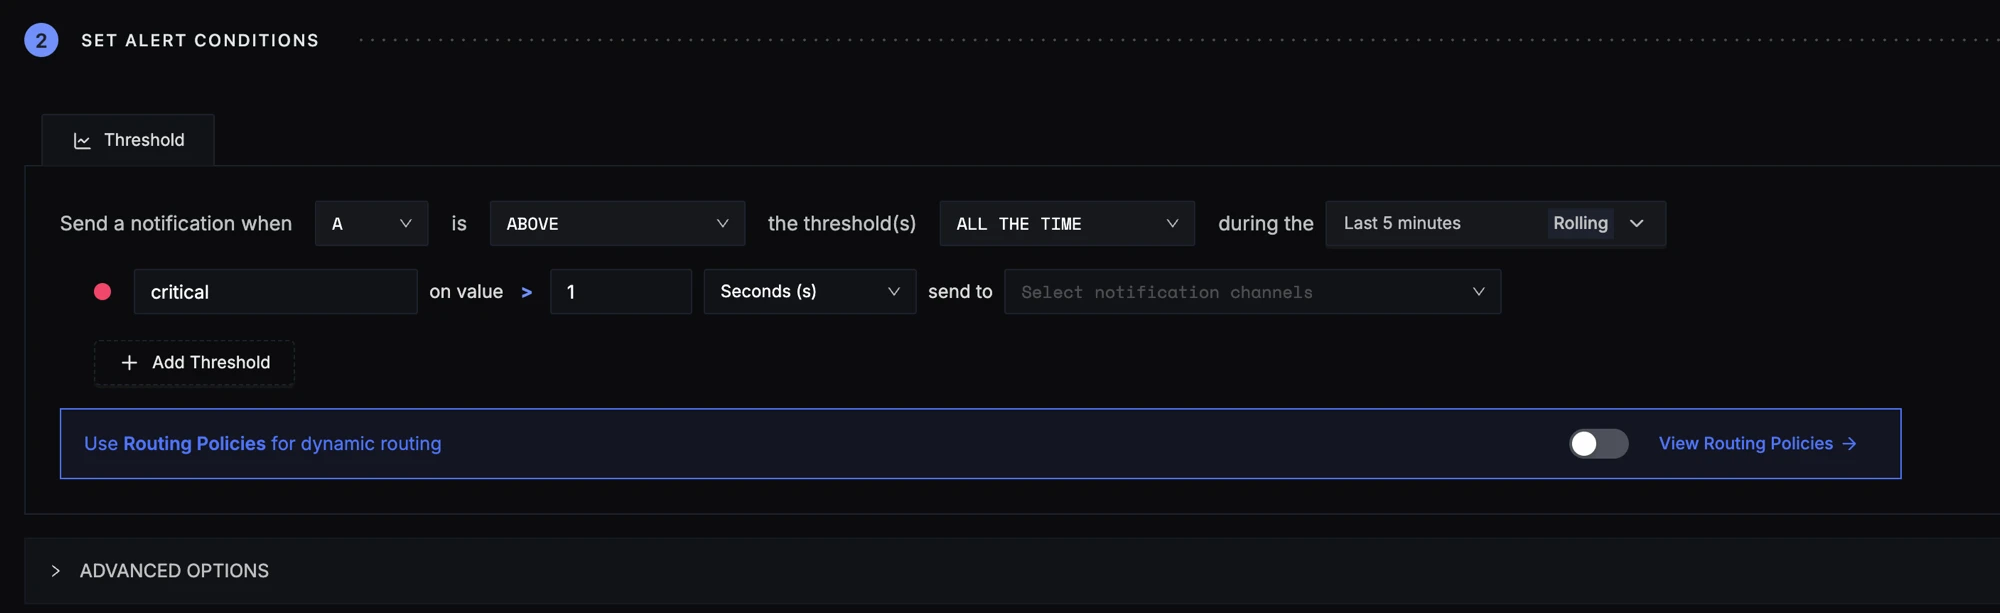
The condition is set to trigger a notification if the per-minute external API latency (P90) exceeds the threshold of 1 second all the time in the last five minutes.
Step 3: Set alert configuration
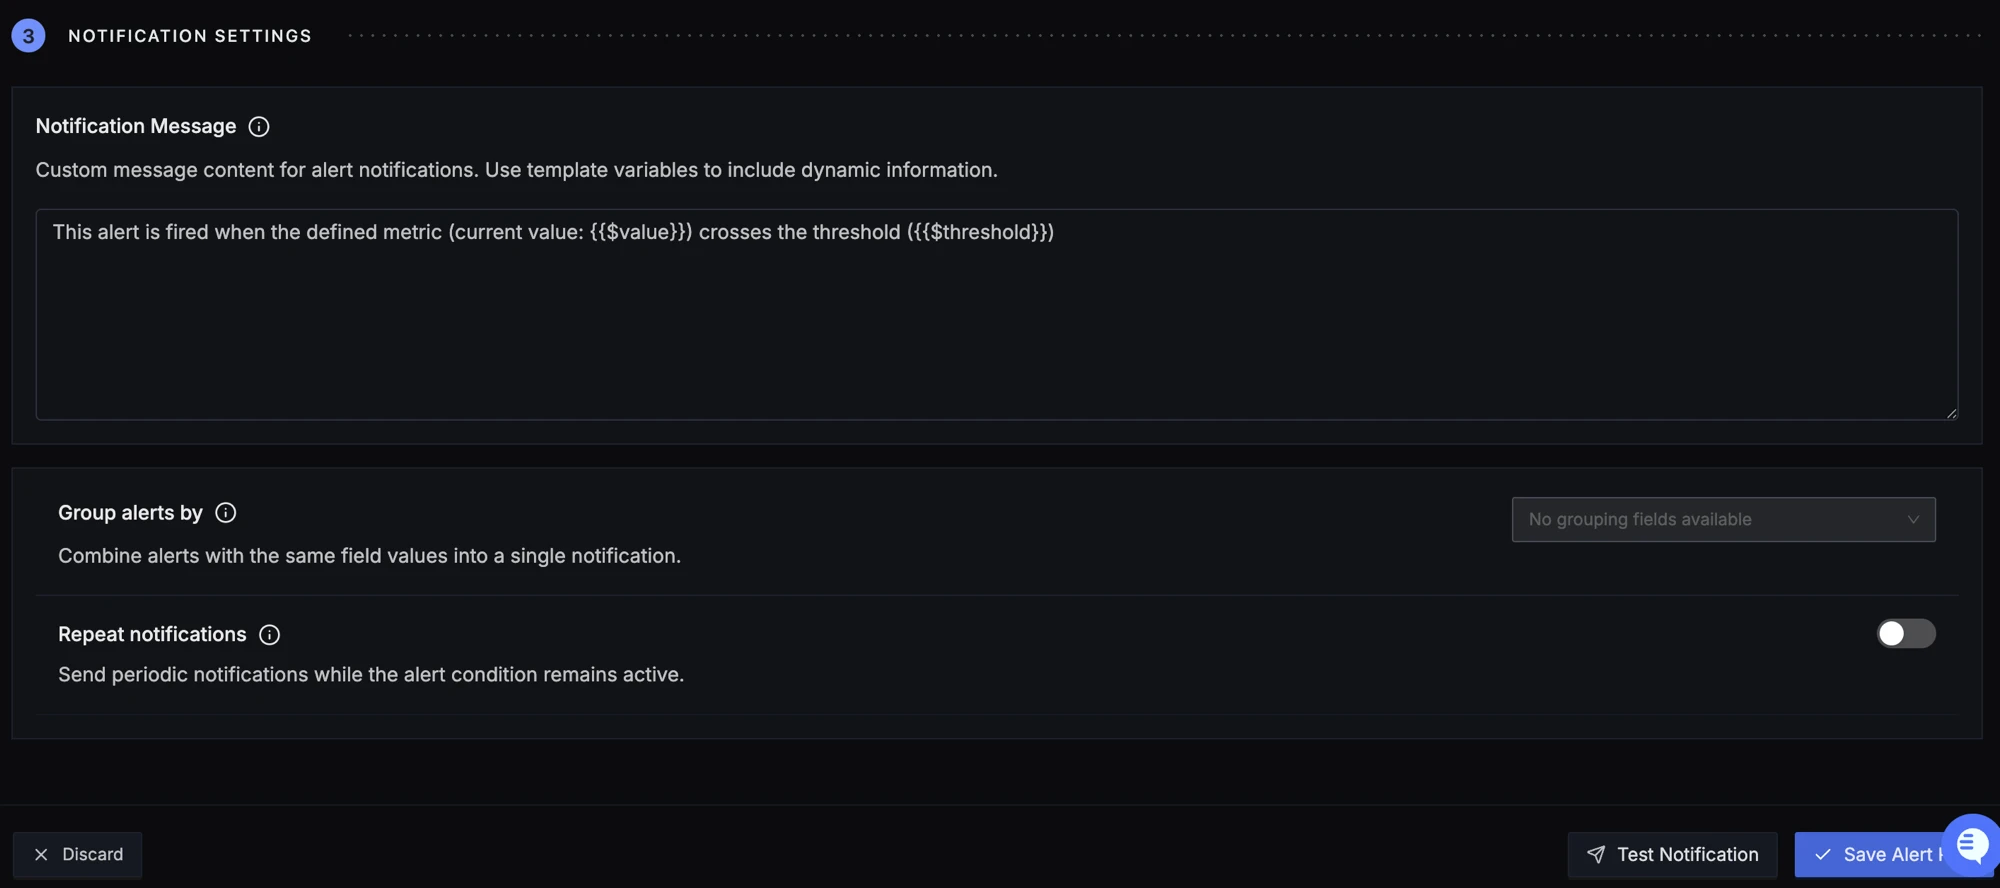
Configure the notification message, group alerts by, and repeat notifications as needed.
