Overview
Setting up a centralised OpenTelemetry Collector offers several benefits for managing observability data in Azure environments. It allows for a clear separation between platform and application teams, reduces configuration overhead for application teams, and enables the collection of system metrics from Azure Monitor and observability data from Azure Event Hub.
This guide will walk you through the process of creating a centralized OpenTelemetry Collector using Azure Kubernetes Service (AKS) or an Azure Virtual Machine (VM).
Prerequisites
Before proceeding with the setup, ensure you have the following prerequisites:
- An active Azure subscription
- Azure CLI installed on your local machine
- EventHub Setup
- SigNoz Cloud Account
Setting Up the OpenTelemetry Collector
Deploying the OpenTelemetry Collector can be approached in two distinct ways, depending on your infrastructure:
- Utilizing OpenTelemetry Helm Charts: Ideal for those with an existing Kubernetes infrastructure.
- Running the Collector on a Virtual Machine: For users not using Kubernetes and relying on serverless environments for their workloads.
Setup
Installing with OpenTelemetry Helm Charts
Prior to installation, you must ensure your Kubernetes cluster is ready and that you have the necessary permissions to deploy applications. Follow these steps to use Helm for setting up the Collector:
-
Add the OpenTelemetry Helm repository:
helm repo add open-telemetry https://open-telemetry.github.io/opentelemetry-helm-charts -
Prepare the
otel-collector-values.yamlConfigurationAzure Event Hub Receiver Configuration
If you haven't created the logs Event Hub, you can create one by following the steps in the Azure Event Hubs documentation.
and replace the placeholders
<Primary Connection String>with the primary connection string for your Event Hub, it should look something like this:connection: Endpoint=sb://namespace.servicebus.windows.net/;SharedAccessKeyName=RootManageSharedAccessKey;SharedAccessKey=superSecret1234=;EntityPath=hubNameThe Event Hub docs have a step to create a SAS policy for the event hub and copy the connection string.
Azure Monitor Receiver Configuration
You will need to set up a service principal with Read permissions to receive data from Azure Monitor.
-
Follow the steps in the Create a service principal Azure Doc documentation to create a service principal. You can name it
signoz-central-collector-appthe redirect URI can be empty. -
To add read permissions to Azure Monitor, Follow the Assign Role documentation. The read acess can be given to the full subscription.
-
There are multiple ways to authenticate the service principal, we will use the client secret option, follow Creating a client secret and don't forget to copy the client secret. The secret is used in the configuration file as
client_secret. -
To find
client_idandtenant_id, go to the Azure Portal and search for theApplicationyou created. You would see theApplication (client) IDandDirectory (tenant) IDin the Overview section.
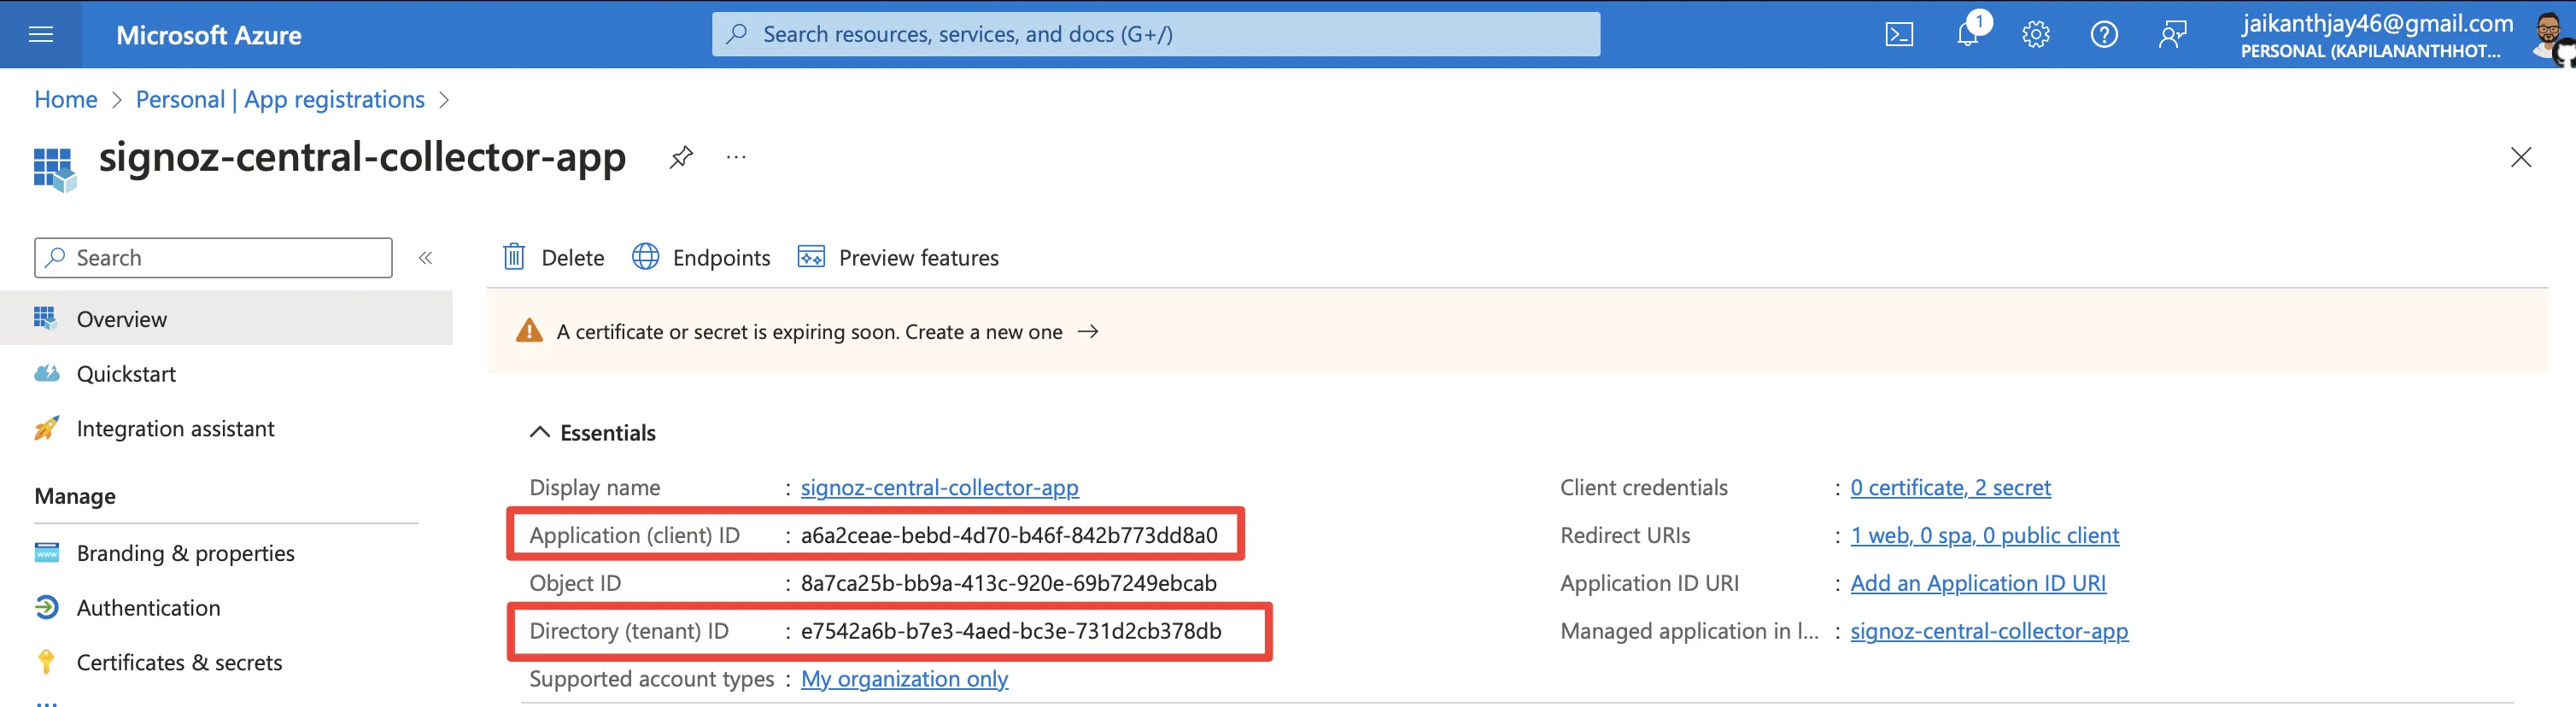
Application Overview
-
To find
subscription_id, follow steps in Find Your Subscription and populate them in the configuration file. -
Ensure you replace the placeholders
<region>and<ingestion-key>with the appropriate values for your signoz cloud instance.
-
Below is an example targeting the SigNoz backend with Azure Monitor receivers configured:
service:
  pipelines:
    metrics/am:
      receivers: [azuremonitor]
      exporters: [otlp]
    traces:
      receivers: [otlp]
      processors: [batch]
      exporters: [otlp]
    metrics:
      receivers: [otlp]
      processors: [batch]
      exporters: [otlp]
    logs:
      receivers: [otlp]
      processors: [batch]
      exporters: [otlp]
    logs/azure:
      receivers: [azureeventhub]
      processors: [resource/azure, batch]
      exporters: [otlp]

receivers:
  otlp:
    protocols:
      grpc:
        endpoint: 0.0.0.0:4317
      http:
        endpoint: 0.0.0.0:4318
  azureeventhub:
    connection: Endpoint=sb://namespace.servicebus.windows.net/;SharedAccessKeyName=RootManageSharedAccessKey;SharedAccessKey=superSecret1234=;EntityPath=hubName
    format: "azure"
    apply_semantic_conventions: true
  azuremonitor:
    subscription_id: "<Subscription ID>"
    tenant_id: "<AD Tenant ID>"
    client_id: "<Client ID>"
    client_secret: "<Client Secret>"
    resource_groups: ["<rg-1>"]
    collection_interval: 60s

processors:
  batch: {}
  resource/azure:
    attributes:
      - key: source_type
        value: "azureeventhub"
        action: upsert

exporters:
  otlp:
    endpoint: "ingest.<region>.signoz.cloud:443"
    tls:
      insecure: false
    headers:
      "signoz-ingestion-key": "<ingestion-key>"
-
Deploy the OpenTelemetry Collector to your Kubernetes cluster:
You'll need to prepare a custom configuration file, say
otel-collector-values.yaml, that matches your environment's specific needs. Replace<namespace>with the Kubernetes namespace where you wish to install the Collector.helm install -n <namespace> --create-namespace otel-collector open-telemetry/opentelemetry-collector -f otel-collector-values.yamlFor more detail, refer to the official OpenTelemetry Helm Chart documentation, which offers comprehensive installation instructions and configuration options tailored to your environment's requirements.
Running the Collector on a Virtual Machine
If you're not using Kubernetes, setting up the OpenTelemetry Collector on a Virtual Machine (VM) is a straightforward alternative. This setup is compatible with cloud VM instances, your own data center, or even a local VM on your development machine. Here's how to do it:
-
Download and Install the OpenTelemetry Collector Binary:
Please visit Documentation For VM which provides further guidance on a VM installation.
It's prudent to check available resources to ensure you're following the latest practices and utilizing updated features offered by OpenTelemetry. Follow the documentation to setup your collector and test the setup.
-
Configure the OpenTelemetry Collector:
The Collector requires configuration before it can start receiving Azure Monitor data. Create a file named
config.yamland populate it with the necessary configuration details. This file should be configured to fit your specific environment's requirements. For instance, you may want to setup receivers for the telemetry data you expect to collect and processors to handle that data appropriately, as well as exporters to send the data to your desired backend, like SigNoz, Jaeger, or Prometheus.Below is a basic configuration example:
service:
  pipelines:
    metrics/am:
      receivers: [azuremonitor]
      exporters: [otlp]
    traces:
      receivers: [otlp]
      processors: [batch]
      exporters: [otlp]
    metrics:
      receivers: [otlp]
      processors: [batch]
      exporters: [otlp]
    logs:
      receivers: [otlp]
      processors: [batch]
      exporters: [otlp]
    logs/azure:
      receivers: [azureeventhub]
      processors: [resource/azure, batch]
      exporters: [otlp]
  receivers:
    otlp:
      protocols:
        grpc:
          endpoint: 0.0.0.0:4317
        http:
          endpoint: 0.0.0.0:4318
    azureeventhub:
      connection: <Primary Connection String>
      format: "azure"
      apply_semantic_conventions: true
    azuremonitor:
      subscription_id: "<Subscription ID>"
      tenant_id: "<AD Tenant ID>"
      client_id: "<Client ID>"
      client_secret: "<Client Secret>"
      resource_groups: ["<rg-1>"]
      collection_interval: 60s
  processors:
    batch: {}
    resource/azure:
      attributes:
        - key: source_type
          value: "azureeventhub"
          action: upsert
  exporters:
    otlp:
      endpoint: "ingest.<region>.signoz.cloud:443"
      tls:
        insecure: false
      headers:
        "signoz-ingestion-key": "<ingestion-key>"
Azure Event Hub Receiver Configuration
If you haven't created the logs Event Hub, you can create one by following the steps in the Azure Event Hubs documentation.
and replace the placeholders
<Primary Connection String>with the primary connection string for your Event Hub, it should look something like this:connection: Endpoint=sb://namespace.servicebus.windows.net/;SharedAccessKeyName=RootManageSharedAccessKey;SharedAccessKey=superSecret1234=;EntityPath=hubNameThe Event Hub docs have a step to create a SAS policy for the event hub and copy the connection string.
Azure Monitor Receiver Configuration
You will need to set up a service principal with Read permissions to receive data from Azure Monitor.
-
Follow the steps in the Create a service principal Azure Doc documentation to create a service principal. You can name it
signoz-central-collector-appthe redirect URI can be empty. -
To add read permissions to Azure Monitor, Follow the Assign Role documentation. The read acess can be given to the full subscription.
-
There are multiple ways to authenticate the service principal, we will use the client secret option, follow Creating a client secret and don't forget to copy the client secret. The secret is used in the configuration file as
client_secret. -
To find
client_idandtenant_id, go to the Azure Portal and search for theApplicationyou created. You would see theApplication (client) IDandDirectory (tenant) IDin the Overview section.
Application Overview
-
To find
subscription_id, follow steps in Find Your Subscription and populate them in the configuration file. -
Ensure you replace the placeholders
<region>and<ingestion-key>with the appropriate values for your signoz cloud instance.
-
-
Run the Collector:
With your configuration file ready, you can now start the Collector using the following command:
# Runs in background with the configuration we just created ./otelcol-contrib --config ./config.yaml &> otelcol-output.log & echo "$!" > otel-pid -
Open Ports:
You will need to open the following ports on your Azure VM:
- 4317 for gRPC
- 4318 for HTTP
You can do this by navigating to the Azure VM's Networking section and adding a new inbound rule for the ports.
-
Validating the Deployment:
Once the Collector is running, ensure that telemetry data is being successfully sent and received. Use the logging exporter as defined in your configuration file, or check the logs for any startup errors.
Configure DNS label For Collector
To the IP address of the collector, you can add a DNS label to the Public IP address. This will make it easier to refer to the centralized collector from other services. You can do this by following these steps:
- Go to the Public IP address of the collector. This would be the IP address of the VM or Load Balancer in case of Kubernetes or Load Balanced collector.
- Click on the "Configuration" tab.
- Enter the DNS label you want to use for the collector.
- Click on "Save".
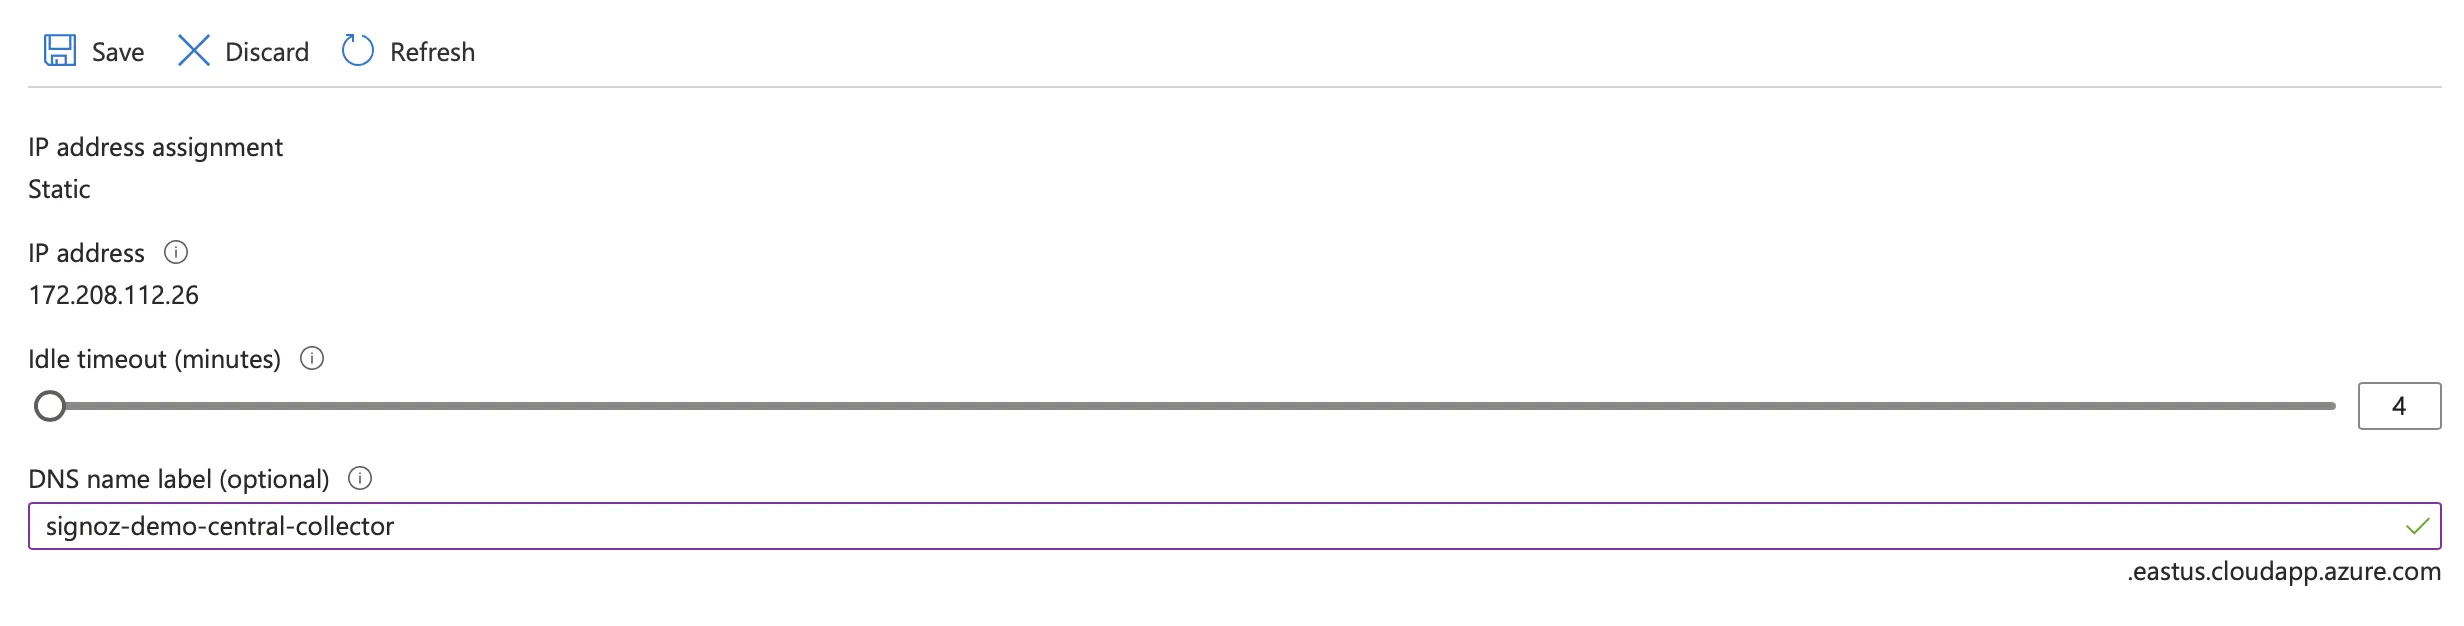
DNS label for collector
Please take note of the DNS label you have entered. You will need to configure this for your other services as well.
In this example, the Central Collector DNS Name is signoz-demo-central-collector.eastus.cloudapp.azure.com.
If you're using kubernetes, you probably have ExternalDNS configured and you can use that to set up DNS name for your collector as well.
Troubleshooting
If you encounter any issues during the setup or data collection process, consider the following troubleshooting steps:
- Verify that the OpenTelemetry Collector is running and accessible from the Azure compute services and applications.
- Check the OpenTelemetry Collector logs for any error messages or warnings.
- Ensure that the necessary ports and firewall rules are configured correctly to allow incoming connections to the Collector.
- Verify that the Azure compute services and applications are properly instrumented and configured to send observability data to the Collector endpoint.
- Confirm that the OpenTelemetry Collector is configured to export data to your SigNoz account and that the SigNoz account is accessible.
