Overview
Jenkins is an automation server that enables developers to build, test, and deploy their applications through continuous integration and continuous delivery (CI/CD) pipelines. This document will help you monitor your Jenkins build agents' metrics using SigNoz.
Prerequisites
- Jenkins (>2.479)
- Jenkins pipelines that you want to monitor
- Jenkins OpenTelemetry [plugin] (https://signoz.io/docs/cicd/jenkins/jenkins-tracing/#install-and-configure-jenkins-opentelemetry-plugin) installed
- Administrative access to Jenkins controller
Setup
Step 1: Install OTel agent metrics plugin
- For installing the plugin, please refer to this documentation
Step 2: Agent node configuration
Setup the executable source on the Jenkins Agent Nodes
In order for this plugin to work 2 executables are run on the agents otel-contrib and node_exporter
The binaries(depending on the Agent OS amd64/arm64) can be installed on the agents using any of the below methods
- present on the PATH of the agents
- downloaded from a URL on the agents. For this the global plugin option Artifact download base URL must be configured(refer the image below)
- uploaded from the Jenkins master. For this the executables must be manually stored under the JENKINS_HOME directory in the opentelemetry-agent-metrics subdirectory(subdirectory to be created under JENKINS_HOME of Jenkins Master)
More information about these executables and their setup can be found in this document.
(Optional)Configure OTel agent metrics plugin
This configuration is required only when using Artifact download base URL to fetch the binaries
Now, navigate to Manage Jenkins -> System -> onMonit section
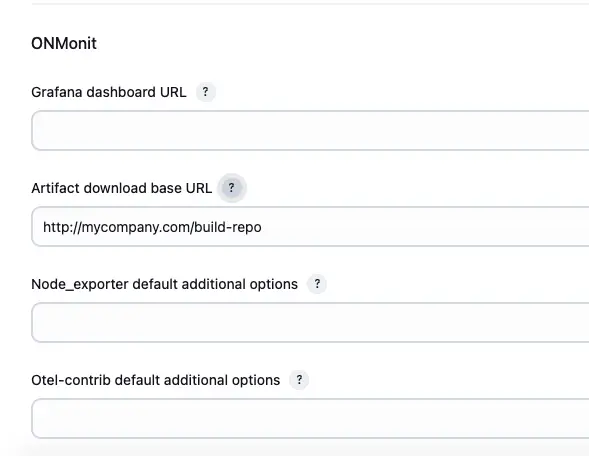
Node agent metrics plugin config
View metrics in SigNoz
To see your metrics, head over to the Metrics Tab in your SigNoz UI and search for your metric.
Image showing all available Jenkins agent metrics under Metrics Tab

Image showing a detailed view of a selected metric jvm_system_cpu_load_1m


