Overview
This integration helps you to monitor and observe Jenkins with OpenTelemetry by visualizing jenkins jobs and pipelines executions as distributed traces in SigNoz To know more about tracing refer here
Prerequisites
- Jenkins [>2.479.3]
- Administrative access to Jenkins controller
Setup
Step 1: Install and Configure Jenkins OpenTelemetry plugin
- For installing the plugin, please refer to this documentation.
Step 2: Set the OTLP Endpoint
Navigate to Manage Jenkins -> System -> OpenTelemetry section
In the OTLP Endpoint section, add your SigNoz ingestion endpoint ingest.<region>.signoz.cloud
Set the <region> to match your SigNoz Cloud region.
Step 3: Set the Authentication headers
In the same section click on Authentication and select Header Authentication
Add Header key as signoz-ingestion-key and create a Jenkins credential of type Secret text and store the SigNoz_Ingestion_Key
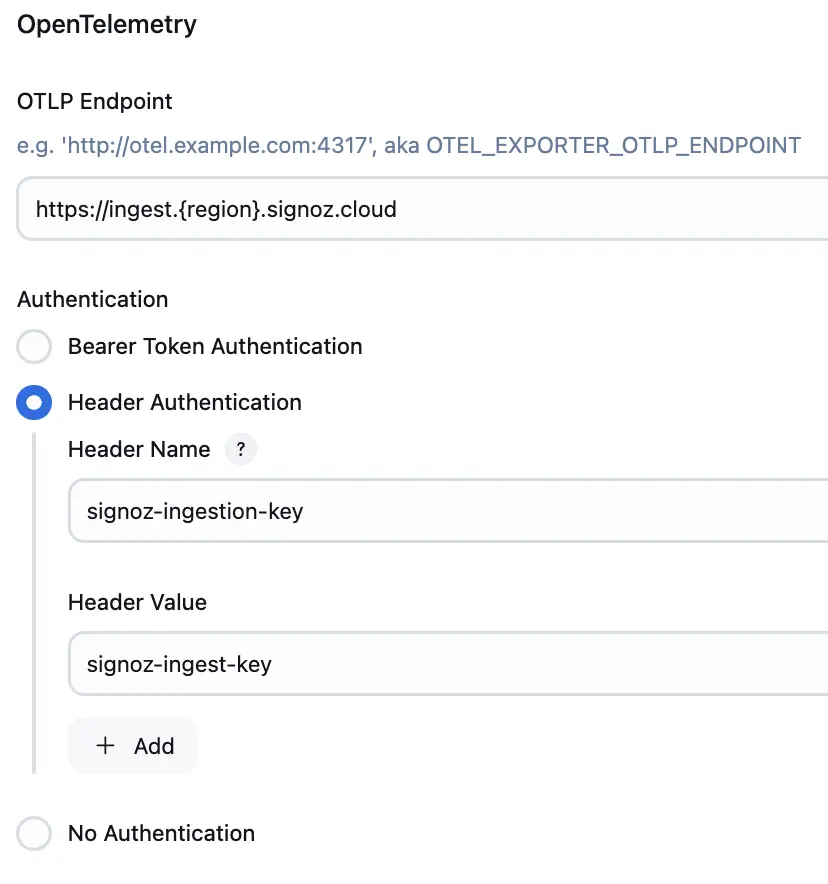
Jenkins OTel plugin configuration for SigNoz Cloud
Now, navigate to Manage Jenkins -> System -> OpenTelemetry section

Enter the Self-Hosted SigNoz endpoint in the OTLP endpoint textbox and set No Authentication
Visualize Traces in SigNoz
In your SigNoz UI, head over to the Traces Tab, and you should be able to see your traces. You can use the trace explorer to filter and analyze your traces.

Custom Spans in Jenkinsfile
With the OTel plugin installed, you can enhance your Jenkins pipelines with custom observability by adding span attributes, creating custom spans, and enriching trace data.
Adding Custom Span Attributes
The following example shows how to add custom attributes to the current span within your Jenkins pipeline:
  pipeline {
    agent any
    stages {
      stage('Add Custom Span Attribute') {
          steps {
            script {
              withSpanAttribute(
                  key: 'my-error-prone-span',
                  value: 'new-traces',
                  type: 'STRING',
                  target: 'CURRENT_SPAN'
              )
              echo 'Custom span attribute added'
            }
          }
        }
    }
  }
What this code does:
- withSpanAttribute(): A Jenkins OTel plugin function that adds custom key-value metadata to spans
- key: 'my-error-prone-span': The attribute name that will appear in your trace data
- value: 'new-traces': The attribute value associated with the key
- type: 'STRING': Specifies the data type of the attribute (can be STRING, LONG, DOUBLE, or BOOLEAN)
- target: 'CURRENT_SPAN': Indicates that the attribute should be added to the currently active span (the stage span in this case)


