Meter Alerts enable you to monitor and manage your observability costs by creating alert rules for total spend, per-signal spend, or limits by dimensions such as service, environment, or ingestion key. This proactive approach helps you maintain control over your observability budget and identify unexpected cost spikes before they impact your organization.
Why Set Up Meter Alerts?
- Prevent Budget Overruns: Receive notifications when costs approach or exceed your budgeted values for a month or specific time window.
- Monitor Signal Breakdown: Stay informed about which signals (logs, traces, metrics) or services are driving increased spend.
- Ensure Fair Usage: Prevent specific teams, services, or ingestion keys from consuming more than their allocated cost share.
- Proactive Cost Management: Take action before costs spiral out of control.
Common Use Cases
- Total Observability Spend Alert: Get an alert when your monthly or quarterly observability spend approaches or exceeds your planned budget.
- Signal-Specific Spend Alert: Trigger alerts for individual signals when they cross defined thresholds (e.g., log ingestion costs exceeding $X).
- Service/Environment Spend Alert: Monitor spend on a per-service or per-environment basis (e.g., alert if 'payment-service' exceeds $X this month).
- Ingestion Key Limit Alert: Receive notifications when an ingestion key approaches its allocated quota.
How Meter Alerts Work
SigNoz Meter Alerts leverage the same flexible alerting engine used for other monitoring signals in SigNoz. Alerts are triggered when a meter metric crosses a specific threshold over a configured evaluation window.
Alert-Compatible Metrics
You can set up alerts on any of the following meter metrics:
| Metric | Description |
|---|---|
signoz.meter.log.count | Total number of log records ingested |
signoz.meter.log.size | Total size of logs ingested (in bytes) |
signoz.meter.span.count | Total number of spans ingested |
signoz.meter.span.size | Total size of spans ingested (in bytes) |
signoz.meter.metric.datapoint.count | Number of metric datapoints ingested |
Metrics can be filtered or grouped by labels including service.name, deployment.environment, host.name, and signoz.workspace.key.id for granular and targeted alerting.
Setting Up a Meter Alert
Setting up a Meter Alert in SigNoz is straightforward and designed for flexibility. Follow these step-by-step instructions to ensure your alerts are robust and actionable:
1. Navigate to the Alerts Section
Open your SigNoz UI and click on the Alerts tab from the sidebar.
Click the
New Alertbutton.Select Try the new experience to use the enhanced alert creation workflow.
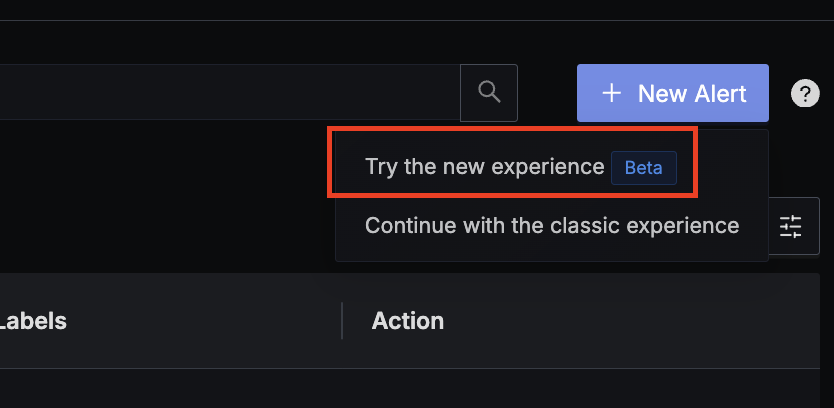
Start by creating a new alert in SigNoz Choose Metric Based Alerts as the alert type.
2. Select Meter as Your Data Source
In the signal or metric source dropdown, select
meterunder the Metrics signal type.From the metrics list, pick the relevant meter metric you want to monitor (such as
signoz.meter.log.sizefor total log size, orsignoz.meter.span.countfor span counts).
Choose 'meter' under Metrics to see cost-related metrics (Optional) Add filters or groupings using available labels (
service.name,deployment.environment,signoz.workspace.key.id, etc.) for targeted alerting at the service, environment, or workspace level.Examples:
Monitor costs for a specific service: Add
service.name: payment-serviceWatch ingestion associated with an environment: Add
deployment.environment: production
3. Configure Alert Thresholds & Evaluation Window
Define the condition for when the alert should trigger:
- Set a threshold (such as a cumulative log size over 1 GB).
- Choose the aggregation: For most cost/usage monitoring, select In Total to aggregate all values within the window.
Set the evaluation window:
- Select Cumulative to monitor total usage for the chosen period.
- Choose a suitable window (e.g., Current Day for daily alerts, Current Month for monthly budget limits).
✅ InfoTip: Meter and billing data in SigNoz always use the UTC timezone. Align your alert windows with your organization’s billing/reporting cycle, or use 'Current Month' for monthly quotas.
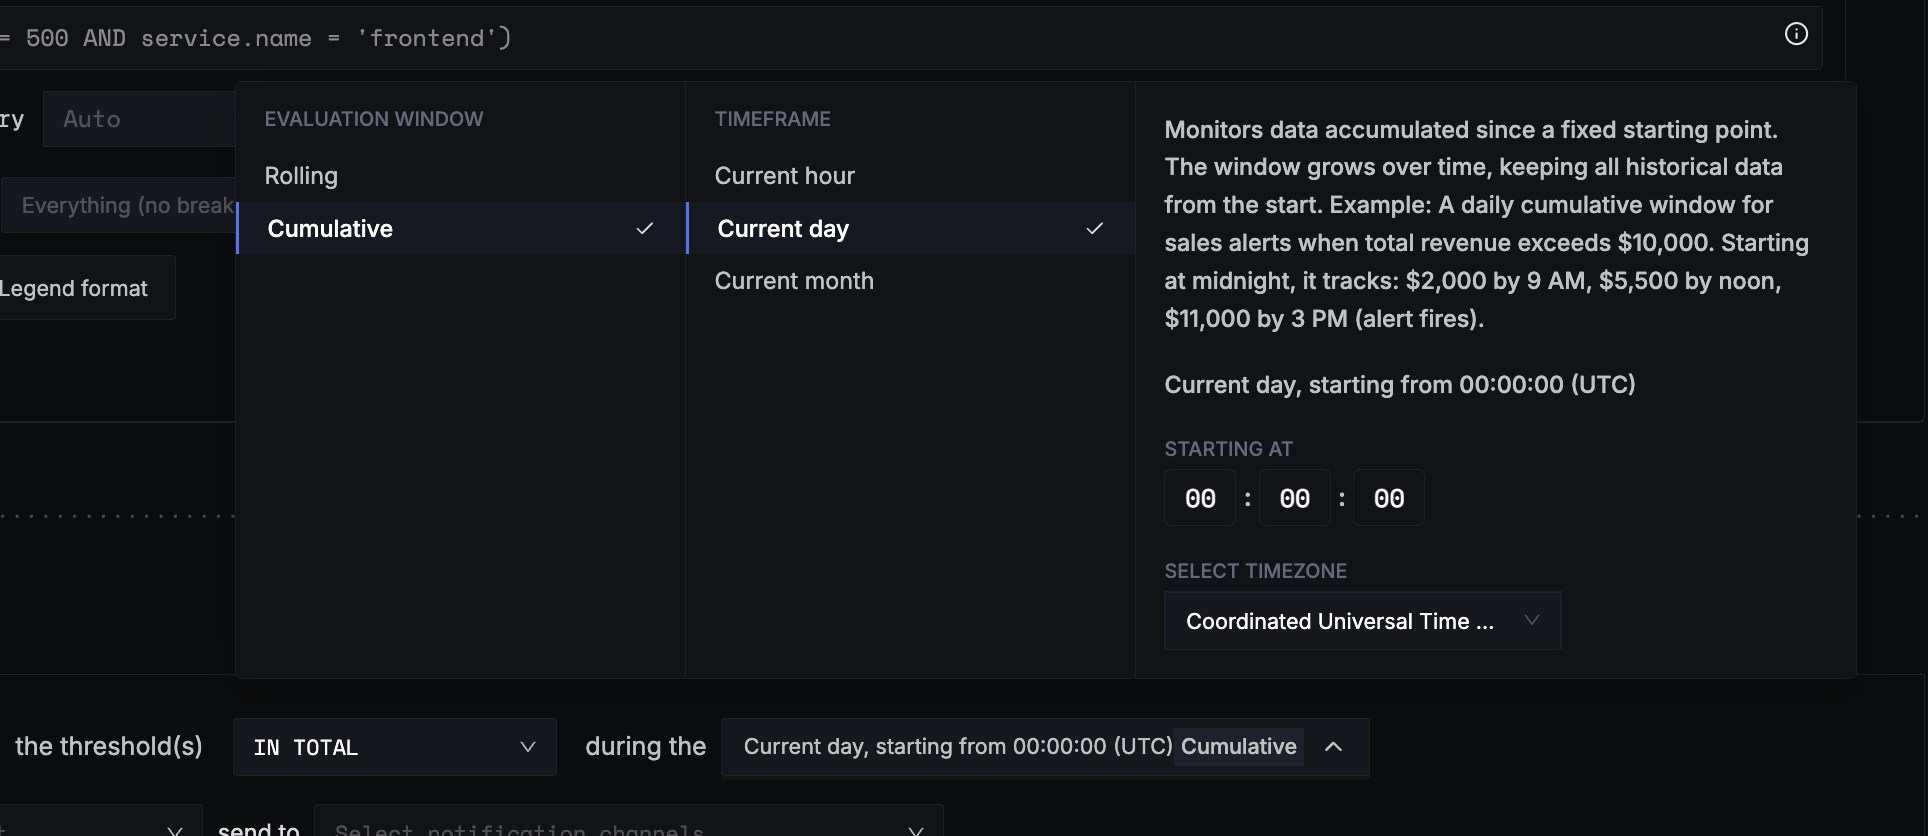
Set up a cumulative window for billing-aligned alerts
4. Configure Notification Channels
- Attach notification channels of your choice (e.g., Email, Slack, PagerDuty) to receive real-time alerts.
- (Optional) Customize the notification message to provide clear guidance when the alert fires (include context like the service/environment and recommended action).
5. Review & Finalize Your Alert
- Give your alert a clear and descriptive name (e.g., "Daily Log Data Budget", "Prod Ingestion Key Quota Exceeded").
- Double-check your query conditions, filters, and notification preferences.
- Click Save to activate the alert.
Examples
Example 1: Alert for Monthly Log Costs Exceeding $500
- Go to the billing section to find your per-GB log price, which may vary based on your retention settings.
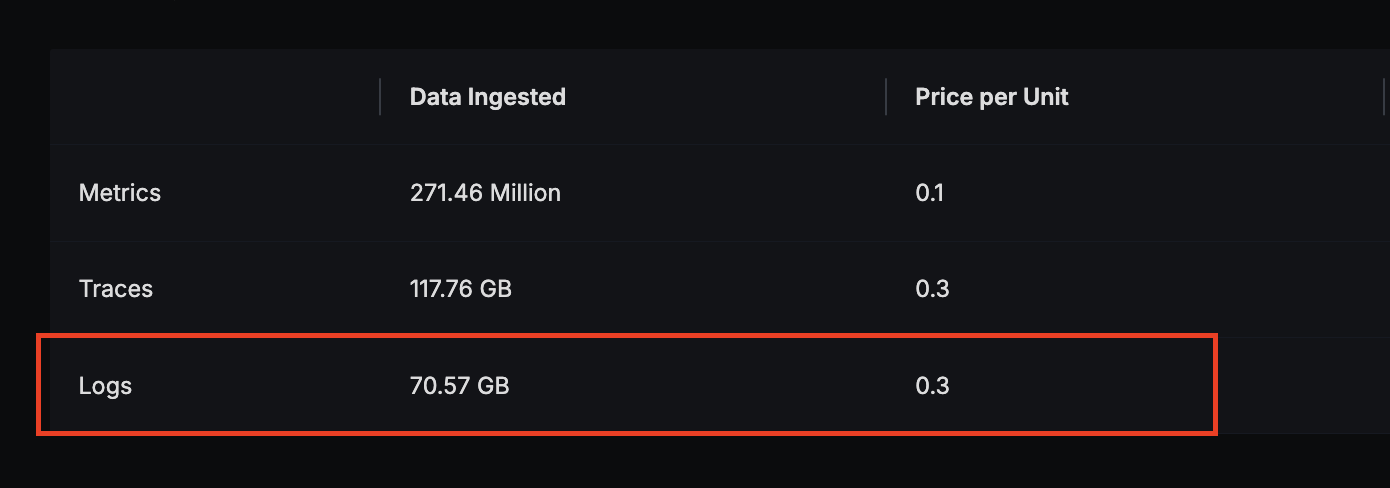
In the query builder, select the
signoz.meter.log.sizemeter metric and settimeAggregationtoIncreaseto sum the total log usage.Use a formula to convert usage to cost:
(A / 1e9) * (cost per GB).
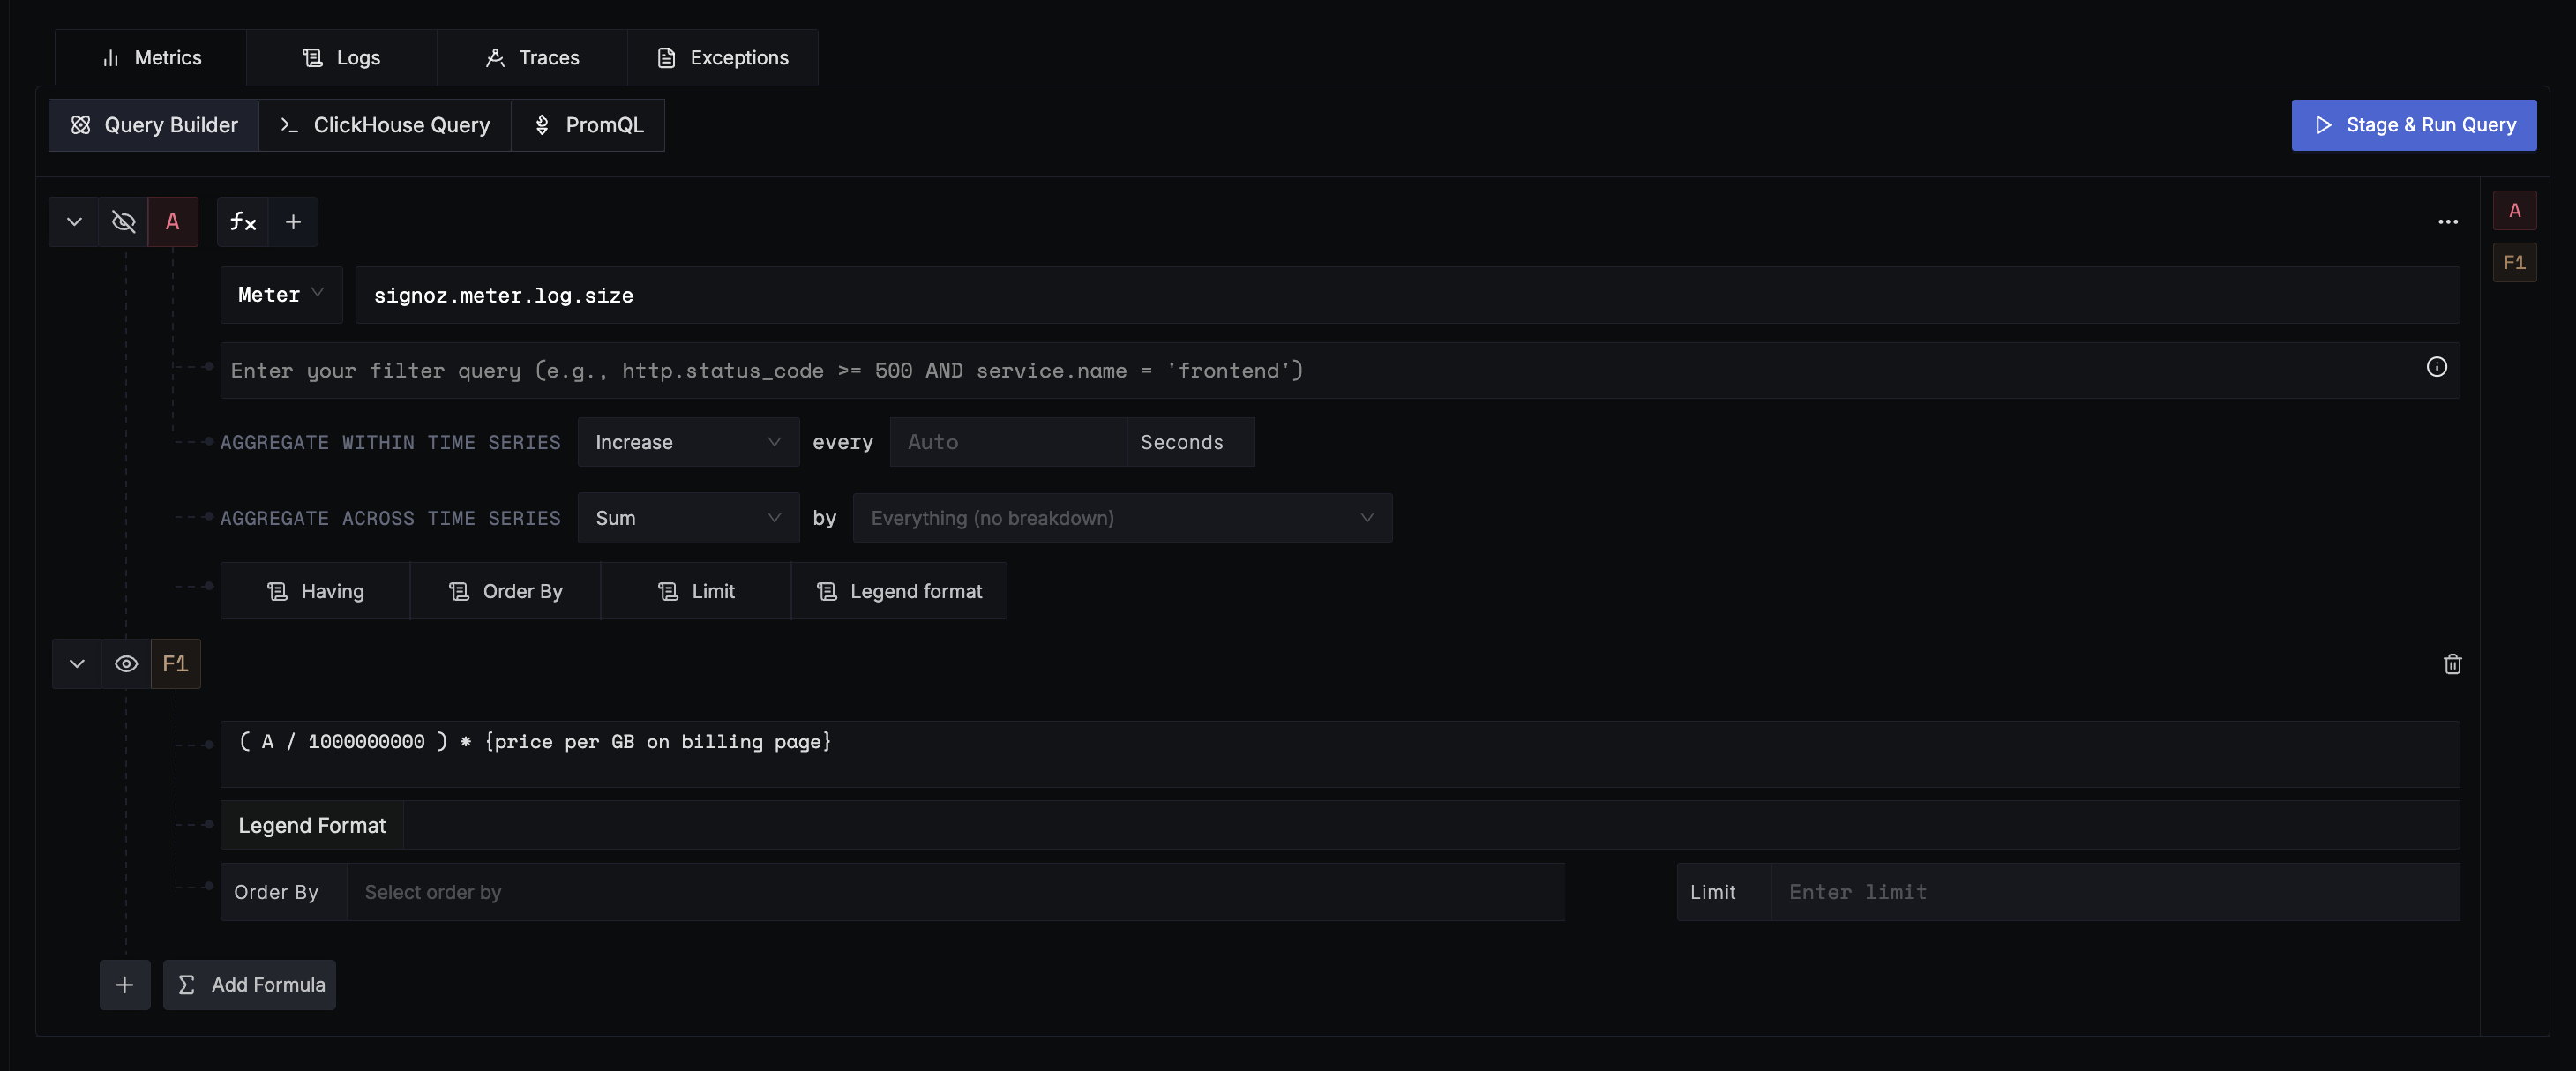
Set the alert threshold on this formula with
In Totalaggregation.Choose a
Cumulativewindow alert with time range set toCurrent Month, and ensure the start date matches your billing cycle as specified on the billing page.For accuracy, set the evaluation window to start at
00:00:00UTC (since billing is calculated in UTC), or pick the corresponding time window in your local timezone.

- Select your preferred notification channel and save the alert.
Example 2: Alert for Monthly Total Costs Exceeding $1000
- On the billing page, identify the per-GB price for logs and spans, and the per-million data point price for metrics.
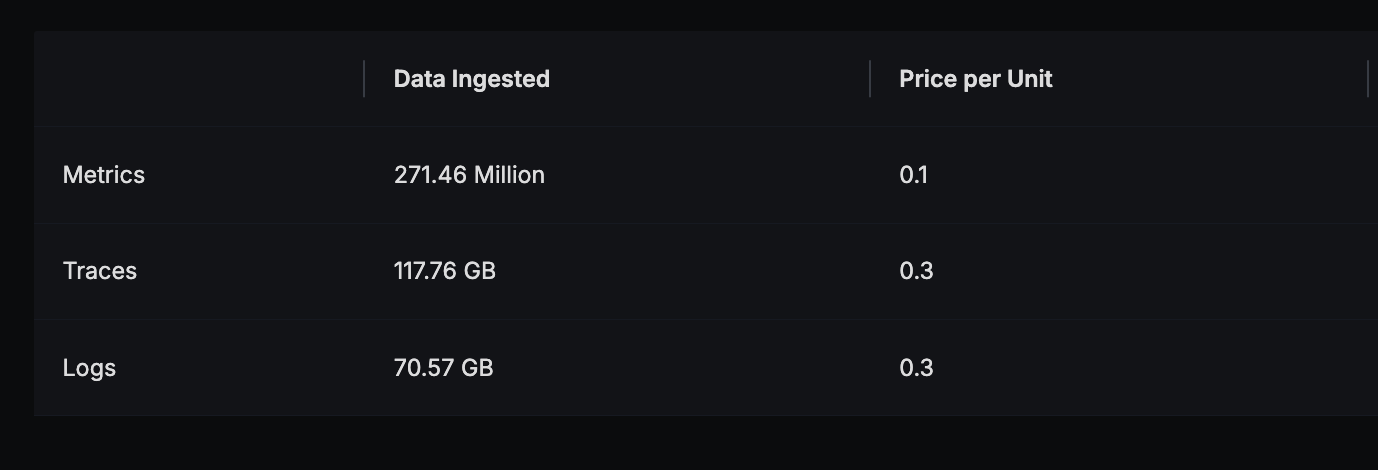
In the query builder, select
signoz.meter.log.sizewithtimeAggregationset toIncrease.Additionally, add queries for
signoz.meter.span.sizeandsignoz.meter.metric.datapoint.countwith the same aggregation.Combine these with a formula to calculate total cost:
- Logs:
(A / 1e9) * (cost per GB of logs) - Spans:
(B / 1e9) * (cost per GB of spans) - Metrics:
(C / 1e6) * (cost per million data points) - Total: Sum all three components.
- Logs:
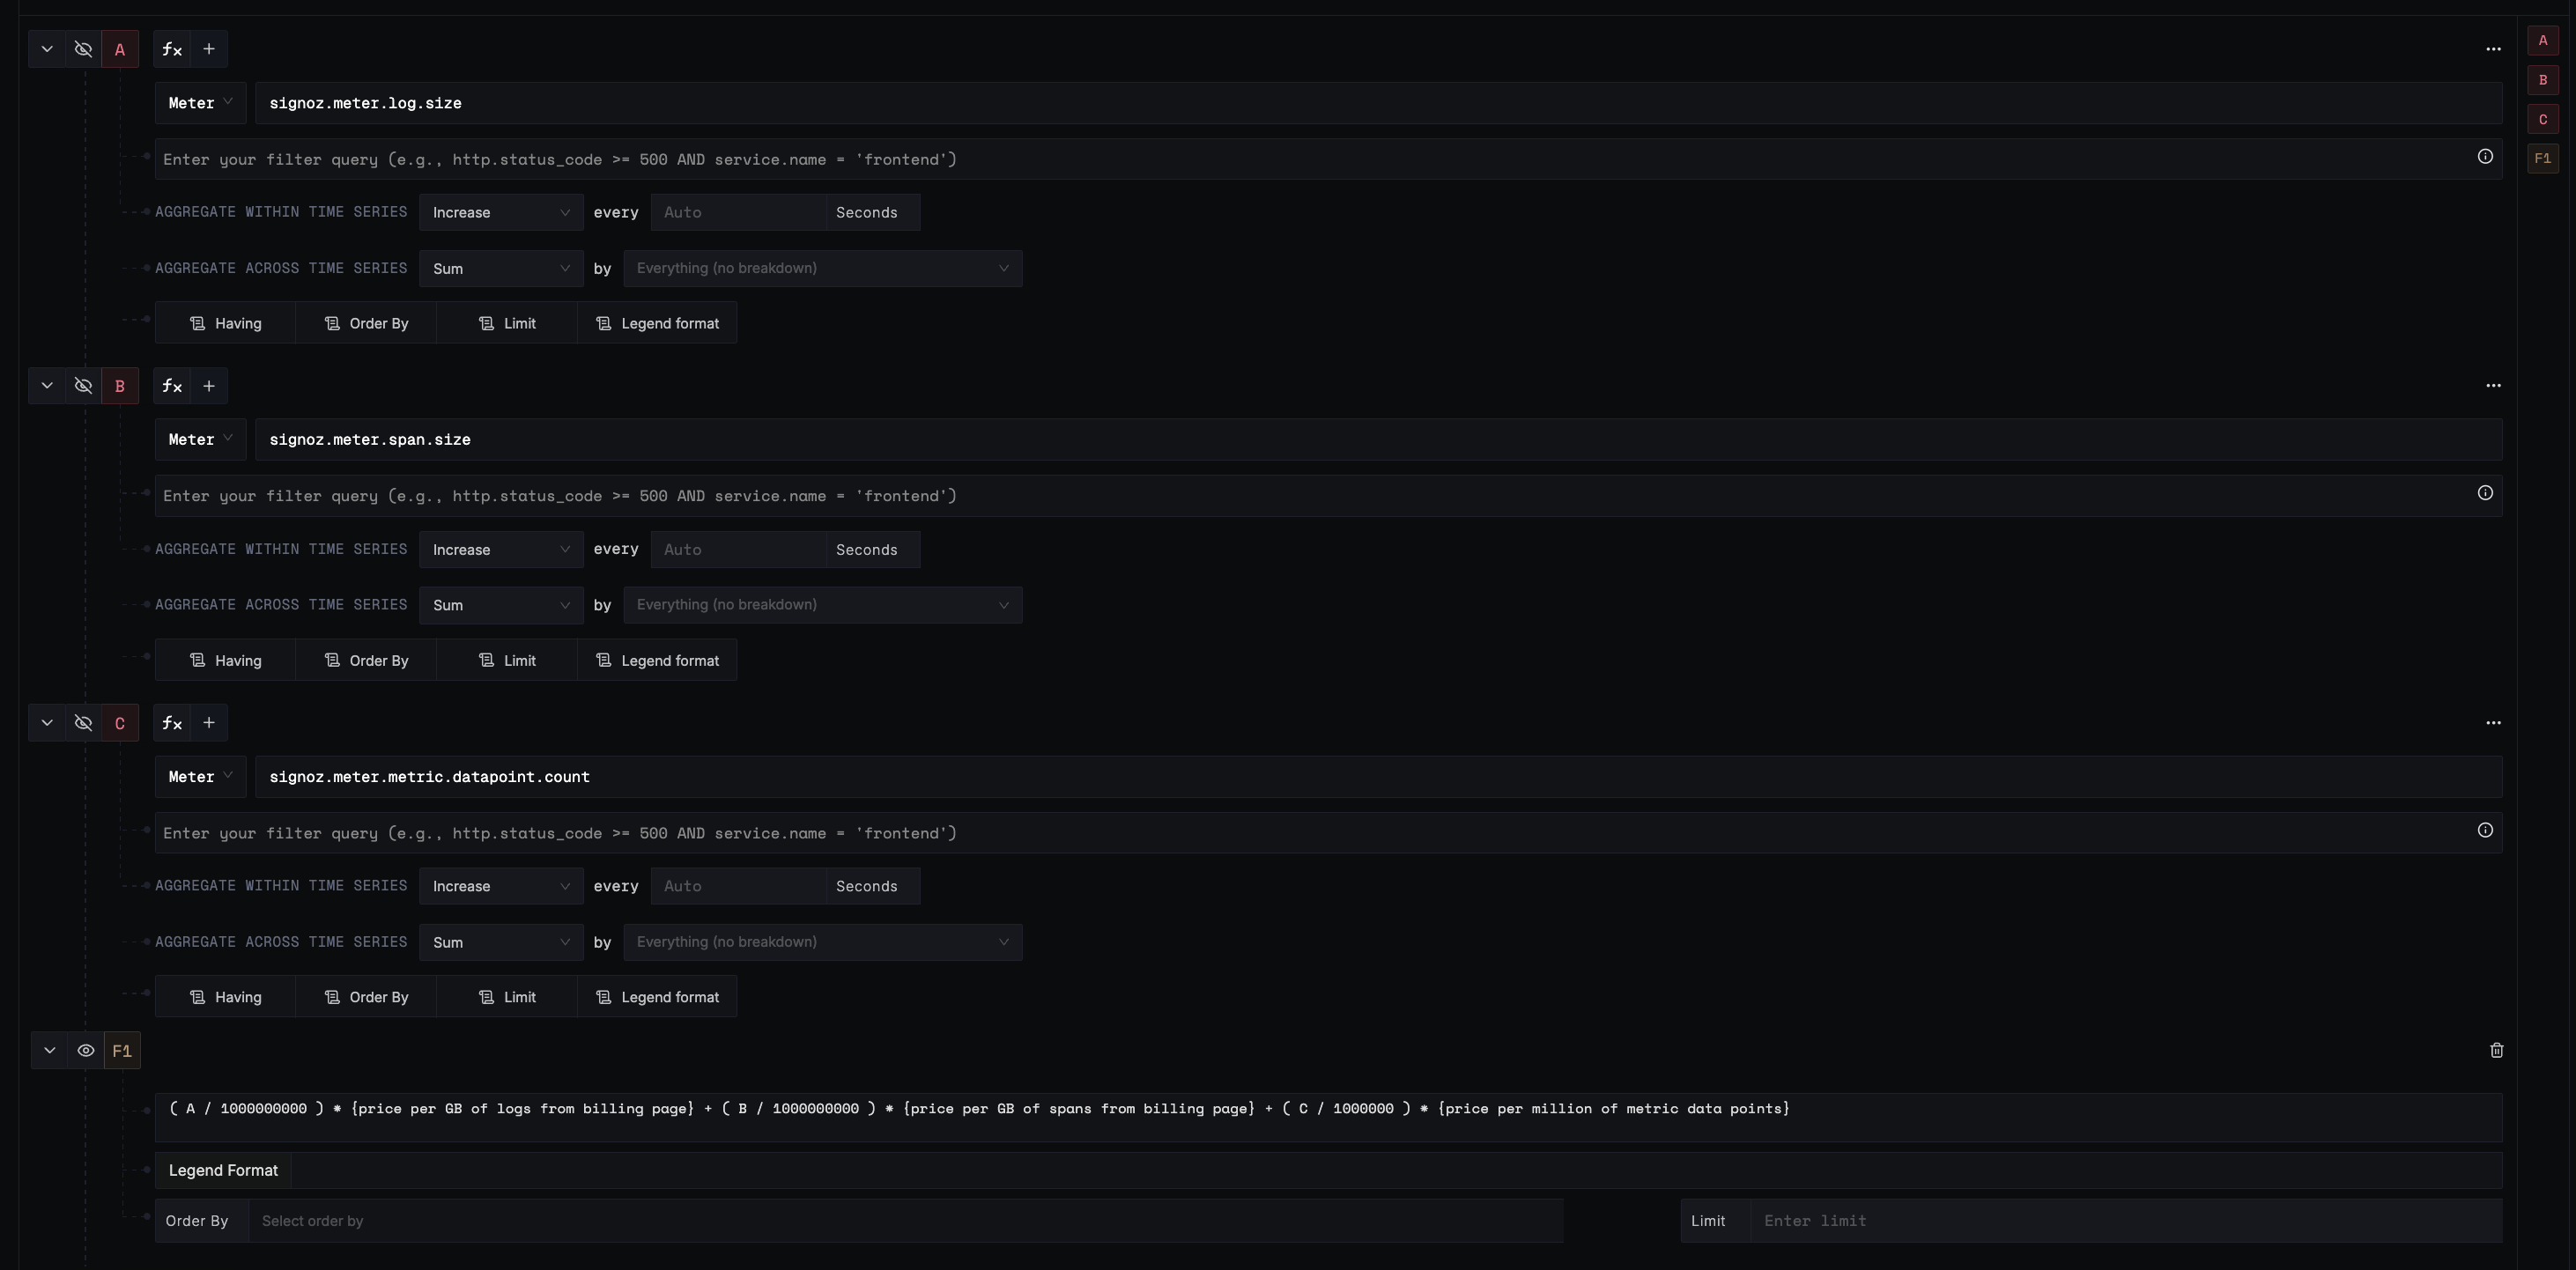
Apply the formula as the threshold condition with
In Totalaggregation.Use a
Cumulativewindow alert, selectCurrent Monthas the time range, and set the start date based on your billing cycle.Make sure the evaluation window aligns with
00:00:00UTC, or select the appropriate range for your timezone.

- Choose a notification channel and save the alert.
Example 3: Alert When an Ingestion Key Is Nearing Its Daily Quota
Go to the ingestion keys page and expand the key you want to monitor.
Click the
bellicon next to the daily limit for the relevant signal type.
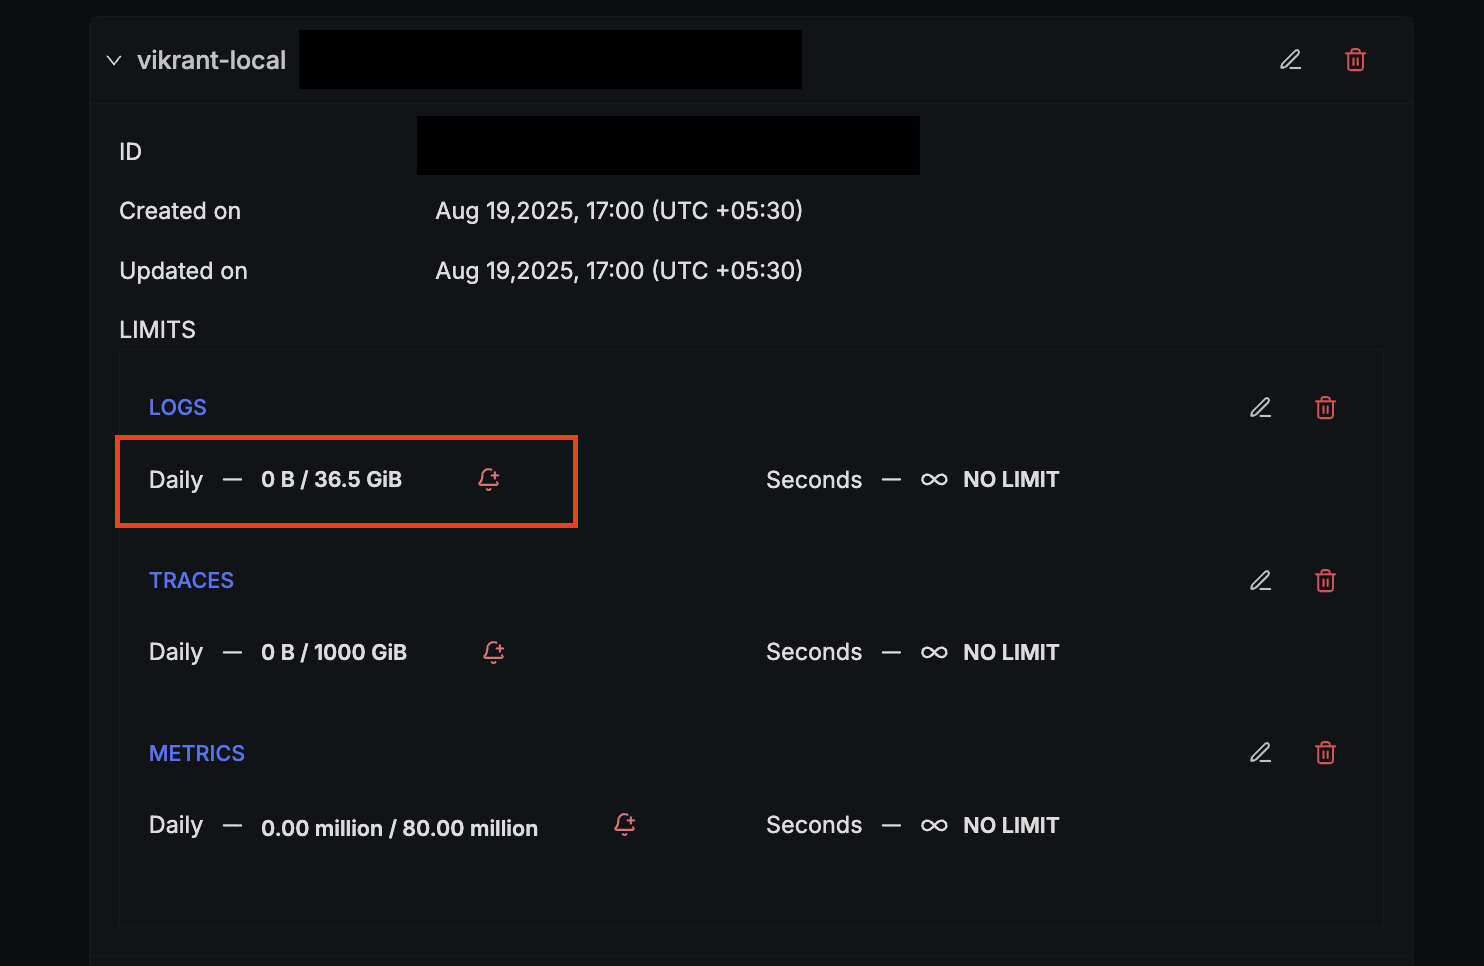
- You will be redirected to the alerts page with a pre-filled query that includes all the necessary fields.
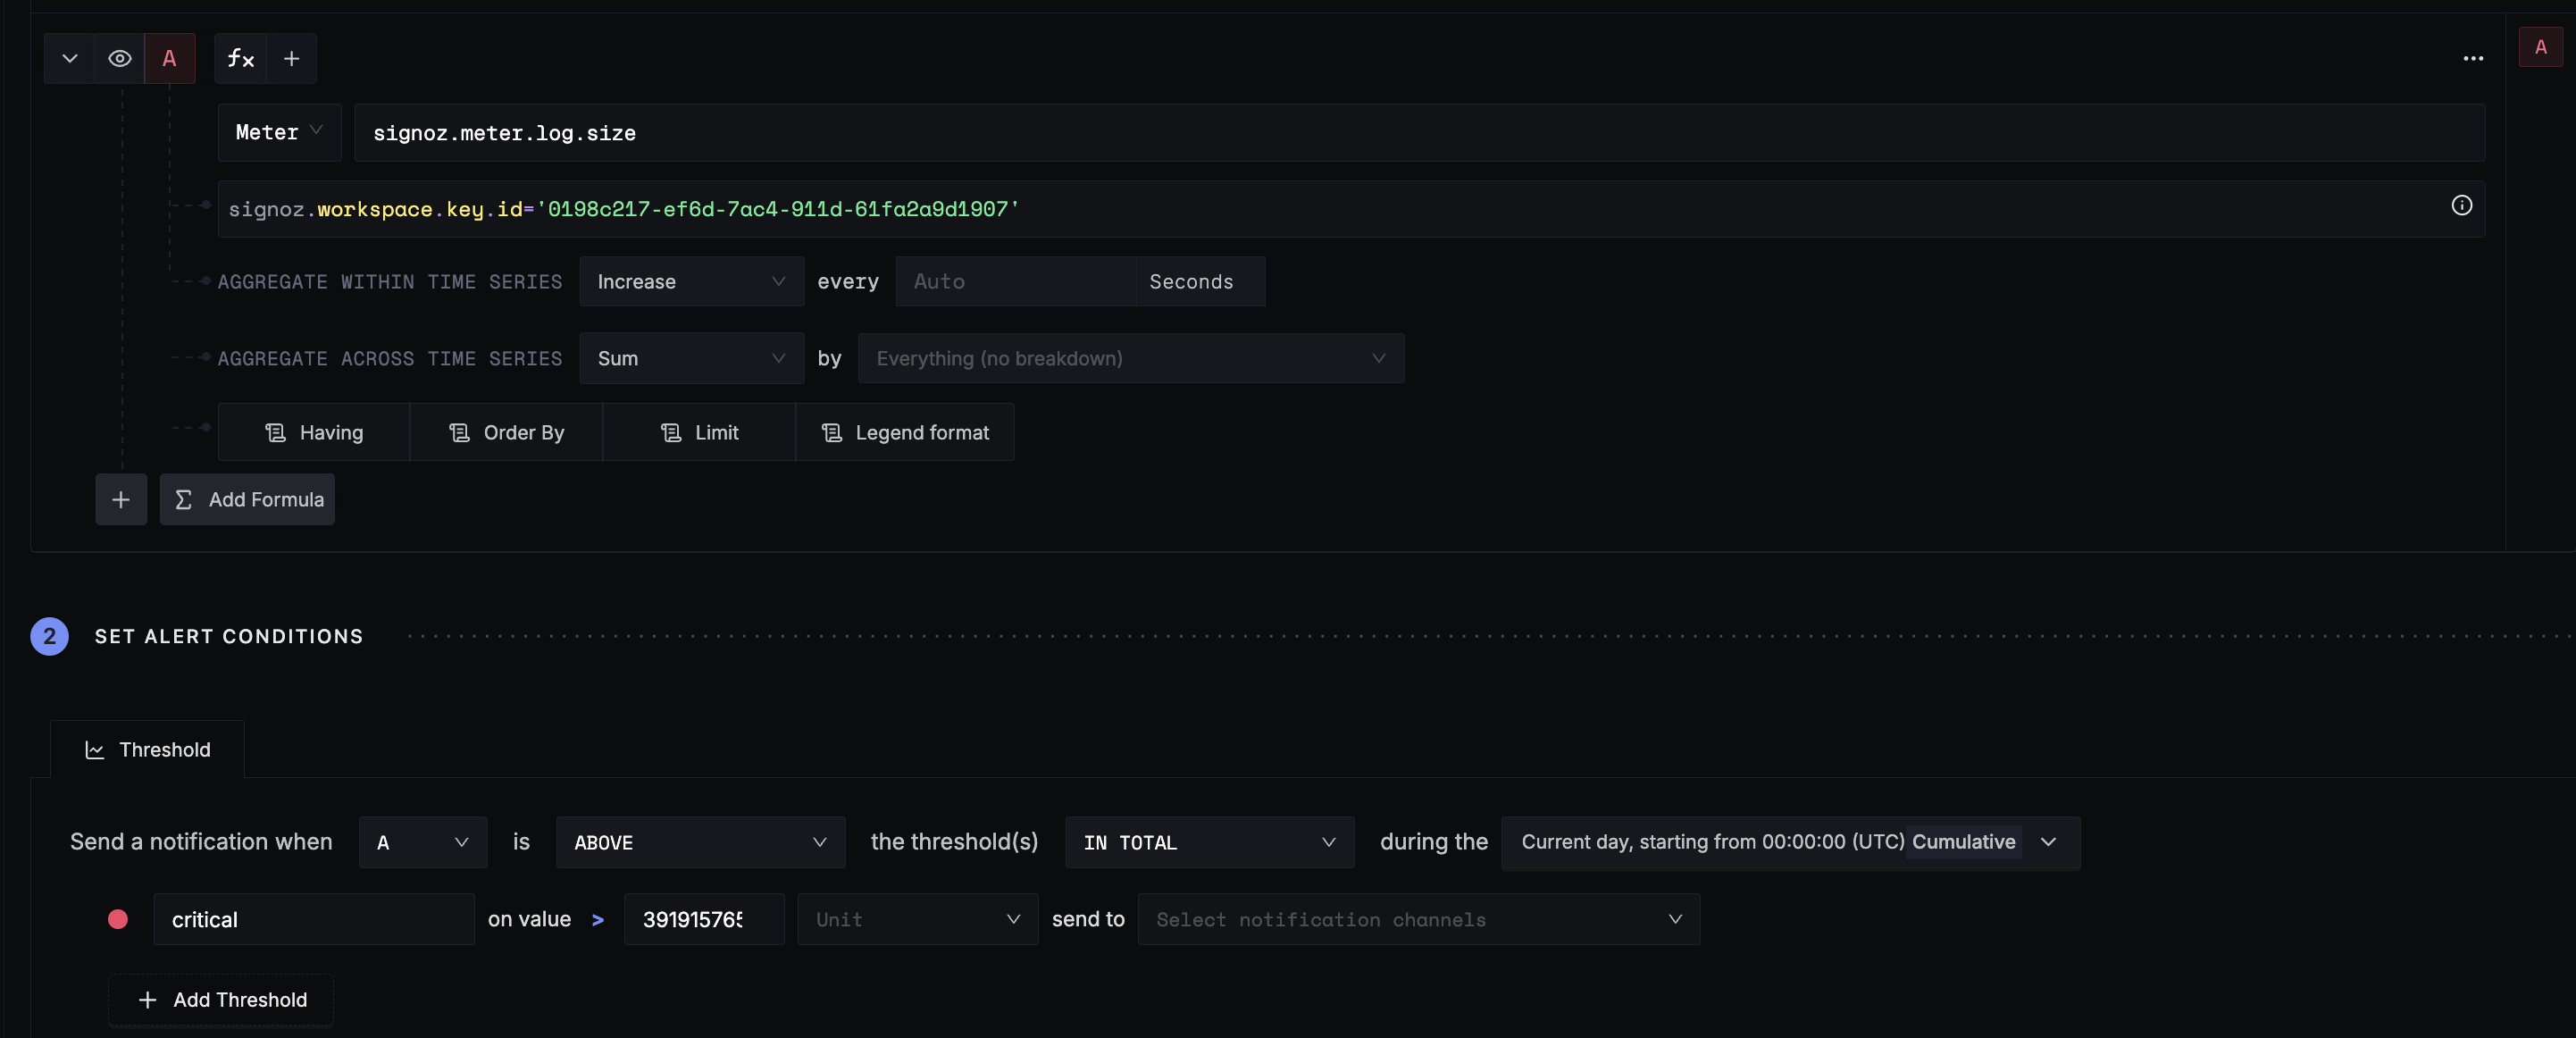
- Give the alert a meaningful name, choose a notification channel, and save.
Example 4: Alert When Any Service Ingests Over 1 Million Spans in a Day
- Select the
signoz.meter.span.countmetric, and add agroup byforservice.nameto monitor spans per service.
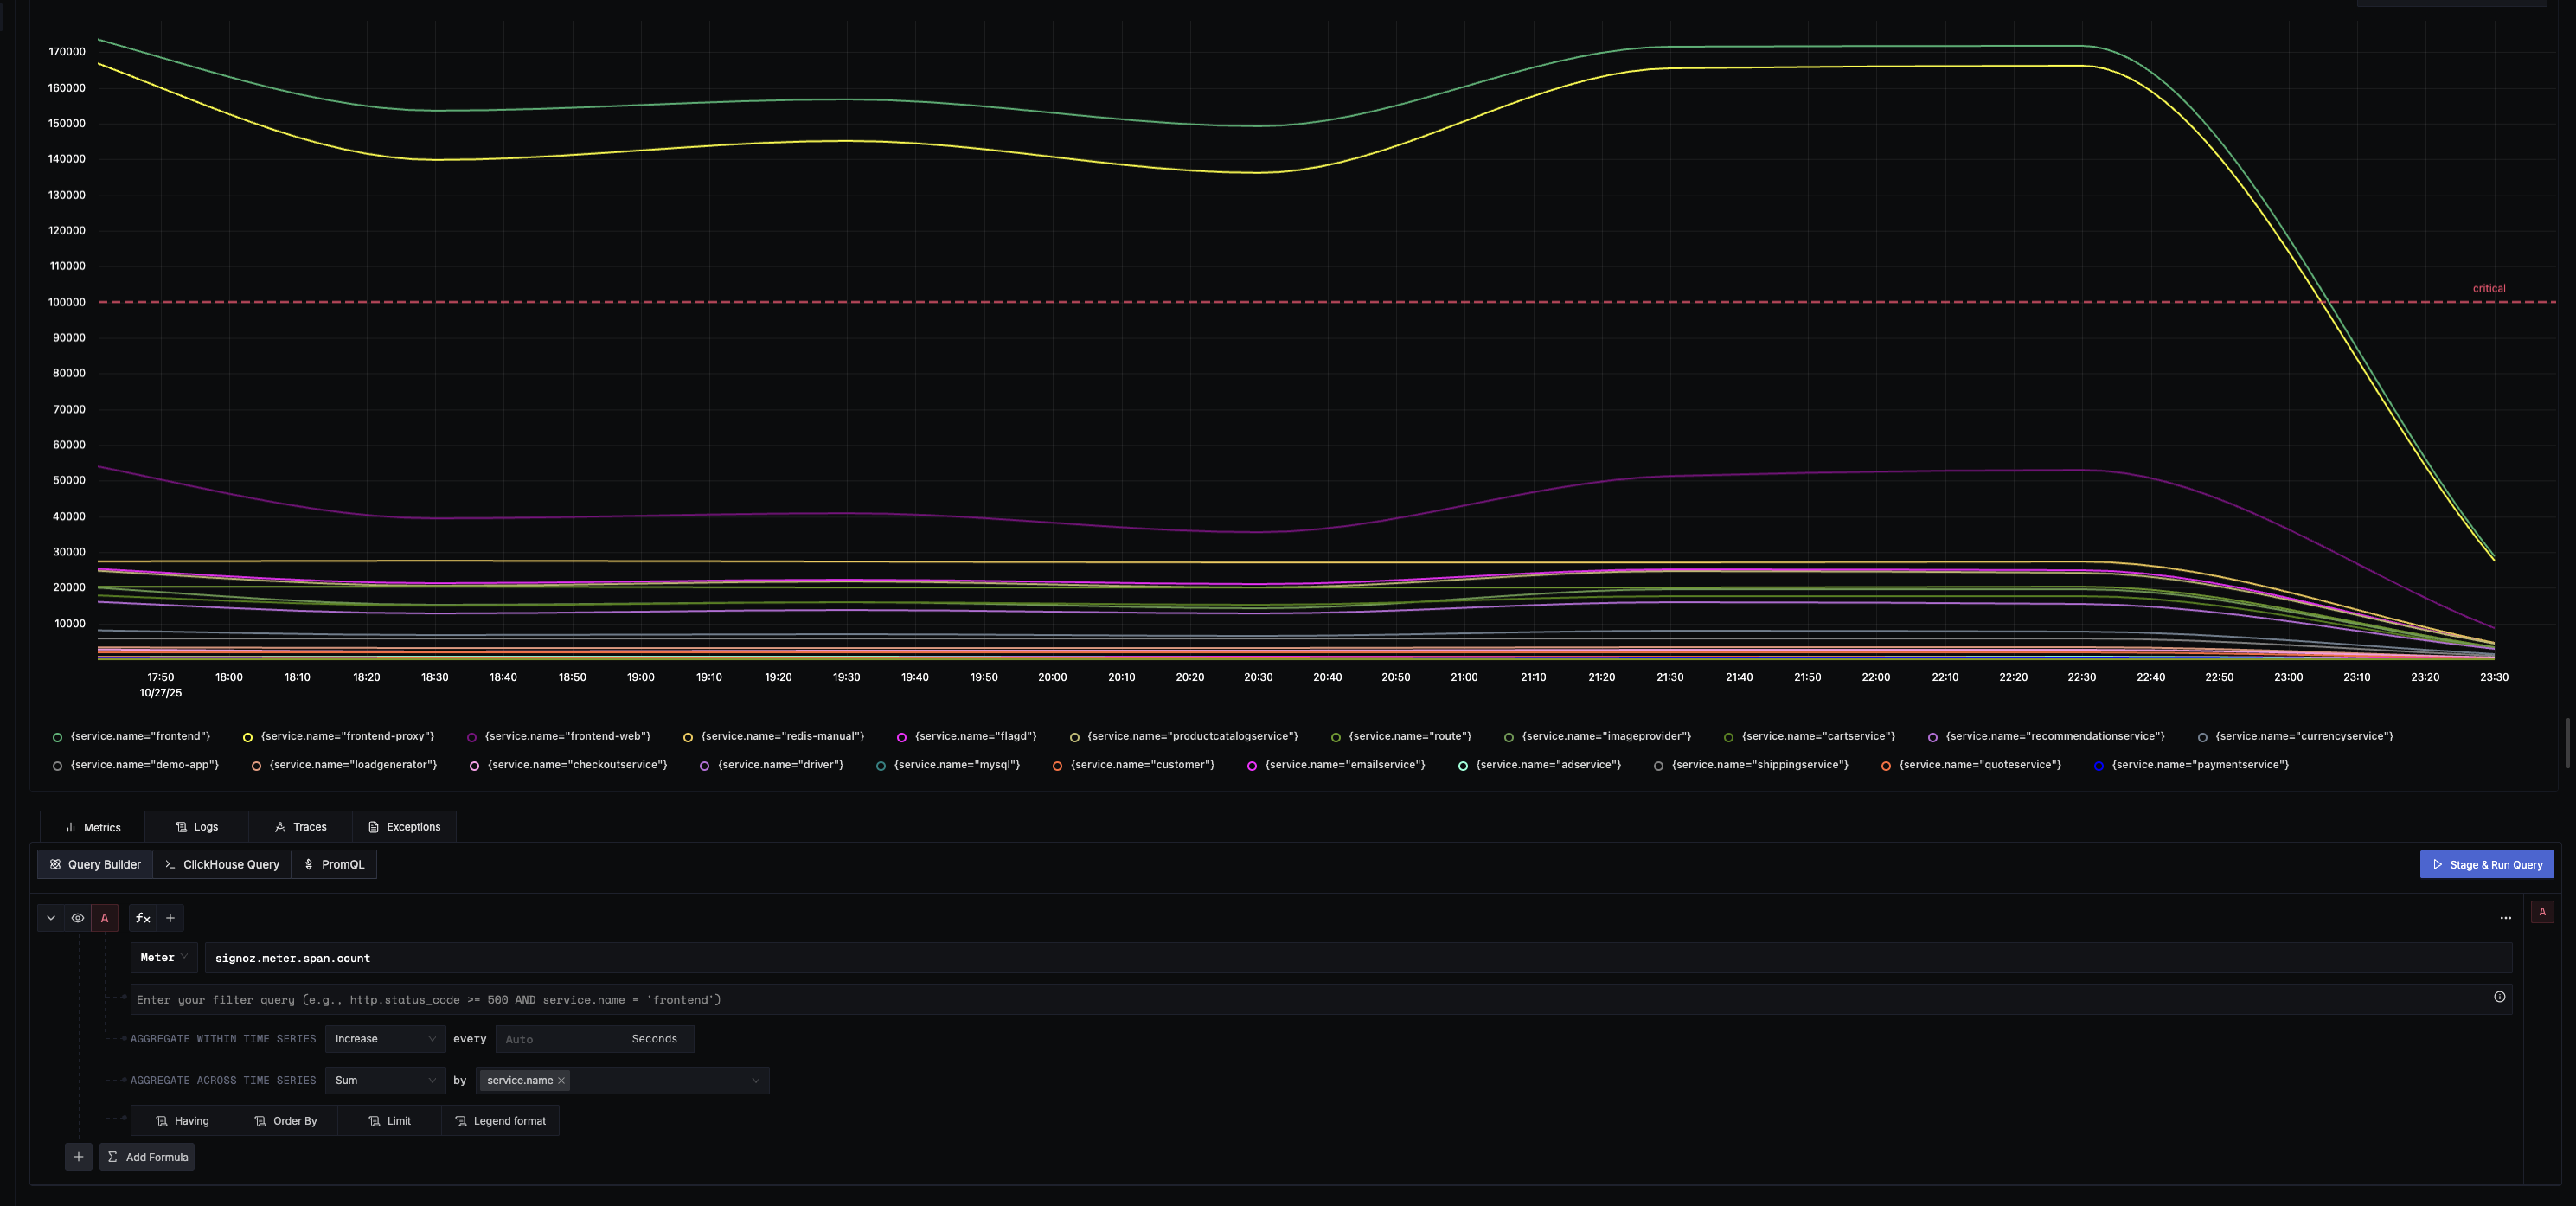
Set the threshold to 1,000,000 spans, using
In Totalaggregation.Set the evaluation window to
Cumulativeand pickCurrent Daysince we are interested in daily usage limits.

- Configure notifications and save the alert.
Best Practices
- Align Alerts with Budgets: Set alert thresholds just below your actual budget limit to allow time for action.
- Review Regularly: Periodically review and adjust alert thresholds and conditions based on changing usage patterns.
Troubleshooting
- No Meter Data Shown: Ensure your query time range is larger than 1 hour. Meter data is aggregated hourly.
- No Alert Triggered: Confirm your condition and threshold accurately reflect the underlying metric’s scale (bytes, records, spans, etc.).
- Mismatch with Billing Page? Meter data in SigNoz is aggregated and displayed using the UTC time zone. If you notice that the usage data shown here does not match exactly with your billing page, ensure you are comparing usage within the same UTC-aligned period.
Additional Resources
For support, reach out on our community forum or join the SigNoz Slack.
Remember: Be proactive, not reactive—use Meter Alerts to stay in control of your observability spend!
