This dashboard provides comprehensive monitoring of Application Performance Monitoring (APM) metrics, offering detailed visibility into latency percentiles, request rates, error percentages, and external API calls across your applications and services.
📝 Note
To use this dashboard, you need to set up the opentelemetry instrumentation and send traces to SigNoz. Follow the Instrumentation guide to get started.
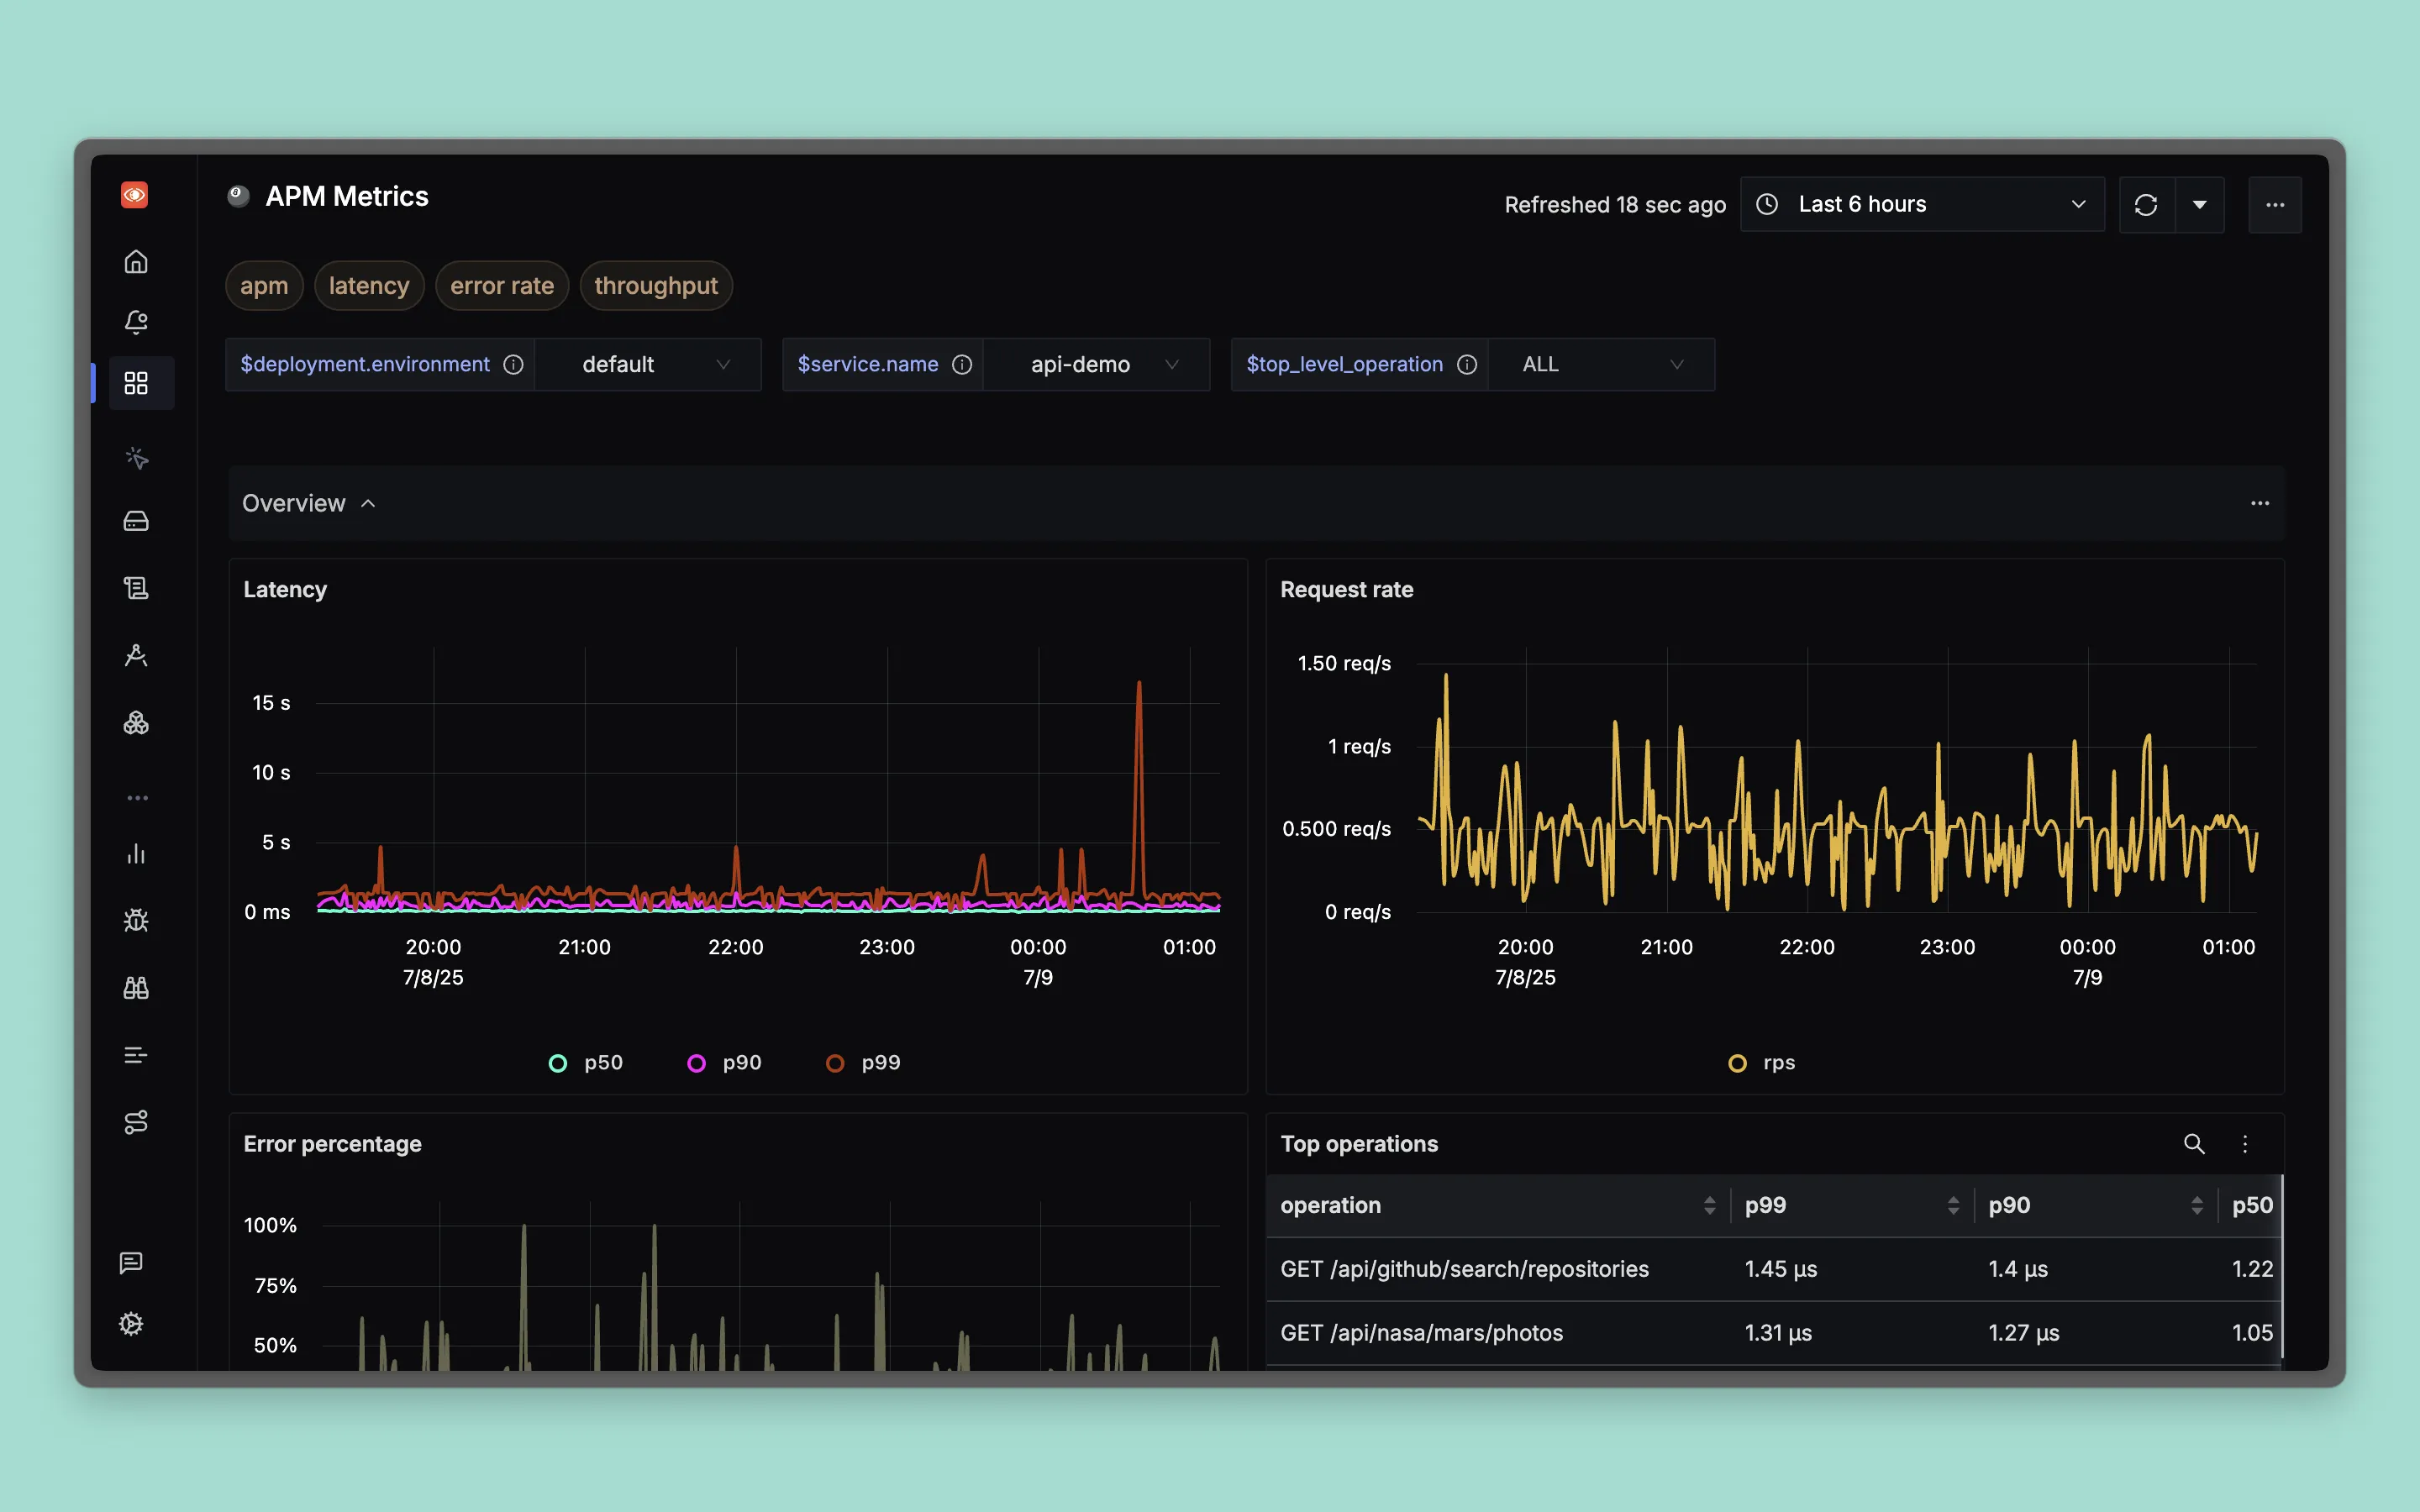
Dashboard Preview
Dashboards → + New dashboard → Import JSON
What This Dashboard Monitors
This dashboard tracks essential application performance metrics to help you:
- Monitor Application Latency: Track response times across different percentiles (p50, p90, p99)
- Request Rate Analysis: Monitor incoming request volumes and traffic patterns
- Error Rate Tracking: Identify and track application errors and failure rates
- Operation Performance: Analyze performance of specific API endpoints and operations
- External API Monitoring: Track external service calls, error rates, and response times
- Database Performance: Monitor database call rates and average duration
Metrics Included
Overview Section
Latency Metrics
- Latency Chart: Shows p50, p99, and p90 percentile response times over time
Request Rate Metrics
- Request Rate Chart: Displays requests per second (rps) over time
Error Metrics
- Error Percentage Chart: Shows error percentage trends over time
Top Operations
- Top Operations Table: Performance metrics table showing operation names with p99, p90, and p50 latencies
DB Metrics Section
- DB Calls RPS: Database calls requests per second
- Database Calls Avg Duration: Average duration of database calls
External Calls Section
- By External Address Stats Table: Comprehensive table showing external API calls with:
- Address: External service endpoints being called
- RPS: Requests per second to each external service
- Error %: Error percentage for external calls
- Avg Duration: Average response time for external calls
Dashboard Variables
This dashboard includes pre-configured variables for filtering:
- deployment.environment: Filter by deployment environment (production, staging, development, etc.)
- service.name: Filter by specific service names (supports multi-select)
- top_level_operation: Filter by top-level operations for the service
