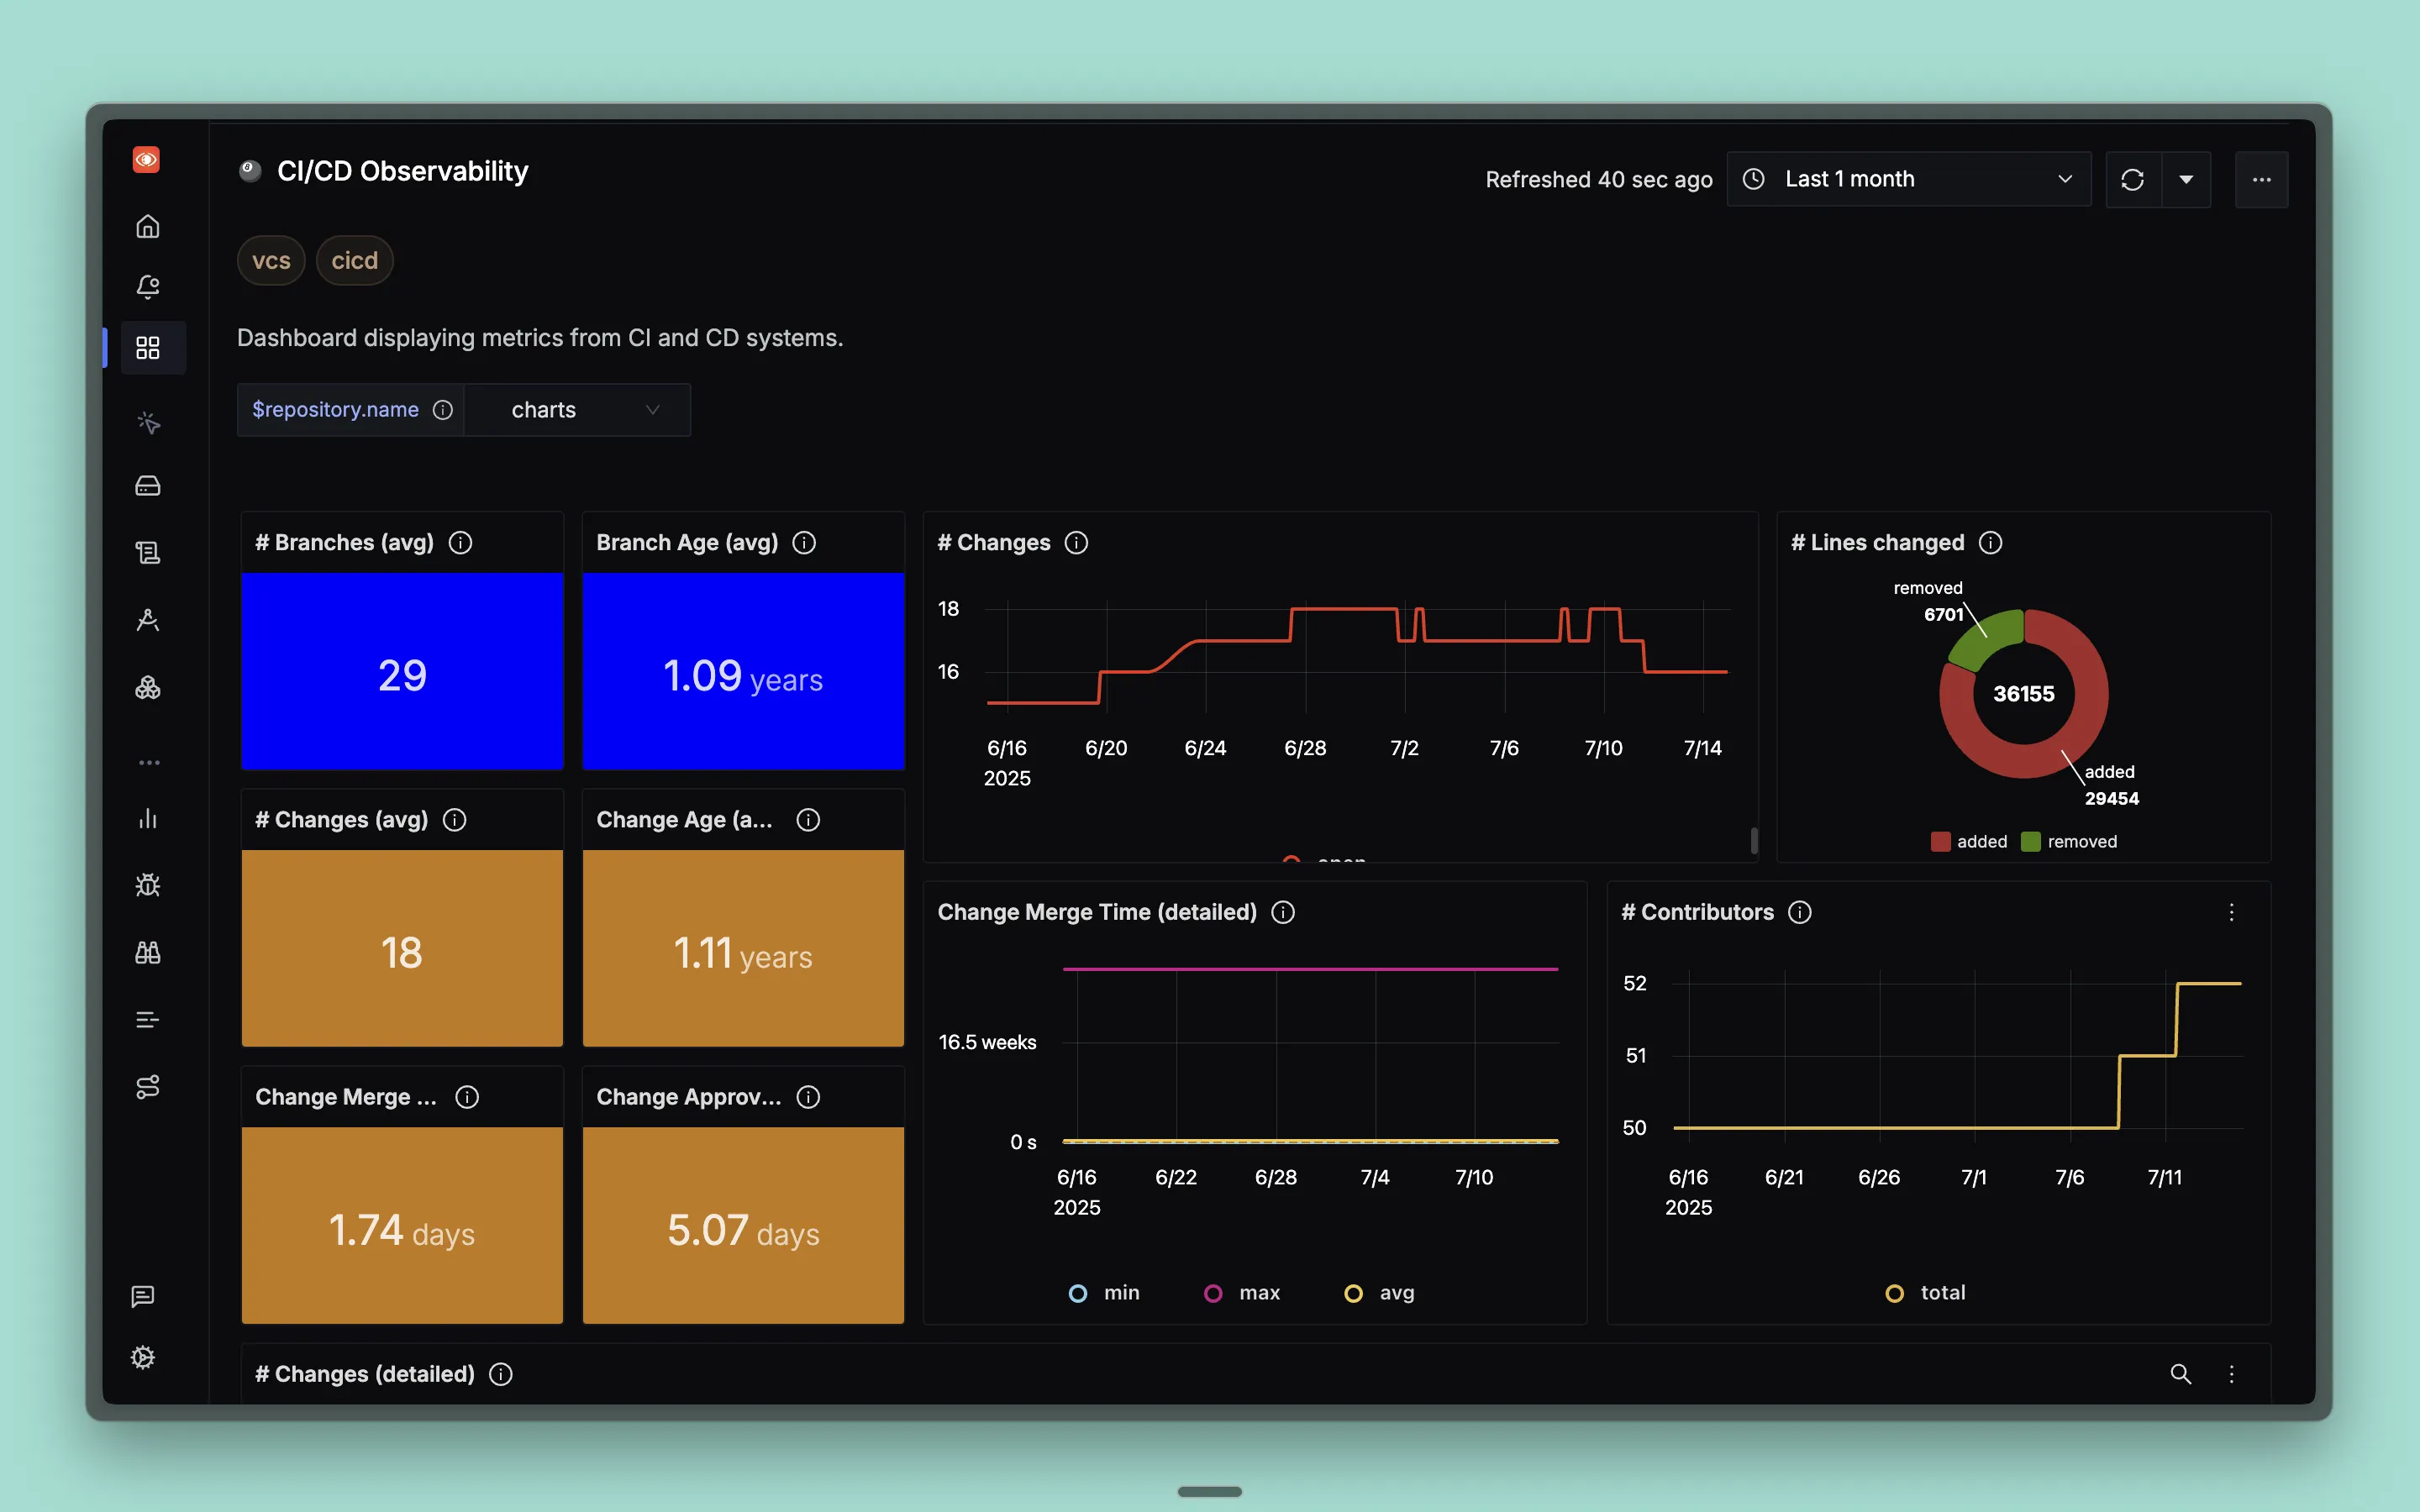
This dashboard provides comprehensive monitoring of CI/CD pipeline performance and repository activity, offering detailed visibility into repository metrics, change management processes, pipeline execution times, and deployment statuses. This dashboard will work with any VCS provider which sends semantic metrics.
Dashboard Preview
Dashboard JSON
Recommended. Uses the V2 dashboard schema and needs SigNoz v0.135.0 or newer.
Import it in SigNoz with Dashboards → + New dashboard → Import JSON. Import guide
What This Dashboard Monitors
This dashboard tracks essential CI/CD metrics to help you:
- Monitor Repository Activity: Track branches, changes, and contributor activity
- Analyze Change Management: Monitor approval times, merge times, and change lifecycle
- Track Pipeline Performance: Analyze pipeline duration, success rates, and bottlenecks
- Optimize Development Workflow: Identify inefficiencies in code review and deployment processes
- Measure DORA Metrics: Track change lead time and deployment frequency
- VCS Provider Agnostic: Works with any version control system that sends semantic metrics
Metrics Included
Repository Metrics
- # Branches: Shows average number of branches in the repository
- Branch Age: Shows average age of branches in the repository
- # Contributors: Shows number of contributors over time
- # Lines Changed: Shows distribution of lines added vs removed in a pie chart
Change Management Metrics
- # Changes: Shows average number of changes in open state
- Change Age: Shows average time a change remains in open state
- Change Approval Time: Shows average time taken to approve a change
- Change Merge Time: Shows average time taken to merge a change (part of DORA Change Lead Time metric)
- # Changes: Shows number of changes by state over time
- Change Merge Time (detailed): Shows minimum, average, and maximum merge times over time
Pipeline Metrics
- Pipeline Duration: Shows average pipeline duration by pipeline name
- Pipeline Duration (P50): Shows P50 pipeline duration over time by pipeline name
- # Statuses: Shows pipeline run counts grouped by status (success, failure, etc.)
- # Statuses: Shows pipeline statuses over time by pipeline name and status
Detailed Analysis
- # Changes (detailed): Shows detailed breakdown of changes including age, merge time, approval time, lines added, and lines removed by branch name
- Pipeline Duration (detailed): Shows detailed pipeline duration breakdown with P50, P90, and P99 percentiles by pipeline name
Dashboard Variables
This dashboard includes pre-configured variables for filtering:
- repository.name: Filter by specific repository name


