This dashboard provides comprehensive monitoring of container performance and resource utilization, offering detailed visibility into CPU usage, memory consumption, network traffic, and storage I/O operations.
✅ Info
To use this dashboard, you need to set up the data source and send telemetry to SigNoz. Follow the Docker Container Metrics guide to get started.
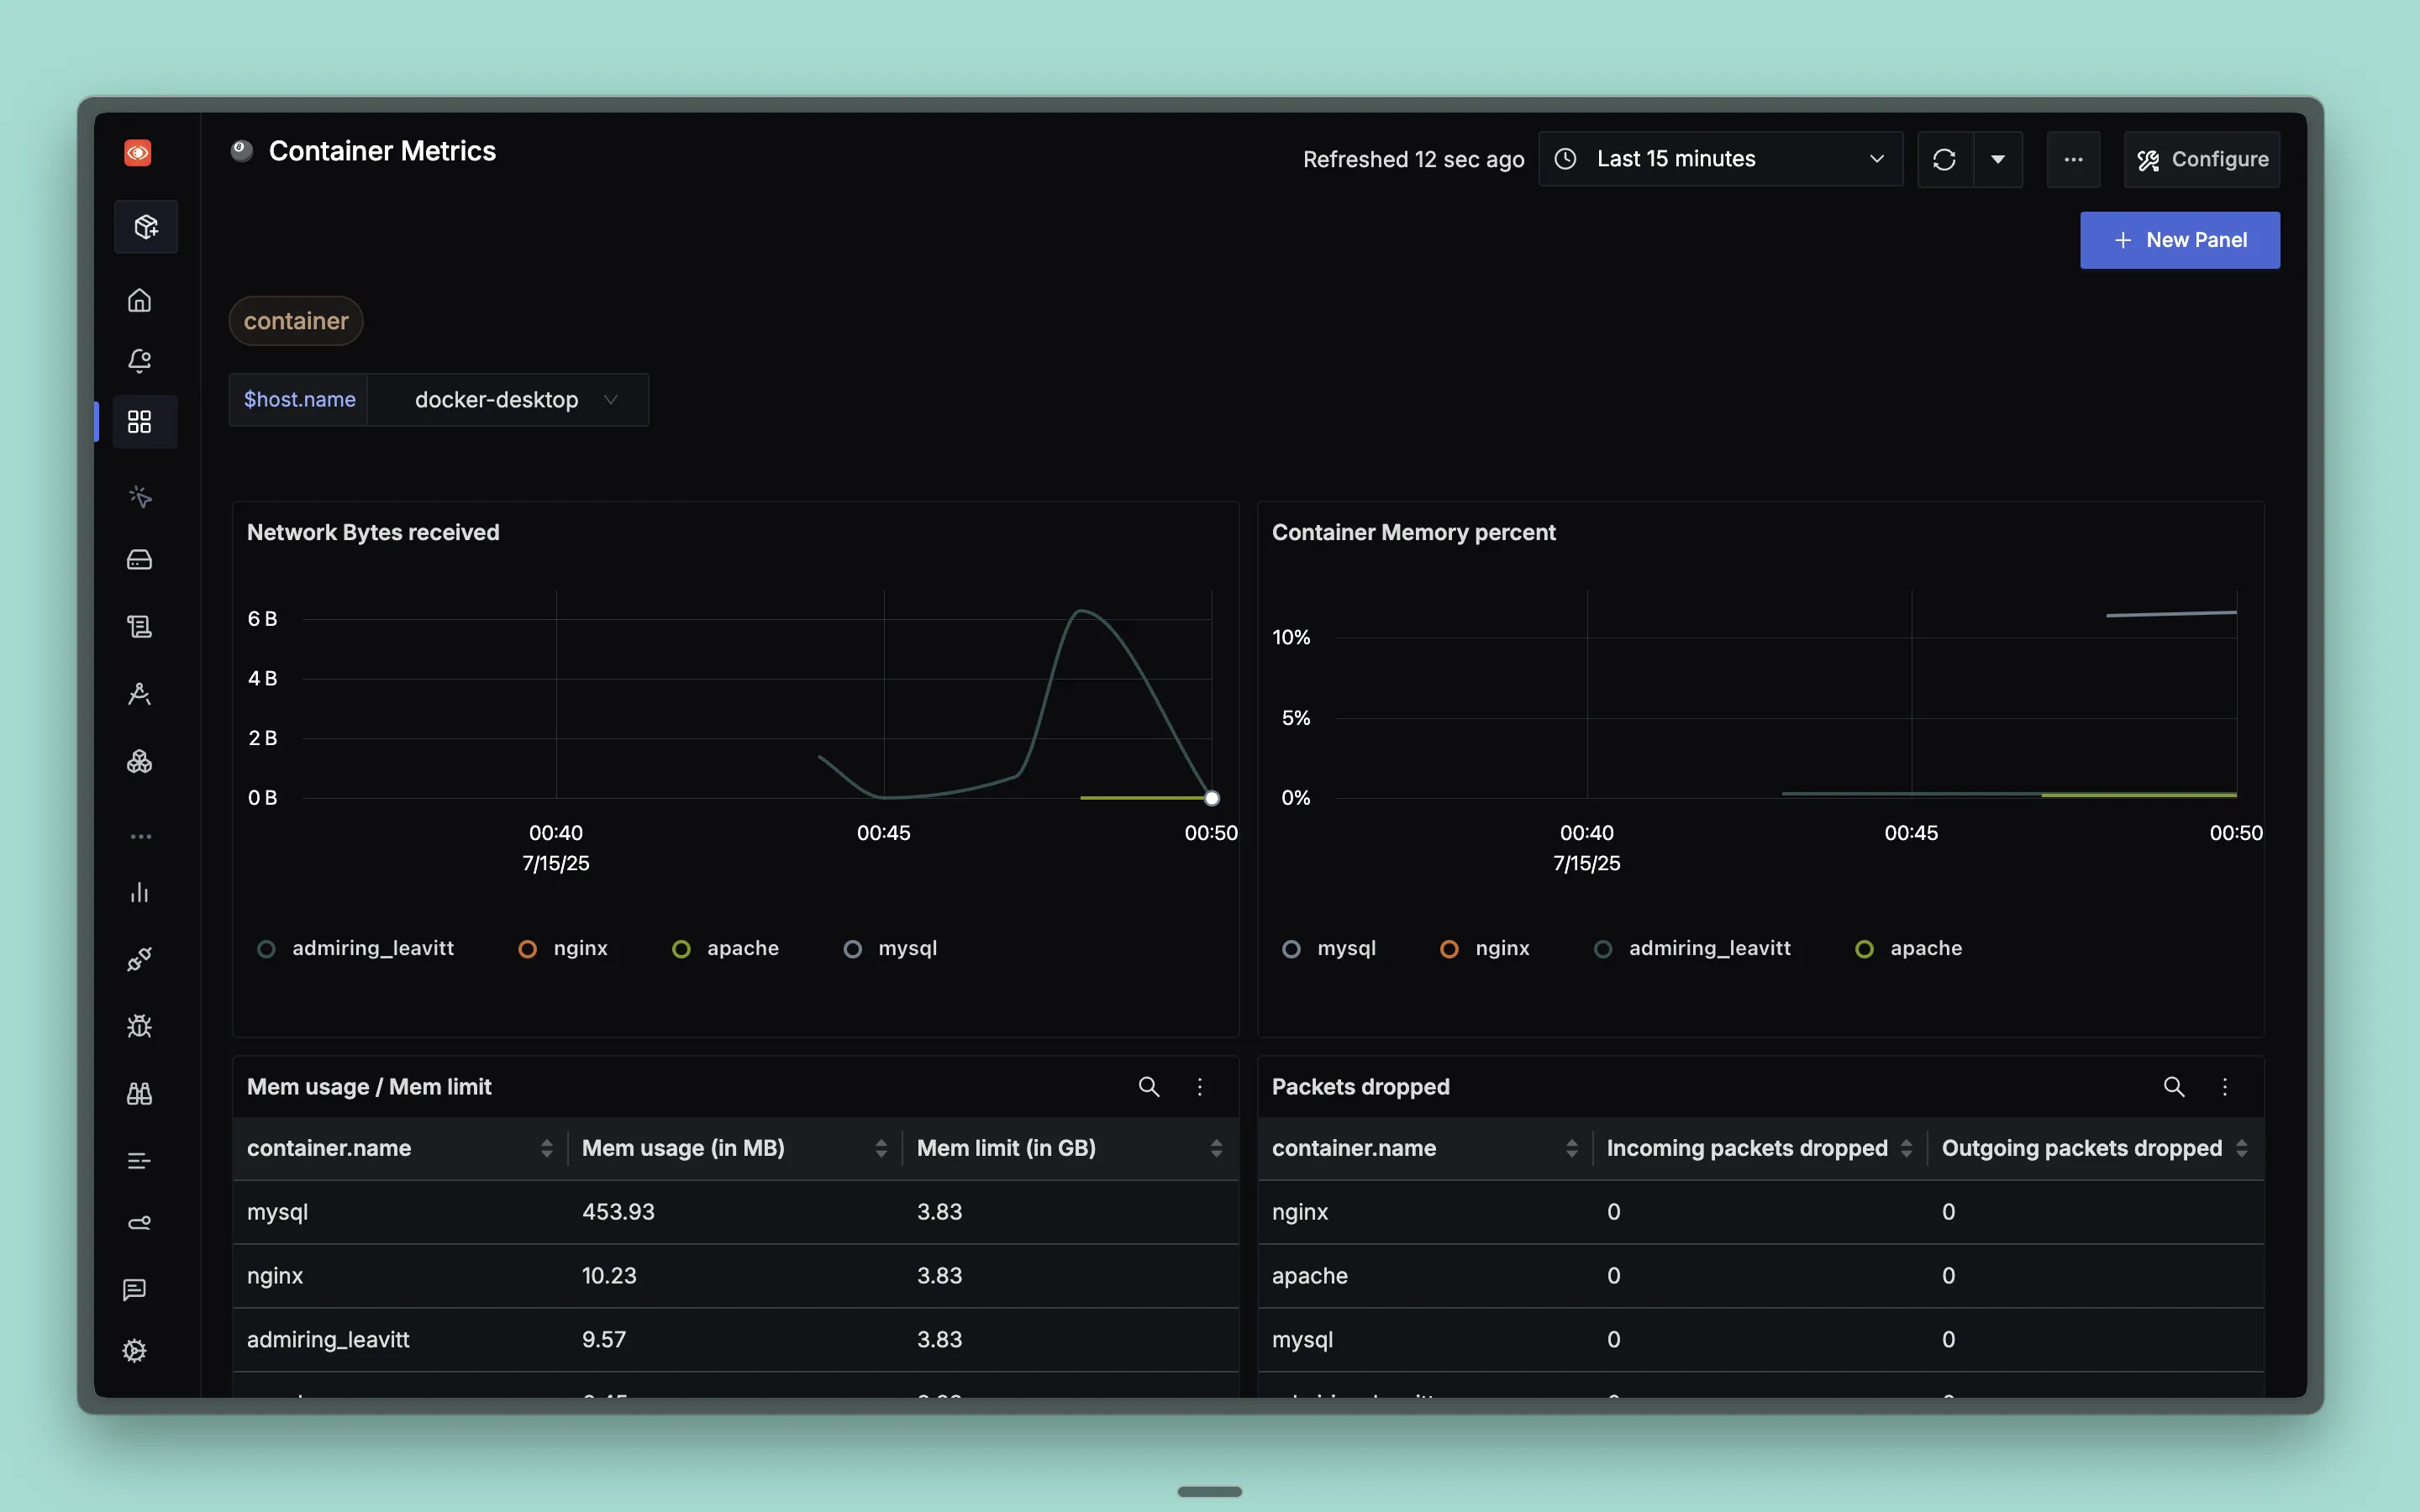
Dashboard Preview
Dashboards → + New dashboard → Import JSON
What This Dashboard Monitors
This dashboard tracks essential container metrics to help you:
- Monitor Resource Utilization: Track CPU and memory usage across all containers
- Analyze Network Performance: Monitor network traffic patterns and packet loss
- Track Storage Operations: Analyze disk I/O operations and performance
- Identify Resource Bottlenecks: Detect containers consuming excessive resources
- Optimize Container Allocation: Right-size container resource limits and requests
- Container Health Monitoring: Keep track of overall container performance and availability
Metrics Included
Resource Metrics
- Container CPU Percent: Shows CPU utilization percentage for each container over time
- Container Memory Percent: Shows memory utilization percentage for each container over time
Memory Analysis
- Mem Usage / Mem Limit Table: Shows memory usage (MB) and memory limits (GB) for each container
Network Metrics
- Network Bytes Received: Shows incoming network traffic in bytes for each container over time
- Network Bytes Sent: Shows outgoing network traffic in bytes for each container over time
- Packets Dropped Table: Shows incoming and outgoing packet drop counts for each container
Storage Metrics
- Block IO Table: Shows block I/O operations (read/write) and throughput for each container
Dashboard Variables
This dashboard includes pre-configured variables for filtering:
- host.name: Filter by specific host names to view containers on particular hosts
