This dashboard provides comprehensive monitoring of Go runtime performance and resource utilization, offering detailed visibility into memory usage, garbage collection, goroutine management, and heap allocation for optimal Go application monitoring.
To use this dashboard, you need to set up the data source and send telemetry to SigNoz. Follow the Go Metrics guide to get started.
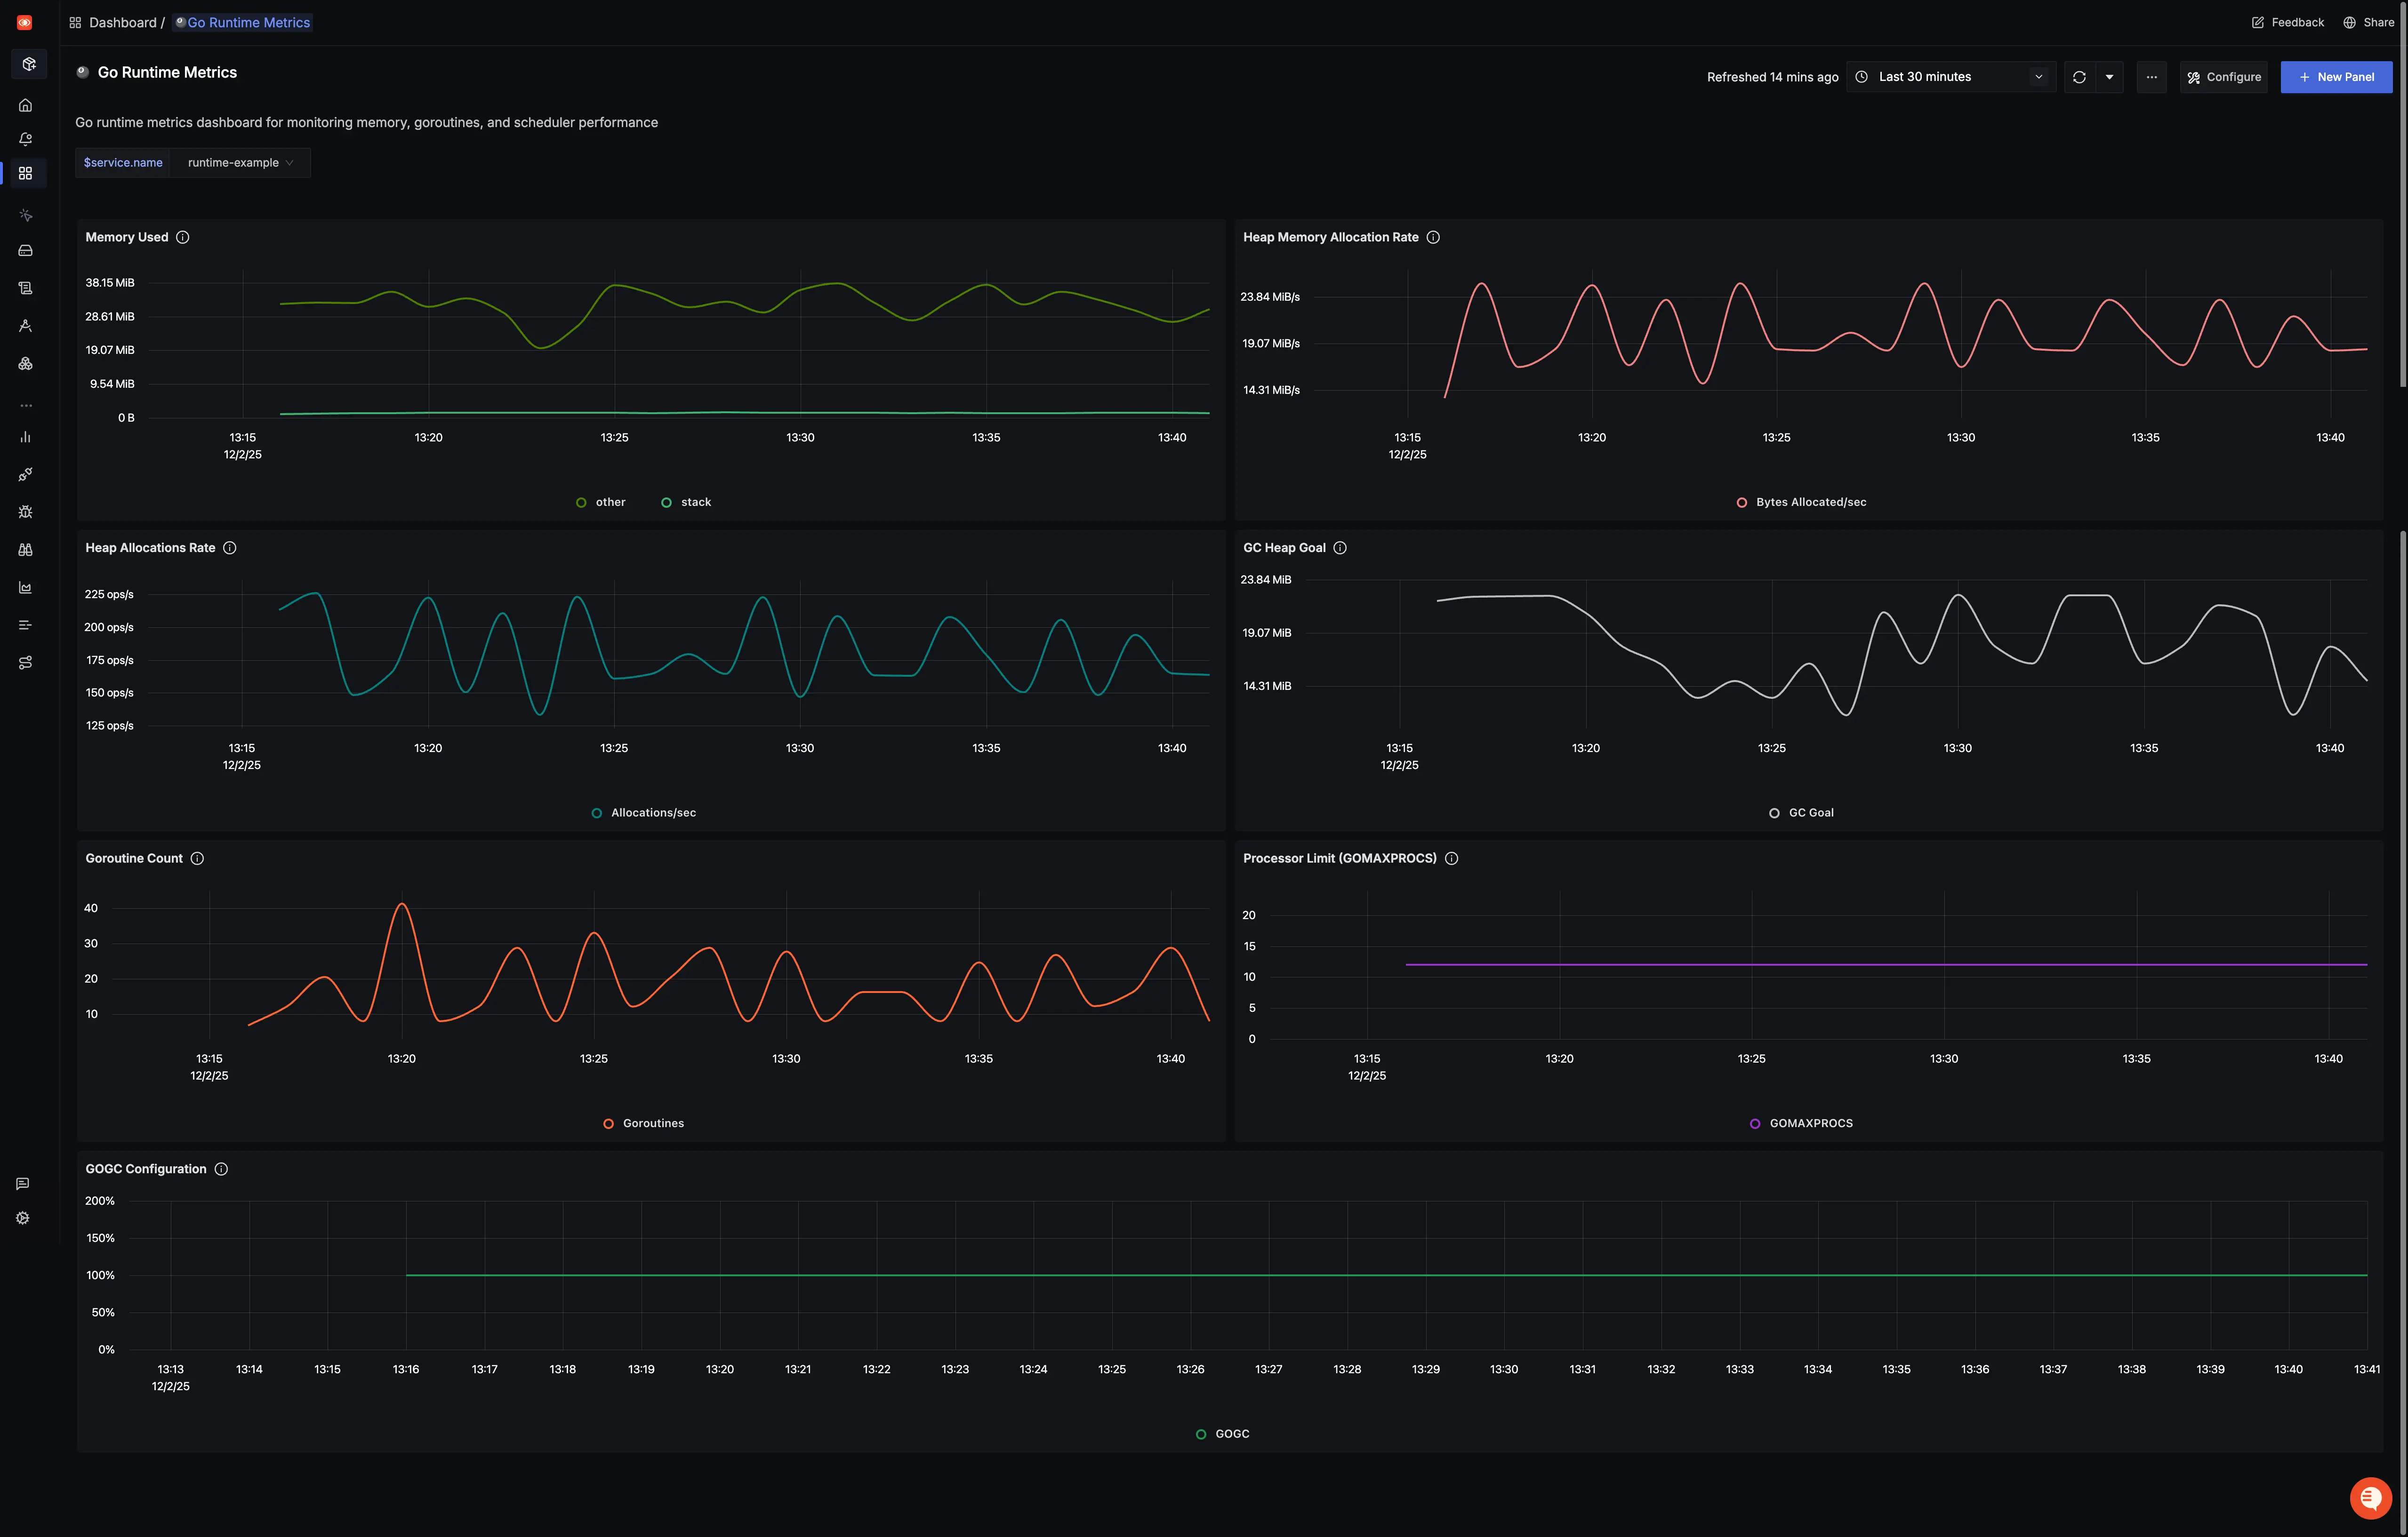
Dashboard Preview
Dashboards → + New dashboard → Import JSON
What This Dashboard Monitors
This dashboard tracks essential Go runtime metrics to help you:
- Monitor Memory Usage: Track heap and non-heap memory utilization
- Track Garbage Collection: Monitor GC frequency, duration, and heap size goals
- Monitor Goroutines: Track live goroutine counts for concurrency analysis
- Analyze Memory Allocations: Monitor allocation patterns and heap growth
- Track Processor Limits: Monitor available OS threads for Go code execution
- Performance Optimization: Identify memory leaks and optimize resource usage
- Resource Management: Monitor memory allocation efficiency and GC impact
Metrics Included
Memory Metrics
- Memory Used: Shows memory used by the Go runtime over time
- Memory Allocated: Shows memory allocated to the heap by the application over time
- Memory Allocations: Shows count of allocations to the heap over time
- GC Heap Goal: Shows heap size target for the end of the GC cycle over time
Concurrency Metrics
- Goroutine Count: Shows count of live goroutines over time
- Processor Limit: Shows the number of OS threads that can execute user-level Go code simultaneously
Configuration Metrics
- GOGC Configuration: Shows heap size target percentage configured by the user (default: 100)
Derived Metrics
- Memory Growth Rate: Shows rate of memory allocation change over time
- Goroutine Growth Rate: Shows rate of goroutine creation over time
- Allocation Rate: Shows rate of heap allocations per second
Dashboard Variables
This dashboard includes pre-configured variables for filtering:
- service.name: Filter by specific service name
