
This dashboard provides an overview for the Kubernetes pods for deployments, daemonsets, statefulset, replicasets and pods count by phase using k8sclusterreceiver.
This dashboard requires K8s Infra to be installed and configured to collect cluster metrics. See the K8s Infra installation guide to set up the data source.
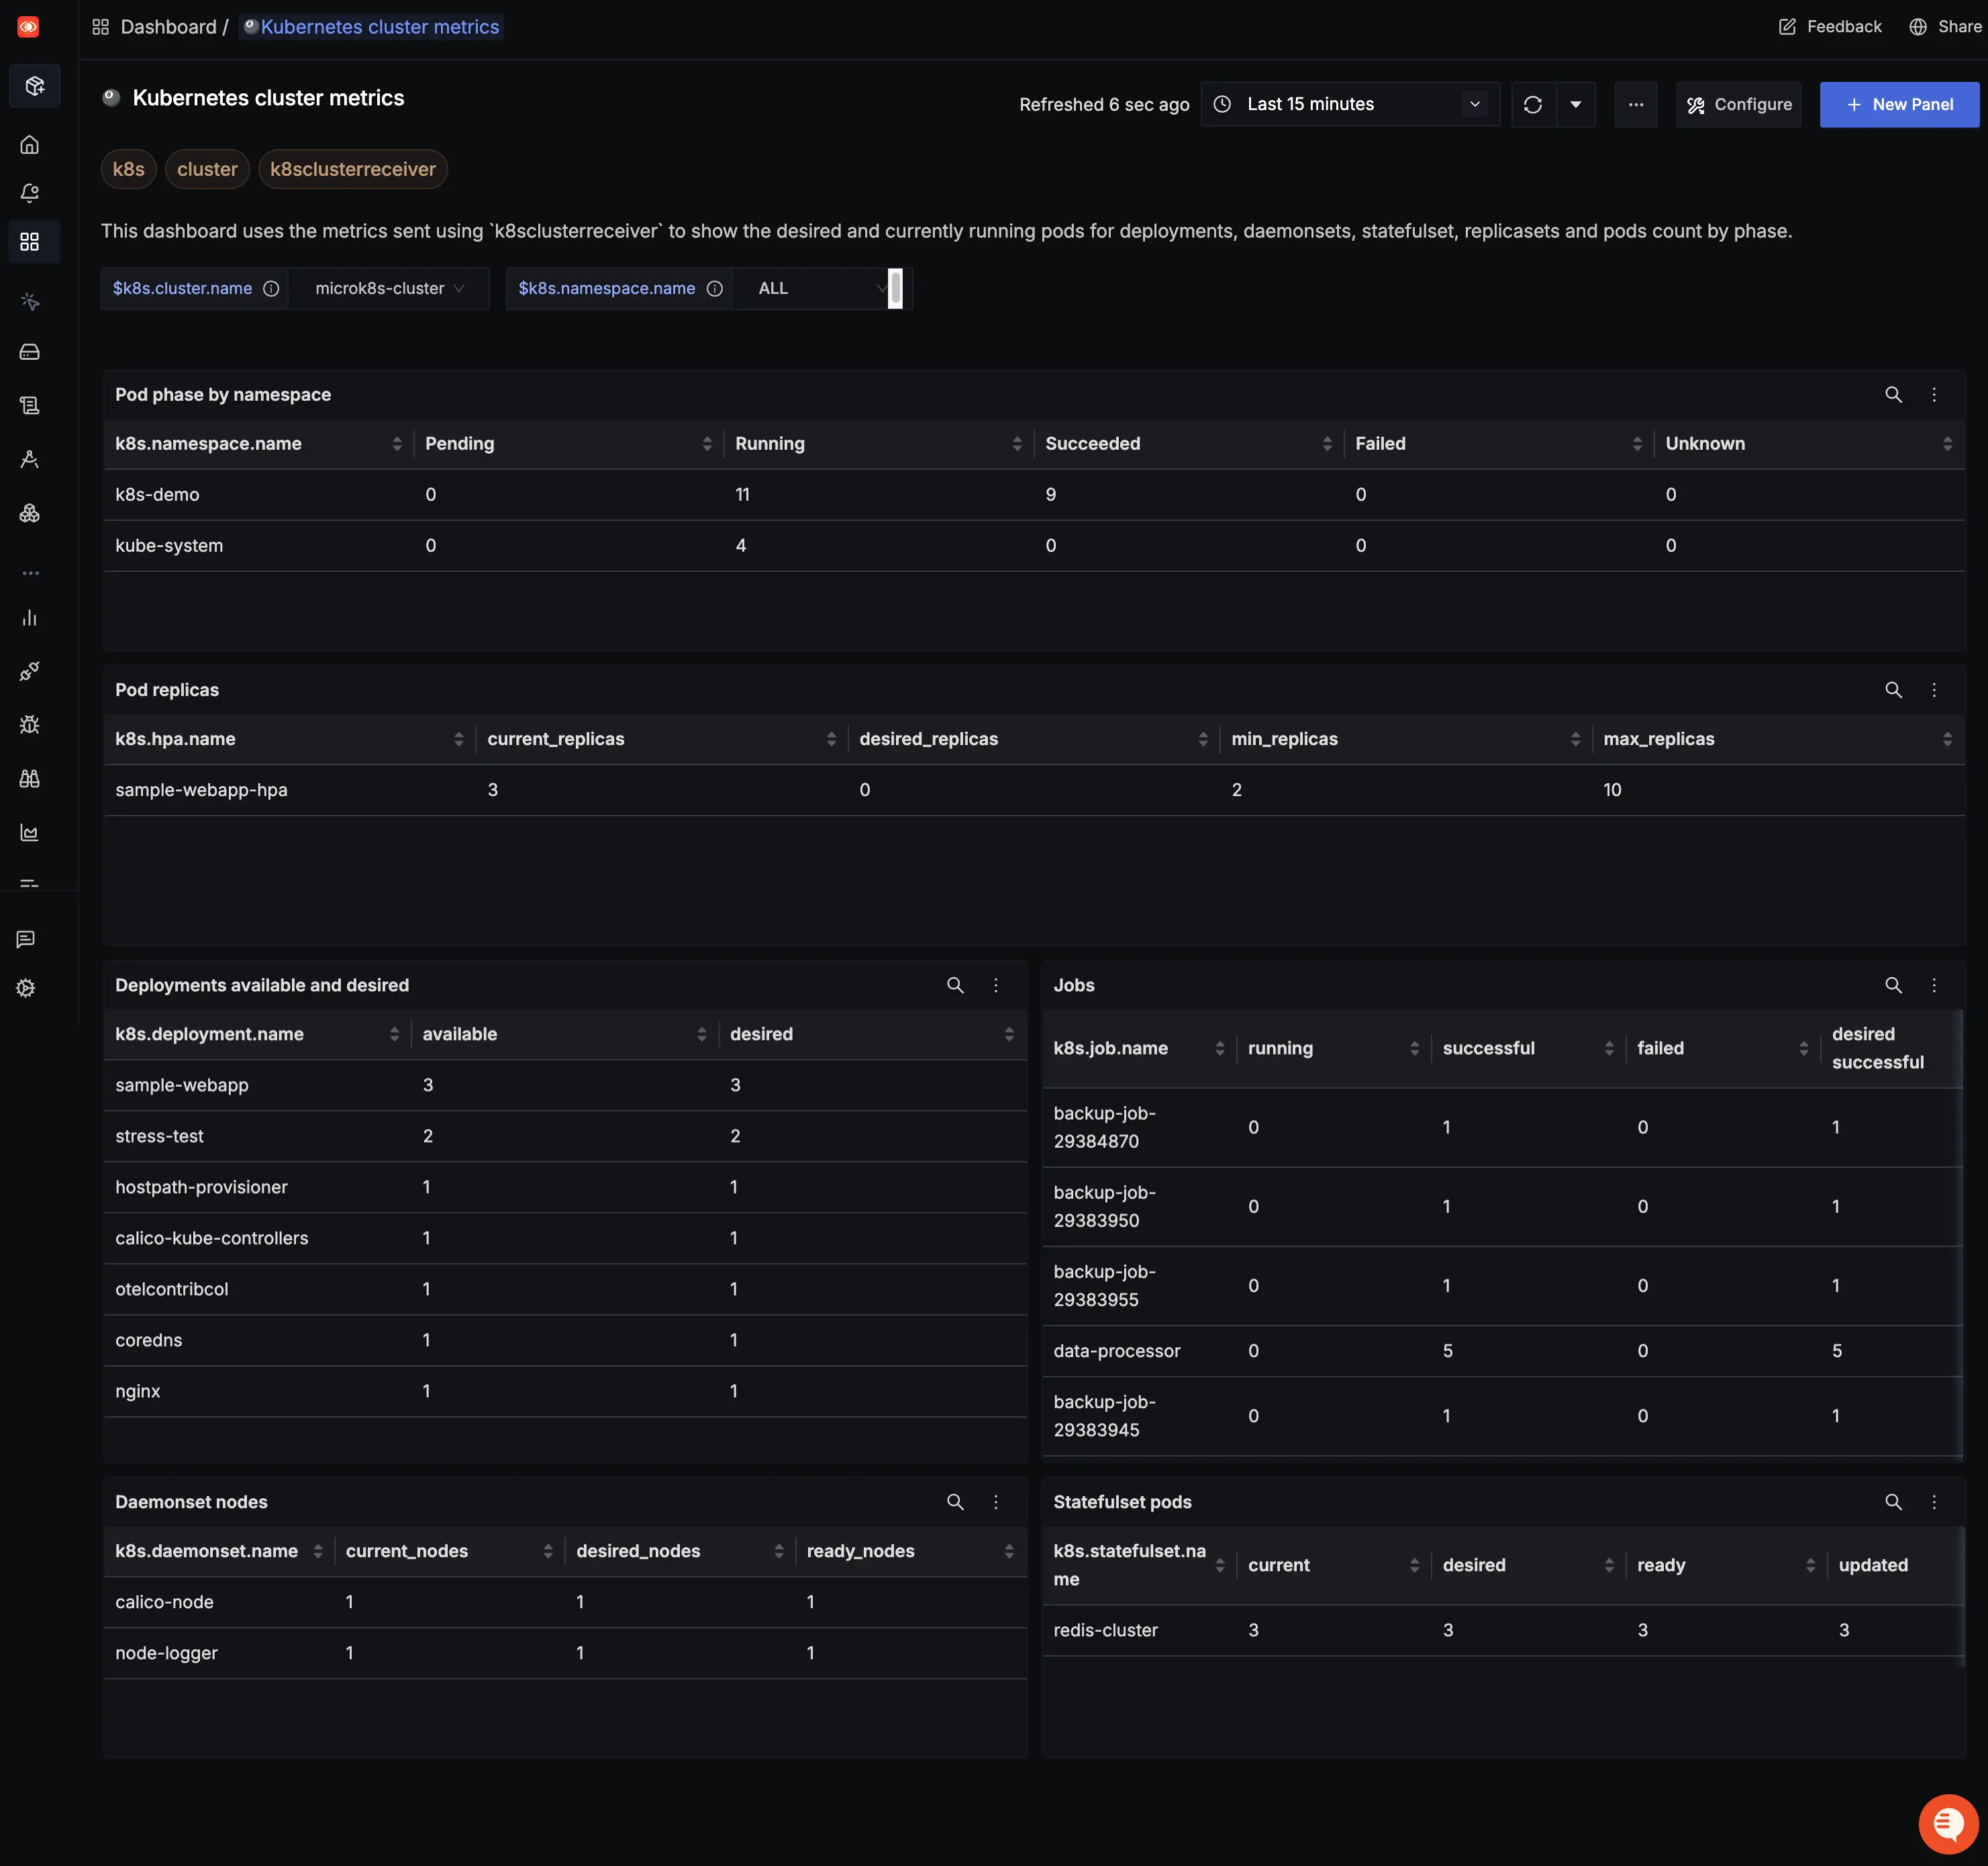
Dashboard Preview
Dashboards → + New dashboard → Import JSON
What This Dashboard Monitors
This dashboard tracks Kubernetes cluster metrics across different resource types:
Pod Phase by Namespace
Shows the distribution of pods across different lifecycle phases (Pending, Running, Succeeded, Failed, Unknown) grouped by namespace.
Pod Replicas
Monitors Horizontal Pod Autoscaler (HPA) metrics including current replicas, desired replicas, minimum replicas, and maximum replicas.
Deployments Available and Desired
Displays the number of available pods versus desired pods for each deployment.
Jobs
Tracks job execution status showing active pods, successful pods, failed pods, and desired successful pods for each job.
Daemonset Nodes
Monitors daemonset distribution across nodes, showing current scheduled nodes, desired scheduled nodes, and ready nodes.
Statefulset Pods
Tracks statefulset health with metrics for current pods, desired pods, ready pods, and updated pods.
Metrics Used
The dashboard utilizes these metrics from the k8sclusterreceiver:
k8s.pod.phase: Pod lifecycle phase statusk8s.deployment.available: Number of available deployment podsk8s.deployment.desired: Number of desired deployment podsk8s.hpa.current_replicas: Current HPA replica countk8s.hpa.desired_replicas: Desired HPA replica countk8s.hpa.min_replicas: Minimum HPA replicask8s.hpa.max_replicas: Maximum HPA replicask8s.daemonset.current_scheduled_nodes: Currently scheduled daemonset nodesk8s.daemonset.desired_scheduled_nodes: Desired daemonset nodesk8s.daemonset.ready_nodes: Ready daemonset nodesk8s.statefulset.current_pods: Current statefulset podsk8s.statefulset.desired_pods: Desired statefulset podsk8s.statefulset.ready_pods: Ready statefulset podsk8s.statefulset.updated_pods: Updated statefulset podsk8s.job.active_pods: Active job podsk8s.job.successful_pods: Successful job podsk8s.job.failed_pods: Failed job podsk8s.job.desired_successful_pods: Desired successful job pods
Dashboard Variables
This dashboard includes two template variables for filtering:
k8s.cluster.name: Filter by specific Kubernetes cluster (single selection)k8s.namespace.name: Filter by one or multiple namespaces (multi-select enabled, defaults to "default")