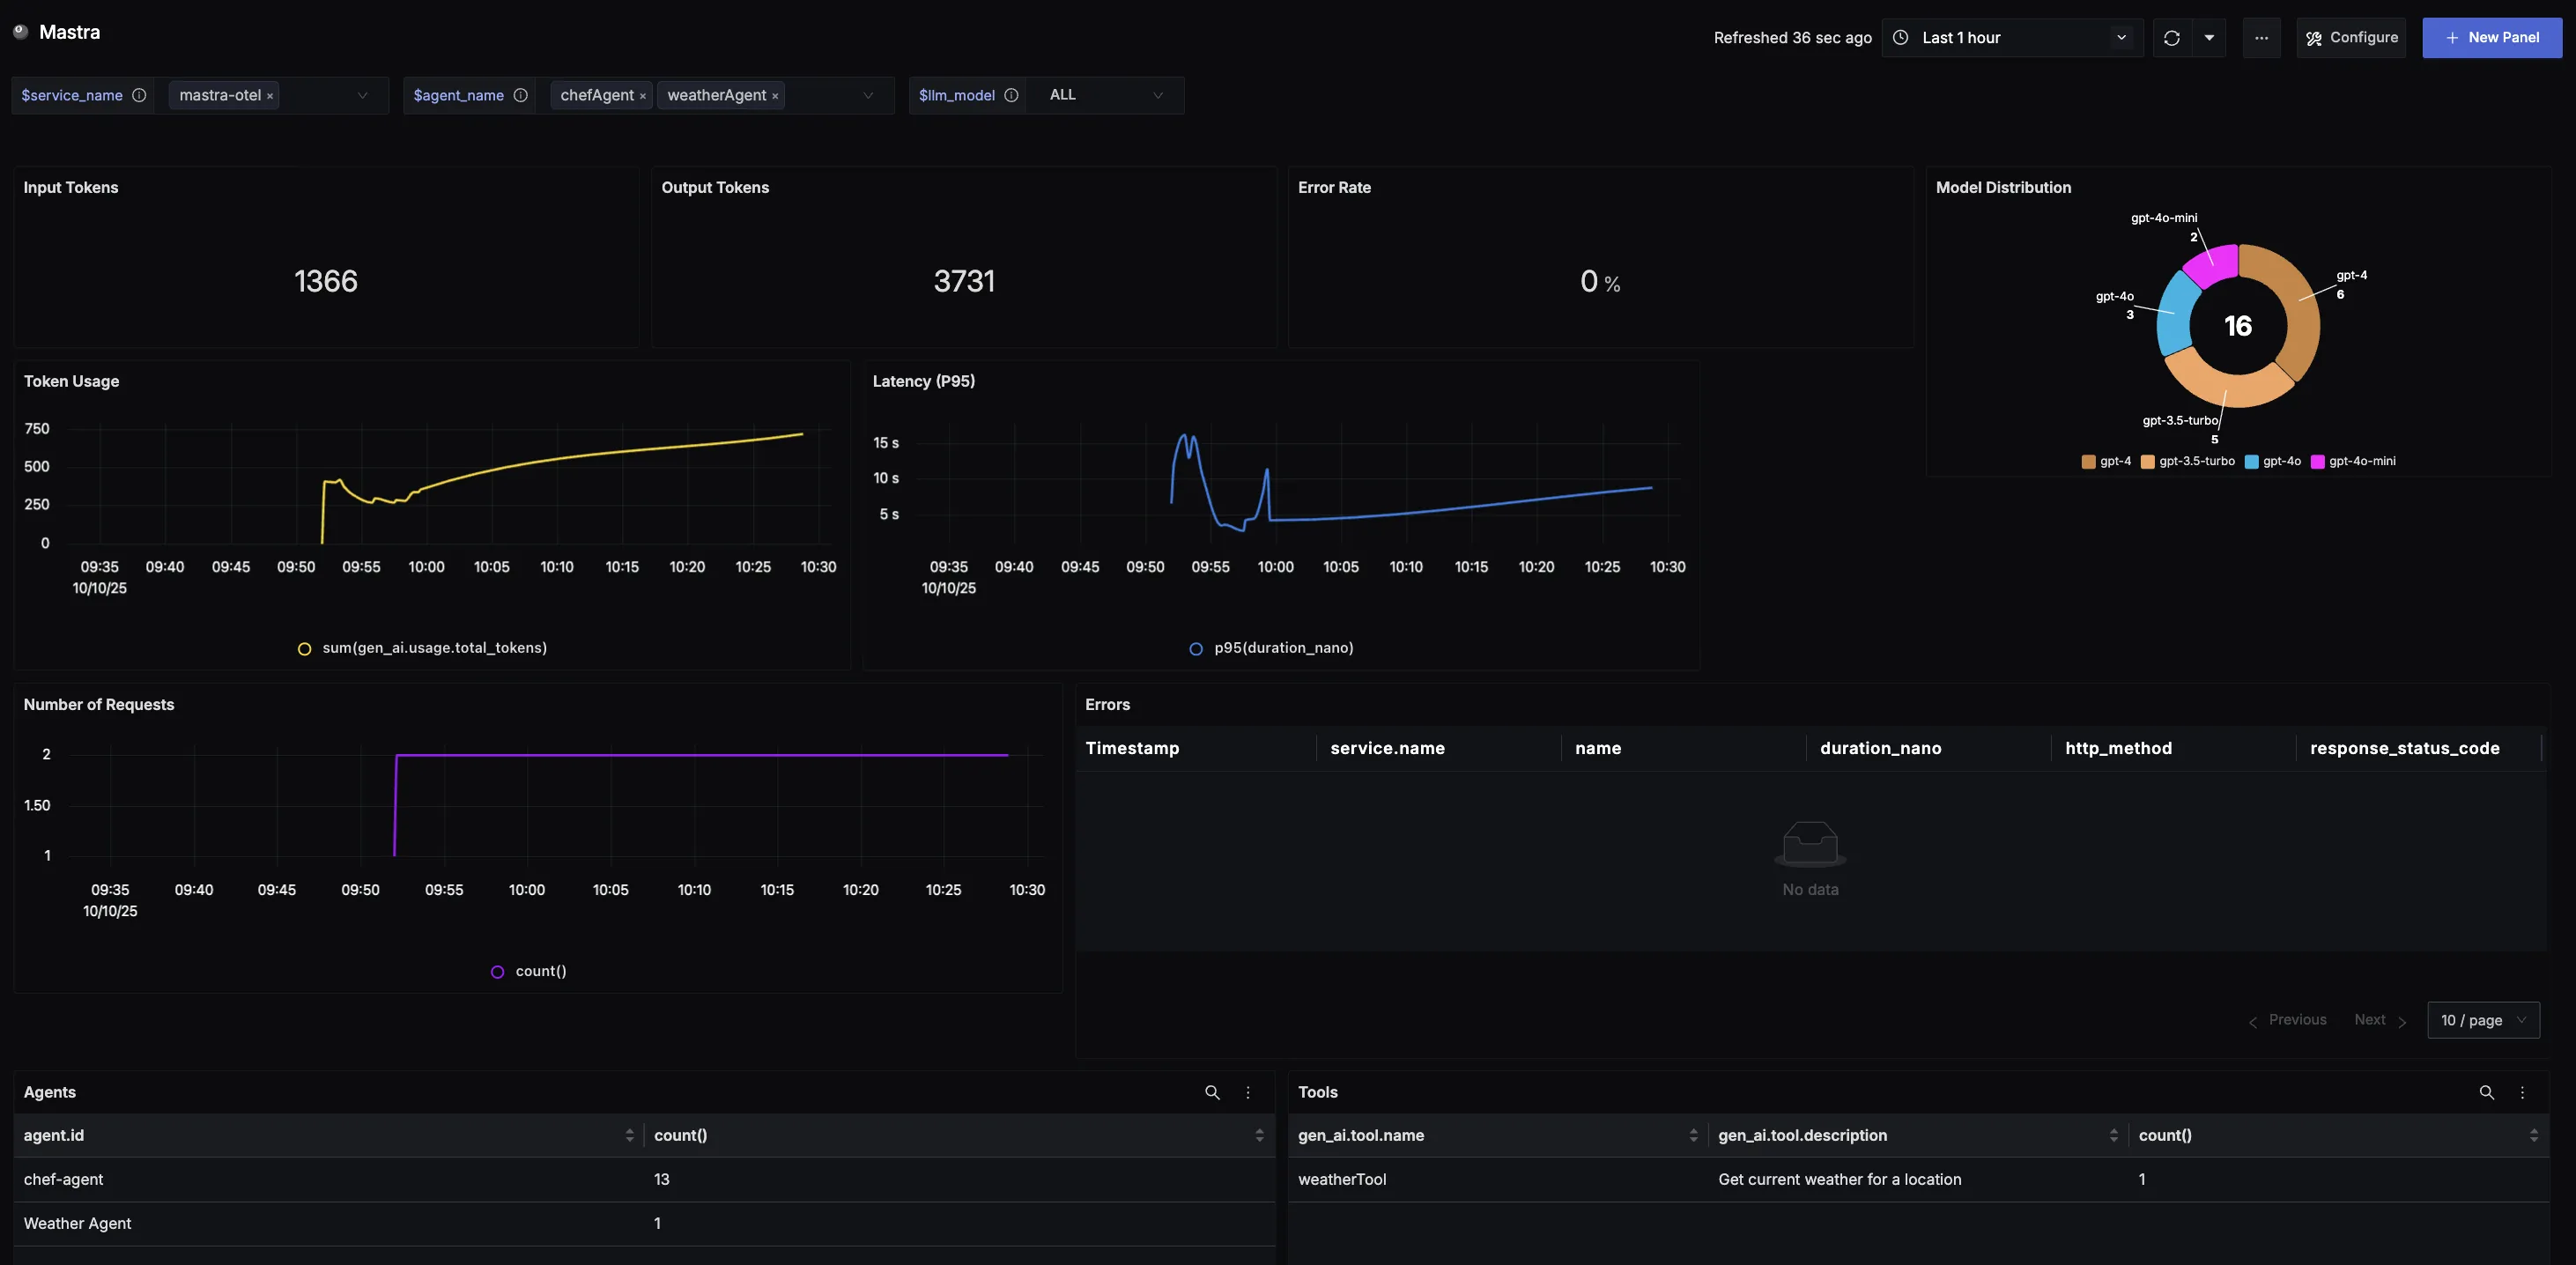
This dashboard offers a clear view into Mastra usage and performance. It highlights key metrics such as token consumption, model distribution, error rates, request volumes, and latency trends.
📝 Note
To use this dashboard, you need to set up the data source and send telemetry to SigNoz. Follow the Mastra Observability guide to get started.
Dashboard Preview

Dashboards → + New dashboard → Import JSON
What This Dashboard Monitors
This dashboard tracks critical performance metrics for your Mastra usage using OpenTelemetry to help you:
- Monitor Token Consumption: Track input tokens (user prompts) and output tokens (model responses) to monitor system workload, efficiency trends, and consumption across different workloads.
- Track Reliability: Monitor error rates to identify reliability issues and ensure applications maintain a smooth, dependable experience.
- Analyze Model Adoption: Understand which Mastra model variants are being used most often to track preferences and measure adoption of newer releases.
- Monitor Usage Patterns: Observe token consumption and request volume trends over time to spot adoption curves, peak cycles, and unusual spikes.
- Ensure Responsiveness: Track P95 latency to surface potential slowdowns, spikes, or regressions and maintain consistent user experience.
- Understand Service Distribution: See which services and programming languages are leveraging the Mastra across your stack.
- Track Agent Activity: Monitor which agents are being invoked to understand agent utilization patterns and identify the most active agents in your workflows.
- Analyze Tool Usage: Track which tools are being called to understand tool adoption, usage patterns, and optimize your tool ecosystem.
Metrics Included
Token Usage Metrics
- Total Token Usage (Input & Output): Displays the split between input tokens (user prompts) and output tokens (model responses), showing exactly how much work the system is doing over time.
- Token Usage Over Time: Time series visualization showing token consumption trends to identify adoption patterns, peak cycles, and baseline activity.
Performance & Reliability
- Total Error Rate: Tracks the percentage of Mastra calls that return errors, providing a quick way to identify reliability issues.
- Latency (P95 Over Time): Measures the 95th percentile latency of requests over time to surface potential slowdowns and ensure consistent responsiveness.
Usage Analysis
- Model Distribution: Shows which llm model variants are being called most often, helping track preferences and measure adoption across different models.
- Requests Over Time: Captures the volume of requests sent to Mastra over time, revealing demand patterns and high-traffic windows.
Error Tracking
- Error Records: Table logging all recorded errors with clickable records that link to the originating trace for detailed error investigation.
Agent & Tool Analytics
- List of Agents Being Used: Displays all active agents in your system, showing which agents are being invoked most frequently to help optimize agent workflows and resource allocation.
- List of Tool Calls Being Used: Shows all tools being called across your Mastra workflows, providing visibility into tool adoption patterns and usage frequency to identify optimization opportunities.
