
This dashboard provides comprehensive monitoring of MySQL database performance and resource utilization, offering detailed visibility into connections, locks, buffer pool operations, table I/O events, and various database metrics.
To use this dashboard, you need to set up the data source and send telemetry to SigNoz. Follow the MySQL Metrics guide to get started.
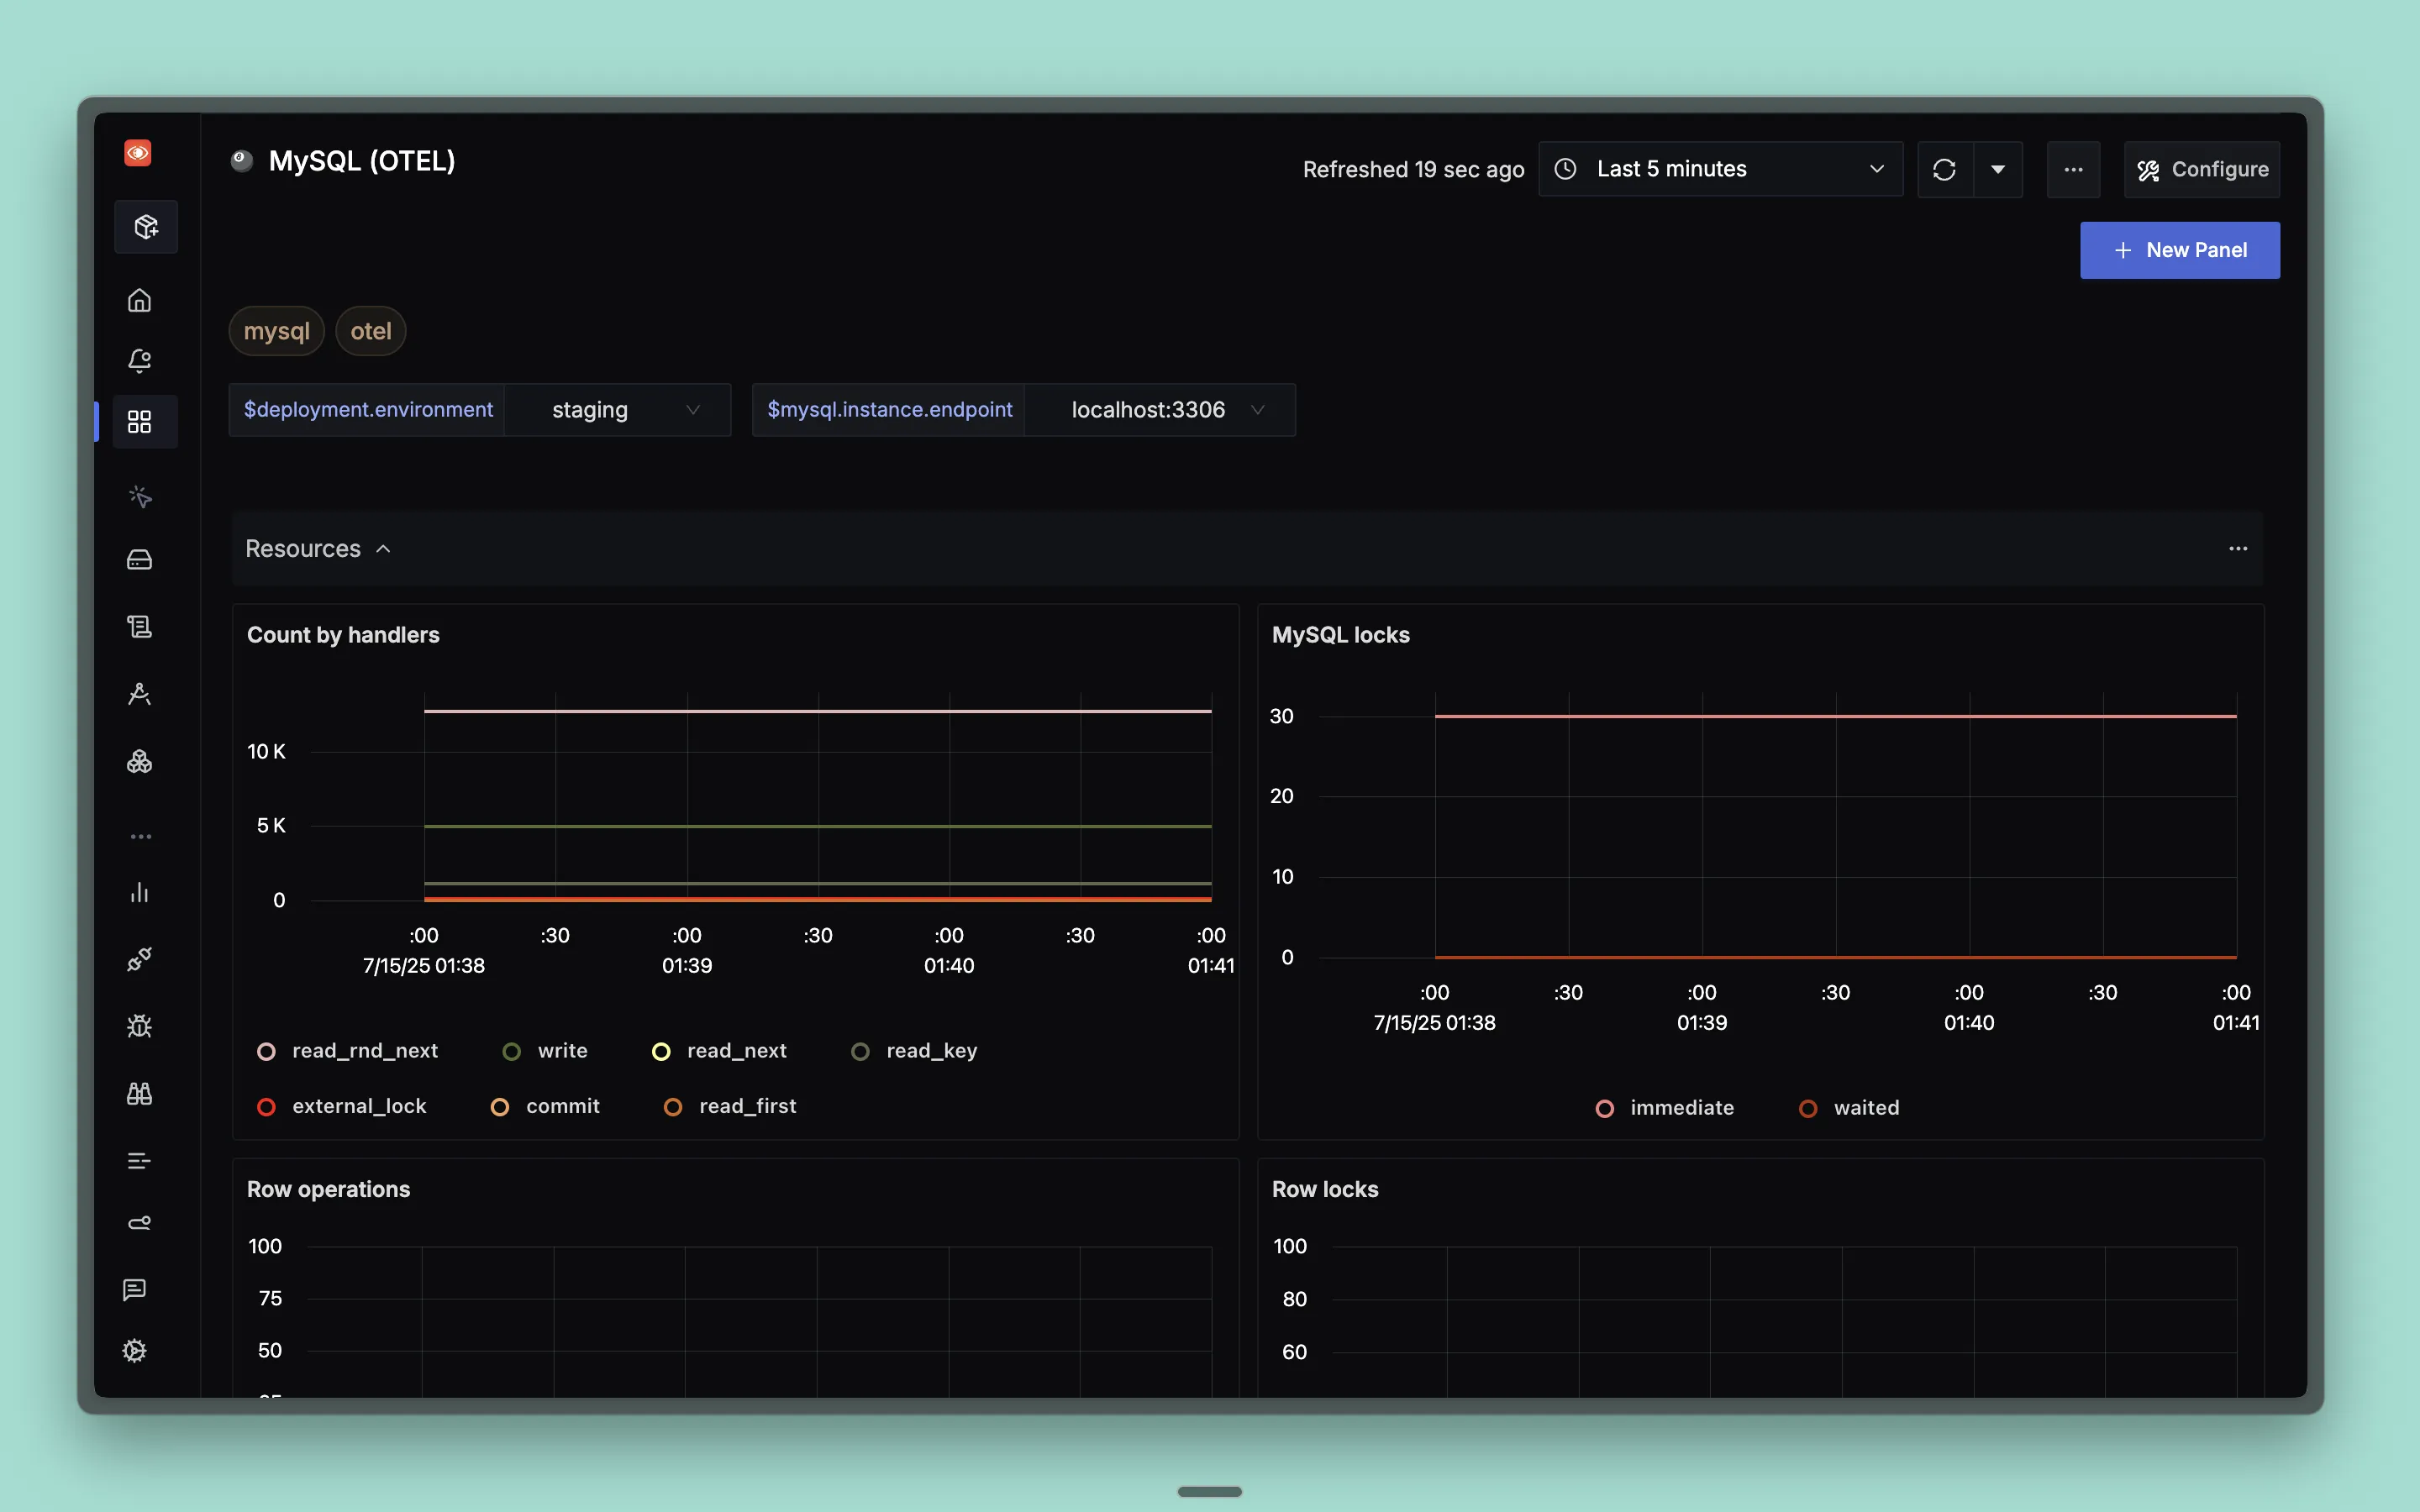
Dashboard Preview
Dashboards → + New dashboard → Import JSON
What This Dashboard Monitors
This dashboard tracks essential MySQL metrics to help you:
- Monitor Connection Health: Track database connections and connection errors
- Analyze Lock Performance: Monitor MySQL locks and row-level locking behavior
- Track Buffer Pool Usage: Analyze InnoDB buffer pool efficiency and page management
- Monitor Table I/O Operations: Track table-level I/O wait events and performance
- Analyze Resource Utilization: Monitor threads, handlers, and prepared statements
- Database Performance Optimization: Identify bottlenecks and optimize database operations
Metrics Included
Connection Metrics
- Connection/Errors: Shows database connection count and connection errors over time
Performance Metrics
- Count by Handlers: Shows MySQL handler operations count by type over time
- Row Operations: Shows row-level operations (read, insert, delete, update) over time
- Count of Operations: Shows count of database operations by operation type
Lock Metrics
- MySQL Locks: Shows MySQL lock types (immediate, waited) over time
- Row Locks: Shows InnoDB row lock operations (waits, time) over time
Resource Metrics
- Open Resources Count: Shows count of open MySQL resources by type over time
- Thread Type Count: Shows MySQL thread counts by thread type (running, connected, created, cached)
- Prepared Statement Count: Shows prepared statement counts by command type
Storage Metrics
- InnoDB Log Operations: Shows InnoDB log operations count by operation type
Buffer Pool Metrics
- Buffer Pool Usage by Status: Shows buffer pool memory usage by status (clean, dirty) over time
- Data Pages by Status: Shows buffer pool data pages by status (clean, dirty) over time
- Buffer Pool Pages by Kind: Shows buffer pool pages count by page kind over time
- Total Buffer Pool Page Flushes: Shows total count of buffer pool page flush operations over time
Table I/O Metrics
- Count of Table I/O Wait Events: Shows count of table I/O wait events by table
- Table I/O Wait Events Time: Shows time spent in table I/O wait events by table
Dashboard Variables
This dashboard includes pre-configured variables for filtering:
- deployment.environment: Filter by deployment environment
- mysql.instance.endpoint: Filter by specific MySQL instance endpoints