📝 Note
To use this dashboard, you need to set up the data source and send telemetry to SigNoz. Follow the PostgreSQL Integration guide to get started.
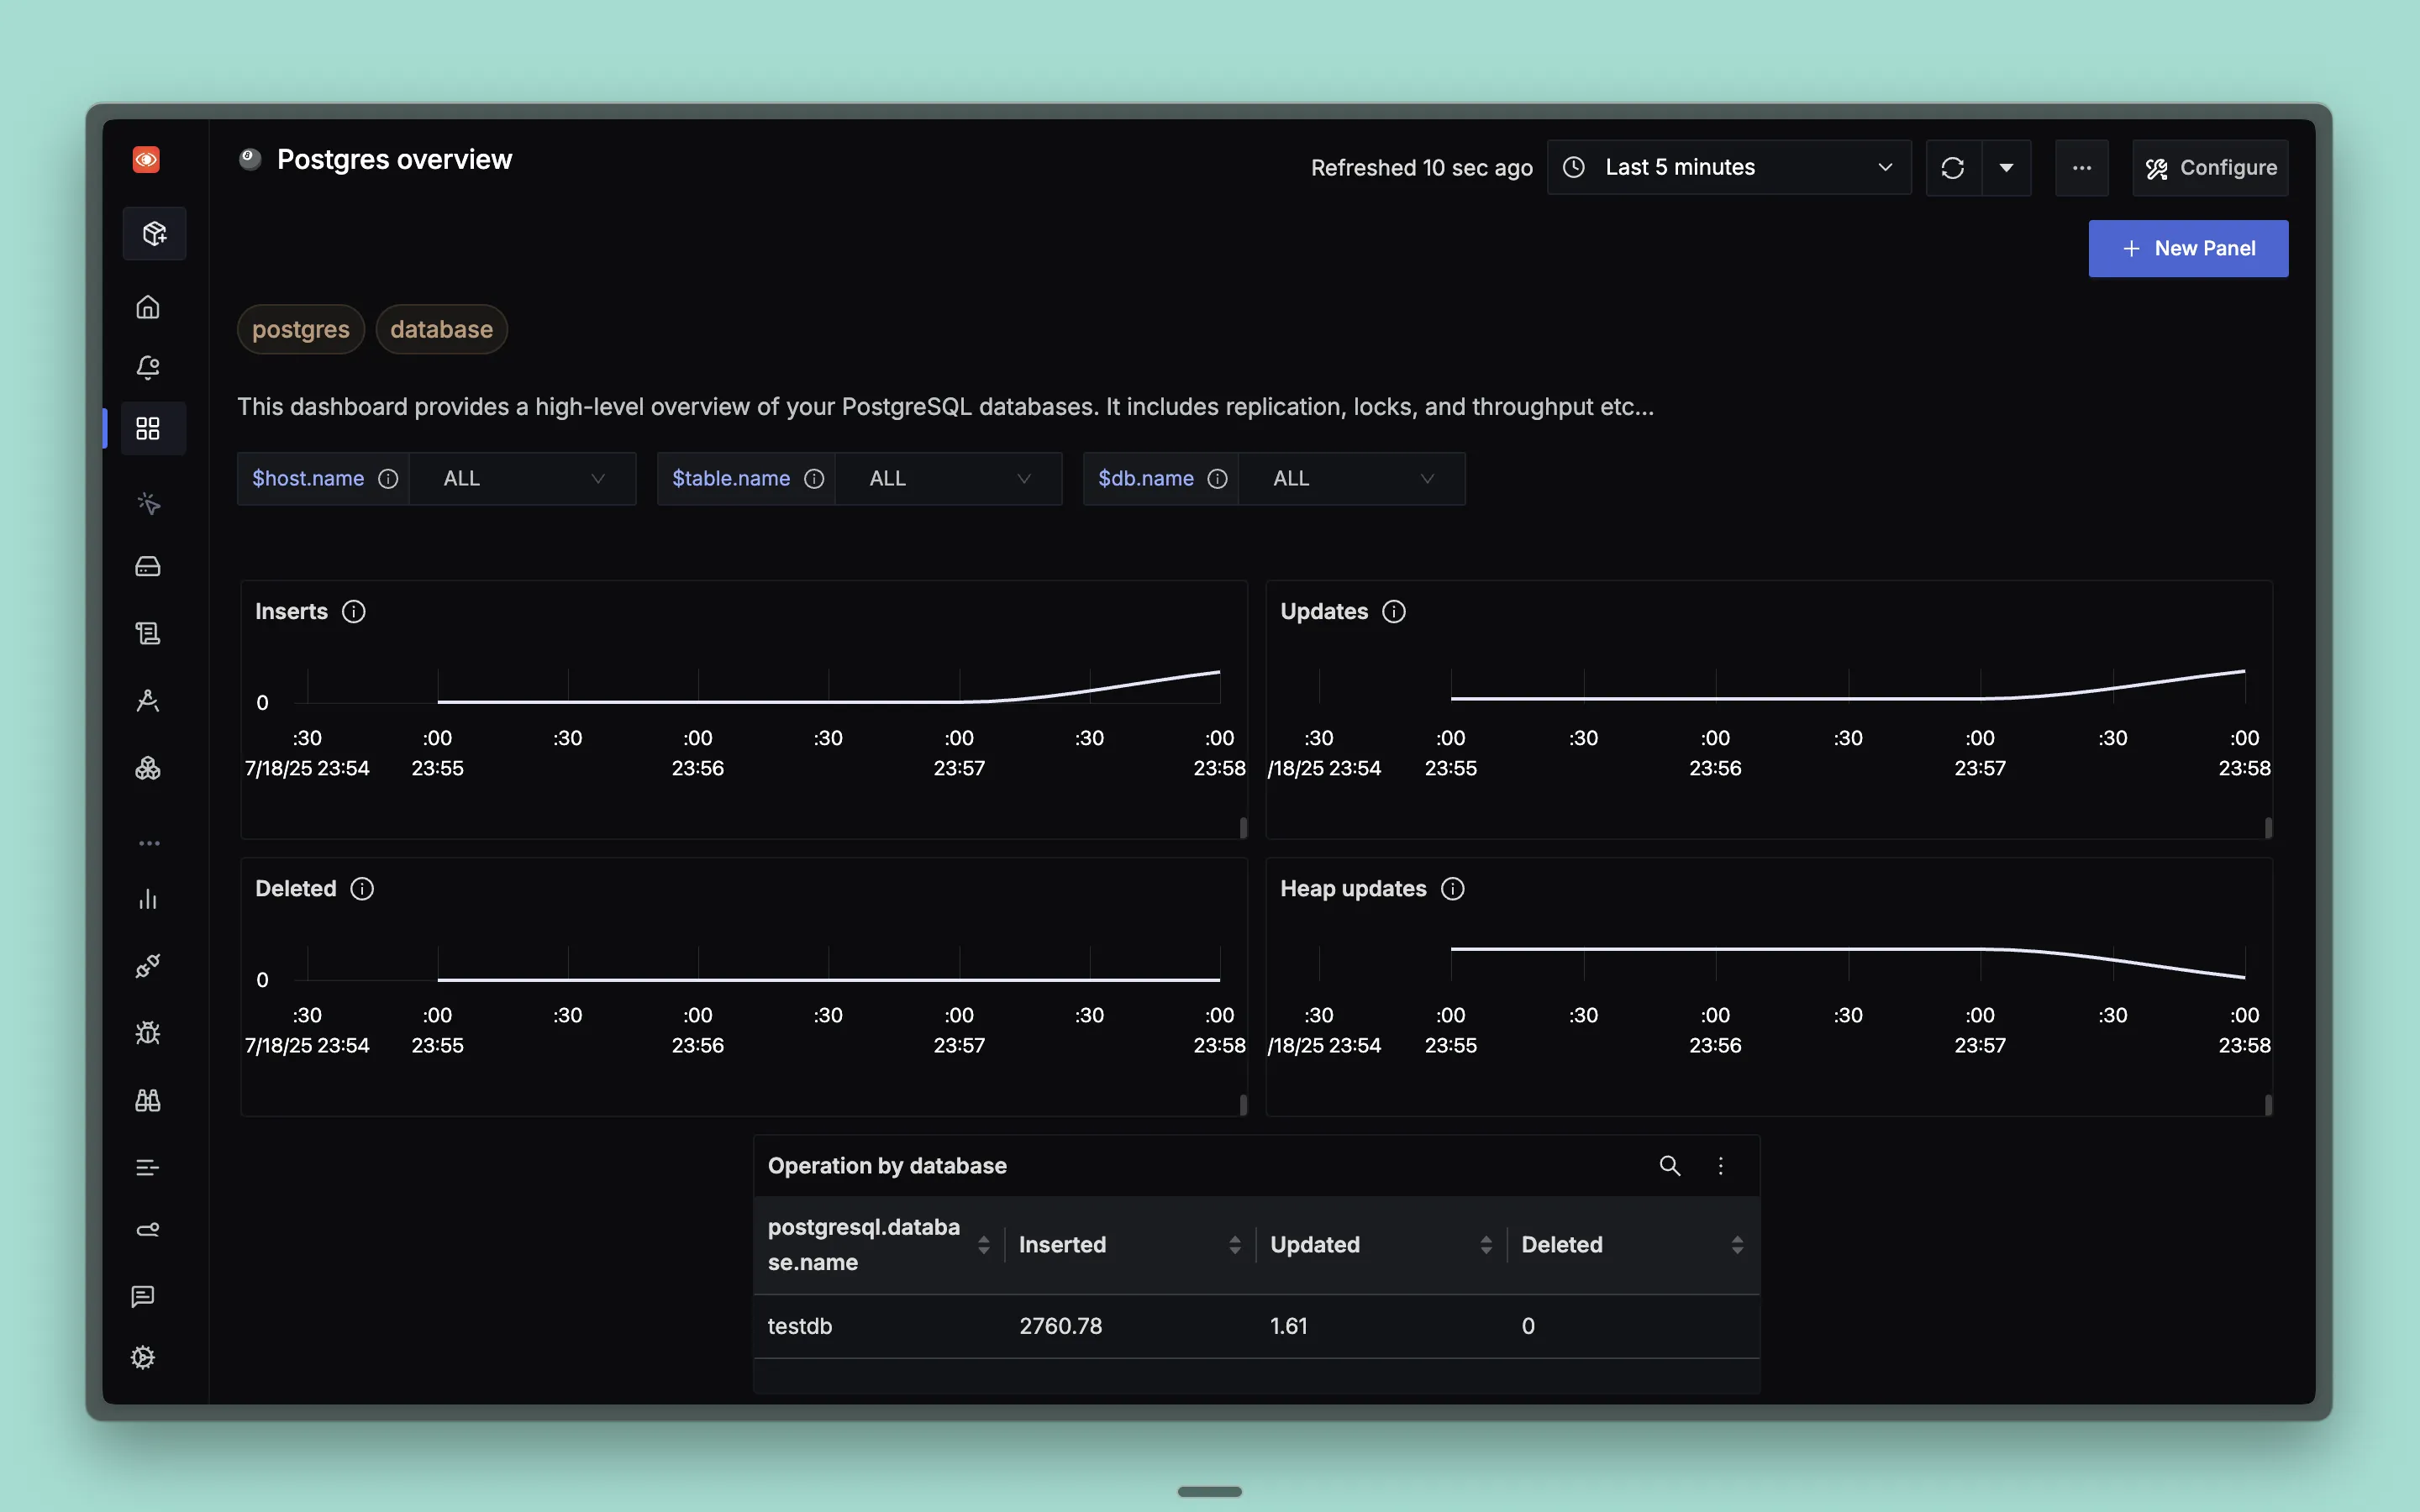
This dashboard provides a high-level overview of your PostgreSQL databases, including replication, locks, throughput, and comprehensive database performance metrics for optimal PostgreSQL monitoring and management.
Dashboard Preview
Dashboards → + New dashboard → Import JSON
What This Dashboard Monitors
This dashboard tracks essential PostgreSQL metrics to help you:
- Monitor Database Operations: Track insert, update, delete, and heap update operations
- Analyze Connection Management: Monitor database connections and backend processes
- Track Lock Activity: Monitor database locks and deadlock occurrences
- Table Performance: Monitor table statistics, dead rows, and live rows
- Index Efficiency: Track index scans and index performance
- Performance Optimization: Identify bottlenecks and optimize database performance
- Database Health: Monitor overall database health and throughput
Metrics Included
Operation Metrics
- Inserts: Shows average number of database insert operations over time by database
- Updates: Shows average number of database update operations over time by database
- Deleted: Shows average number of database delete operations over time by database
- Heap updates: Shows average number of database heap-only update operations over time by database
- Operation by database: Table showing insert, update, and delete operation counts grouped by database
Connection & Lock Metrics
- Connections per db: Shows number of backend connections per database over time
- Locks by lock mode: Shows number of database locks grouped by lock mode over time
- Deadlocks count: Shows rate of database deadlocks by database over time
Table & Index Metrics
- Dead rows: Shows number of dead rows across selected tables over time
- Index scans by index: Shows rate of index scans grouped by index name over time
- Table stats: Comprehensive table showing dead rows, live rows, index scans, and table size by table name
Dashboard Variables
This dashboard includes pre-configured variables for filtering:
- host.name: Filter by specific host sending PostgreSQL metrics (multi-select)
- db.name: Filter by specific database names (multi-select)
- table.name: Filter by specific table names (multi-select)
