✅ Info
Before using this dashboard, instrument your Semantic Kernel applications with OpenTelemetry and configure export to SigNoz. See the Semantic Kernel observability guide for complete setup instructions.
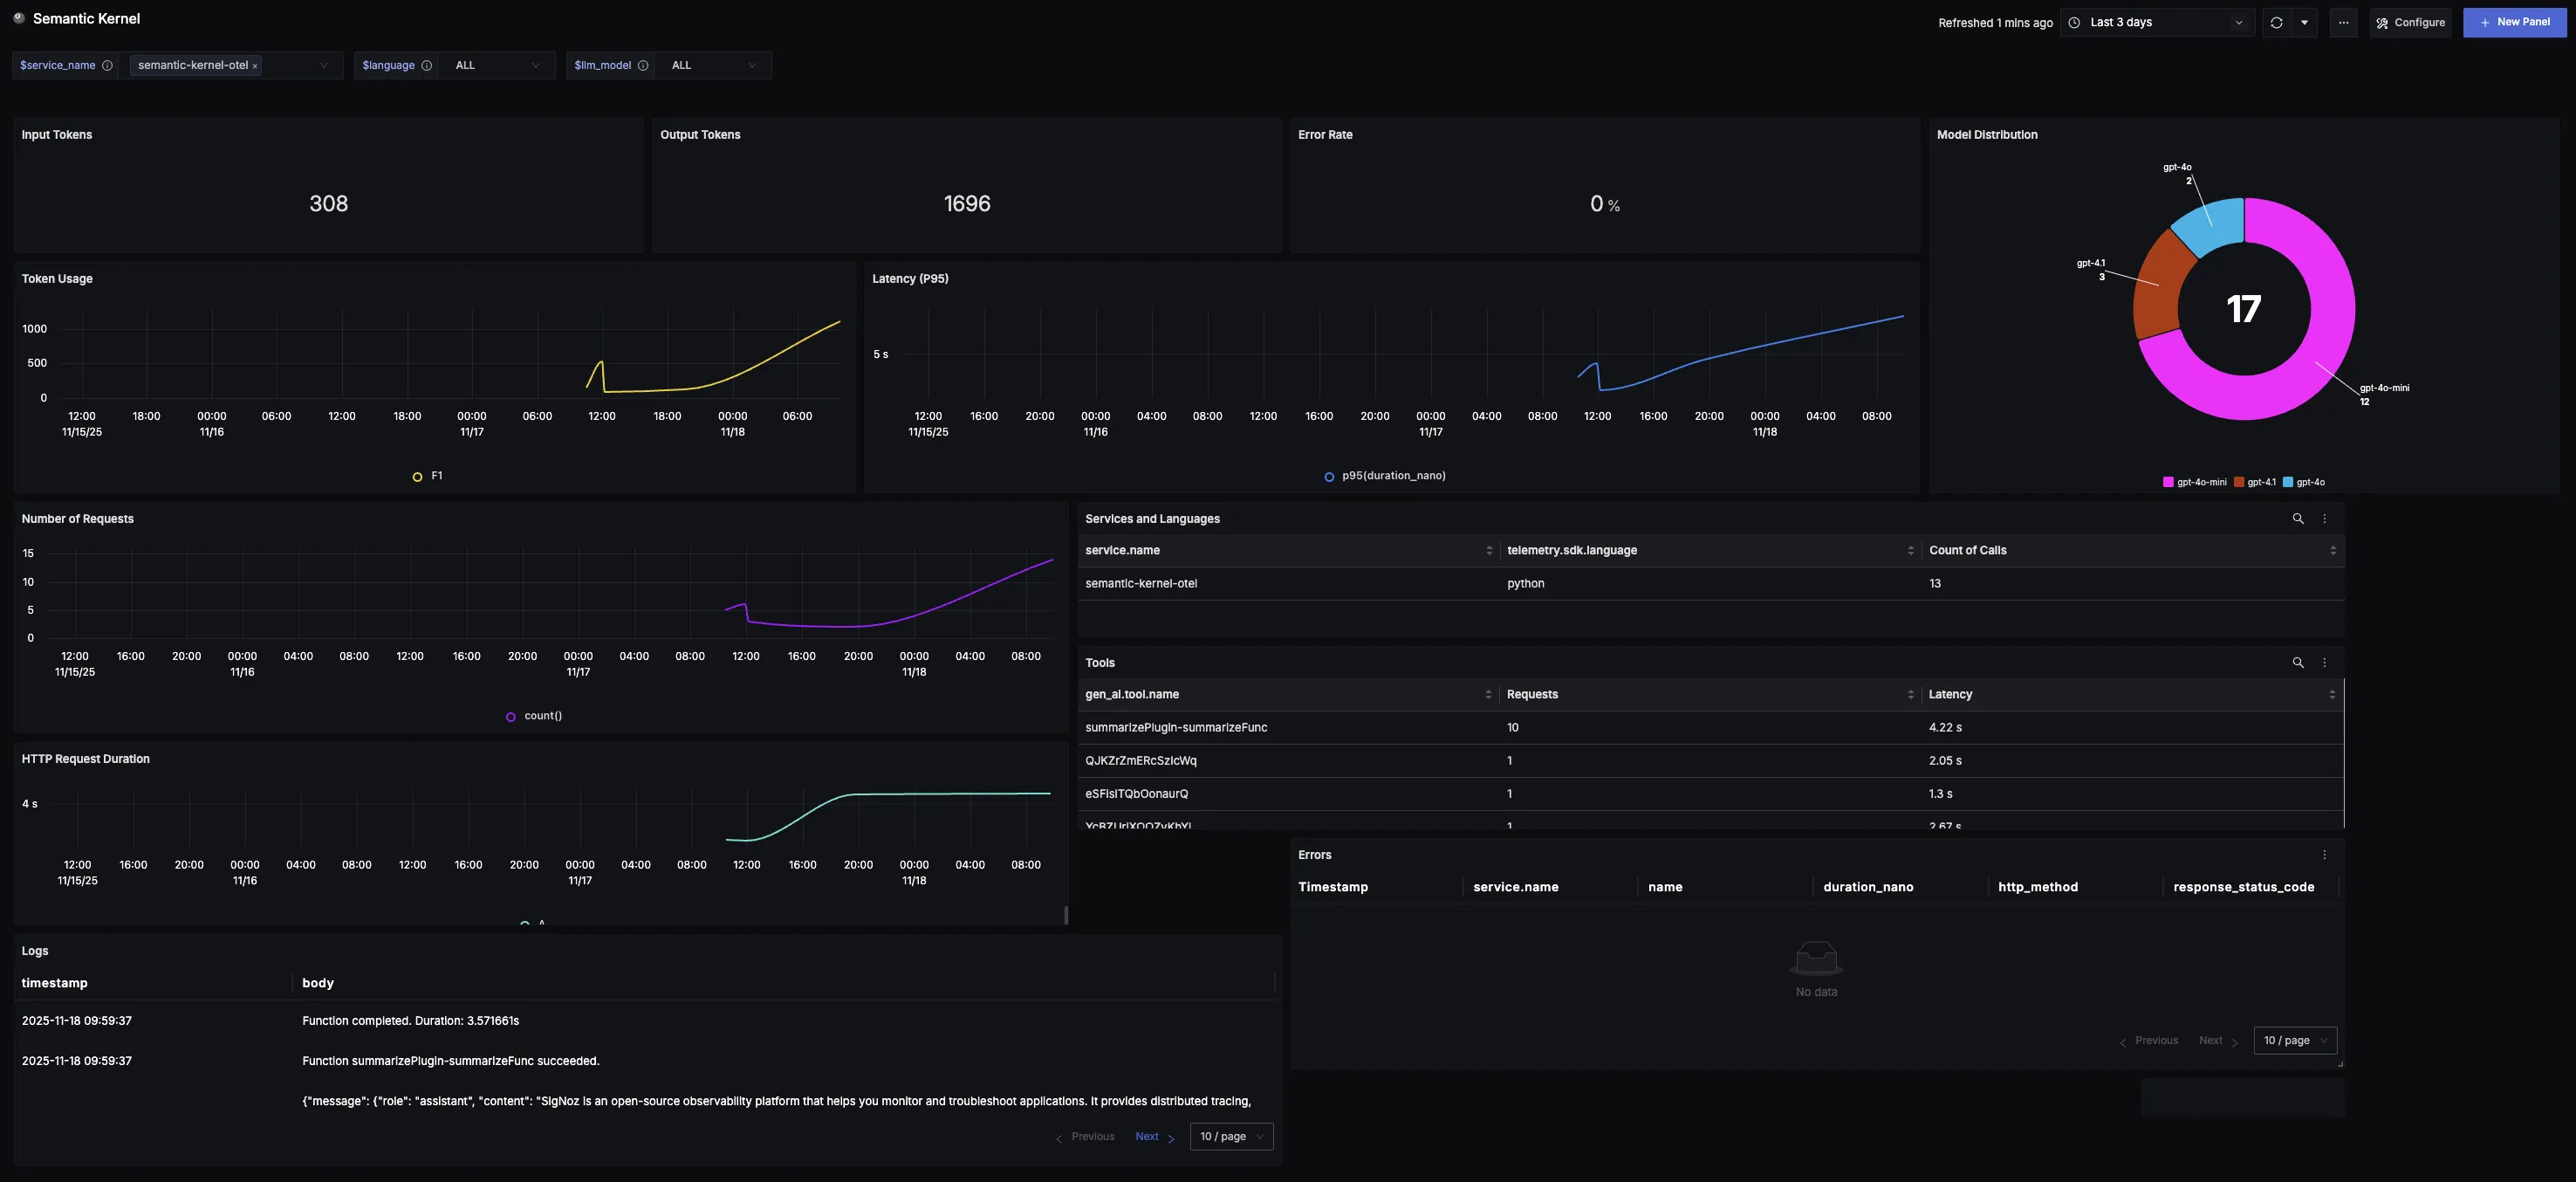
This dashboard offers a clear view into Semantic Kernel usage and performance. It highlights key metrics such as model distribution, error rates, request volumes, and latency trends. Teams can also track detailed records of errors, to better understand adoption patterns and optimize reliability and efficiency.
Dashboard Preview

Dashboards → + New dashboard → Import JSON
What This Dashboard Monitors
This dashboard tracks critical performance metrics for your Semantic Kernel usage using OpenTelemetry to help you:
- Track Reliability: Monitor error rates to identify reliability issues and ensure applications maintain a smooth, dependable experience.
- Analyze Model Adoption: Understand which AI models (via providers like OpenAI, Azure OpenAI, etc.) are being used through Semantic Kernel to track preferences and measure adoption of different models.
- Monitor Usage Patterns: Observe token consumption and request volume trends over time to spot adoption curves, peak cycles, and unusual spikes.
- Ensure Responsiveness: Track P95 latency to surface potential slowdowns, spikes, or regressions and maintain consistent user experience.
- Understand Service Distribution: See which services and programming languages are leveraging Semantic Kernel across your stack.
Metrics Included
Token Usage Metrics
- Total Token Usage (Input & Output): Displays the split between input tokens (user prompts) and output tokens (model responses), showing exactly how much work the system is doing over time.
- Token Usage Over Time: Time series visualization showing token consumption trends to identify adoption patterns, peak cycles, and baseline activity.
Performance & Reliability
- Total Error Rate: Tracks the percentage of Semantic Kernel calls that return errors, providing a quick way to identify reliability issues.
- Latency (P95 Over Time): Measures the 95th percentile latency of requests over time to surface potential slowdowns and ensure consistent responsiveness.
- HTTP Request Duration: Monitors the duration of outbound HTTP requests made during LLM calls, helping identify network bottlenecks and API response time patterns that impact overall Semantic Kernel performance.
Usage Analysis
- Model Distribution: Shows which AI models from various providers (OpenAI, Azure OpenAI, etc.) are being called through Semantic Kernel, helping track preferences and measure adoption across different models.
- Requests Over Time: Captures the volume of requests sent to Semantic Kernel over time, revealing demand patterns and high-traffic windows.
- Services and Languages Using Semantic Kernel: Breakdown showing where Semantic Kernel is being adopted across different services and programming languages in your stack.
- Agents: List of agents along with how many times each agent was called.
- Tools: List of tool calls along with how many times each tool was called.
- Semantic Kernel Logs: Comprehensive list of all generated logs for Semantic Kernel applications associated with the given service name.
Error Tracking
- Error Records: Table logging all recorded errors with clickable records that link to the originating trace for detailed error investigation.
