Dashboards in SigNoz let you interact with data through panels built in the Query Builder, where context menus and click actions allow you to drill deeper, apply filters, and move to related logs, traces, or metrics.
These interactive features make dashboards a powerful tool for root cause analysis, helping you move from high-level trends to detailed records with just a few clicks.
Features
Interactive dashboards include multiple capabilities such as View Logs and Traces, Breakout by, Context Links, Cross Filtering, and Filter in Tables. Together, these features let you drill deeper, correlate across signals, and debug issues faster.
View Logs and Traces
The View in Logs/Traces option allows you to go beyond aggregated charts and tables by opening the underlying raw signal data.
This helps not only in viewing the exact records behind a metric or trace but also in correlating across signals for deeper debugging.
How it works
- Click on a datapoint in a chart or a value in a table.
- A context menu will appear with options including View in Logs and View in Traces.
- When you select one of these options:
- The current filters, time range, and group-by context are preserved.
- SigNoz opens the corresponding Explorer view (Logs or Traces).
- You immediately see the subset of records that contributed to the clicked datapoint.
This ensures that you can move seamlessly from high-level aggregates to detailed records without needing to rebuild queries.
Example
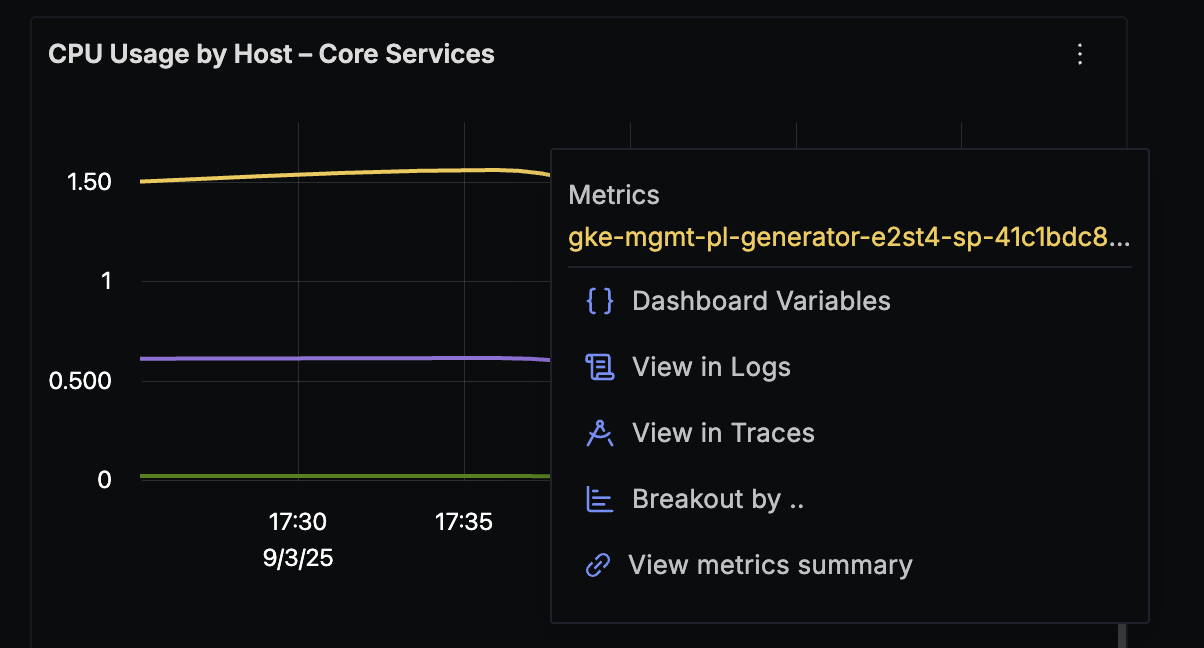
In the example below, a CPU Usage by Host metrics panel shows an anomaly.
By right-clicking on the datapoint, you can select View in Logs or View in Traces from the context menu.
This workflow shortens the gap between observing anomalies and finding their root cause by connecting metrics, traces, and logs in one flow.
Why use it
- Faster correlation: Jump from metrics to traces and logs in context.
- Root cause focus: Cut the time between spotting anomalies and debugging them.
Breakout by
The Breakout by option allows you to drill deeper into aggregated data by regrouping it with another attribute.
Instead of building a new query from scratch, you can click on a datapoint or table cell and break it down further to uncover patterns and anomalies.
How it works
- Click on a chart datapoint, bar segment, or table cell.
- From the context menu, select Breakout by....
- Choose an attribute from the list (for example,
k8s.pod.nameorhost.name). - The panel is updated in place to show the new breakdown:
- Existing filters, time range, and dashboard variables are preserved.
- The selected data is applied as a filter so the new breakdown focuses only on that slice.
- The chosen attribute becomes the new group by dimension (it replaces the previous grouping).
This lets you move from a broad overview to more granular insights step by step.
Example
In the example below, a panel showing CPU Usage by Host can be further analyzed by selecting Breakout by → k8s.pod.name.
This reveals which pods inside the host are contributing most to CPU usage.
Why use it
- Anomaly detection: Spot which service, pod, or endpoint is driving unusual behavior.
- Layered exploration: Start broad (by service) and go deeper (by pod, endpoint, or trace attribute).
- Faster debugging: Explore data without manually editing queries.
Context Links
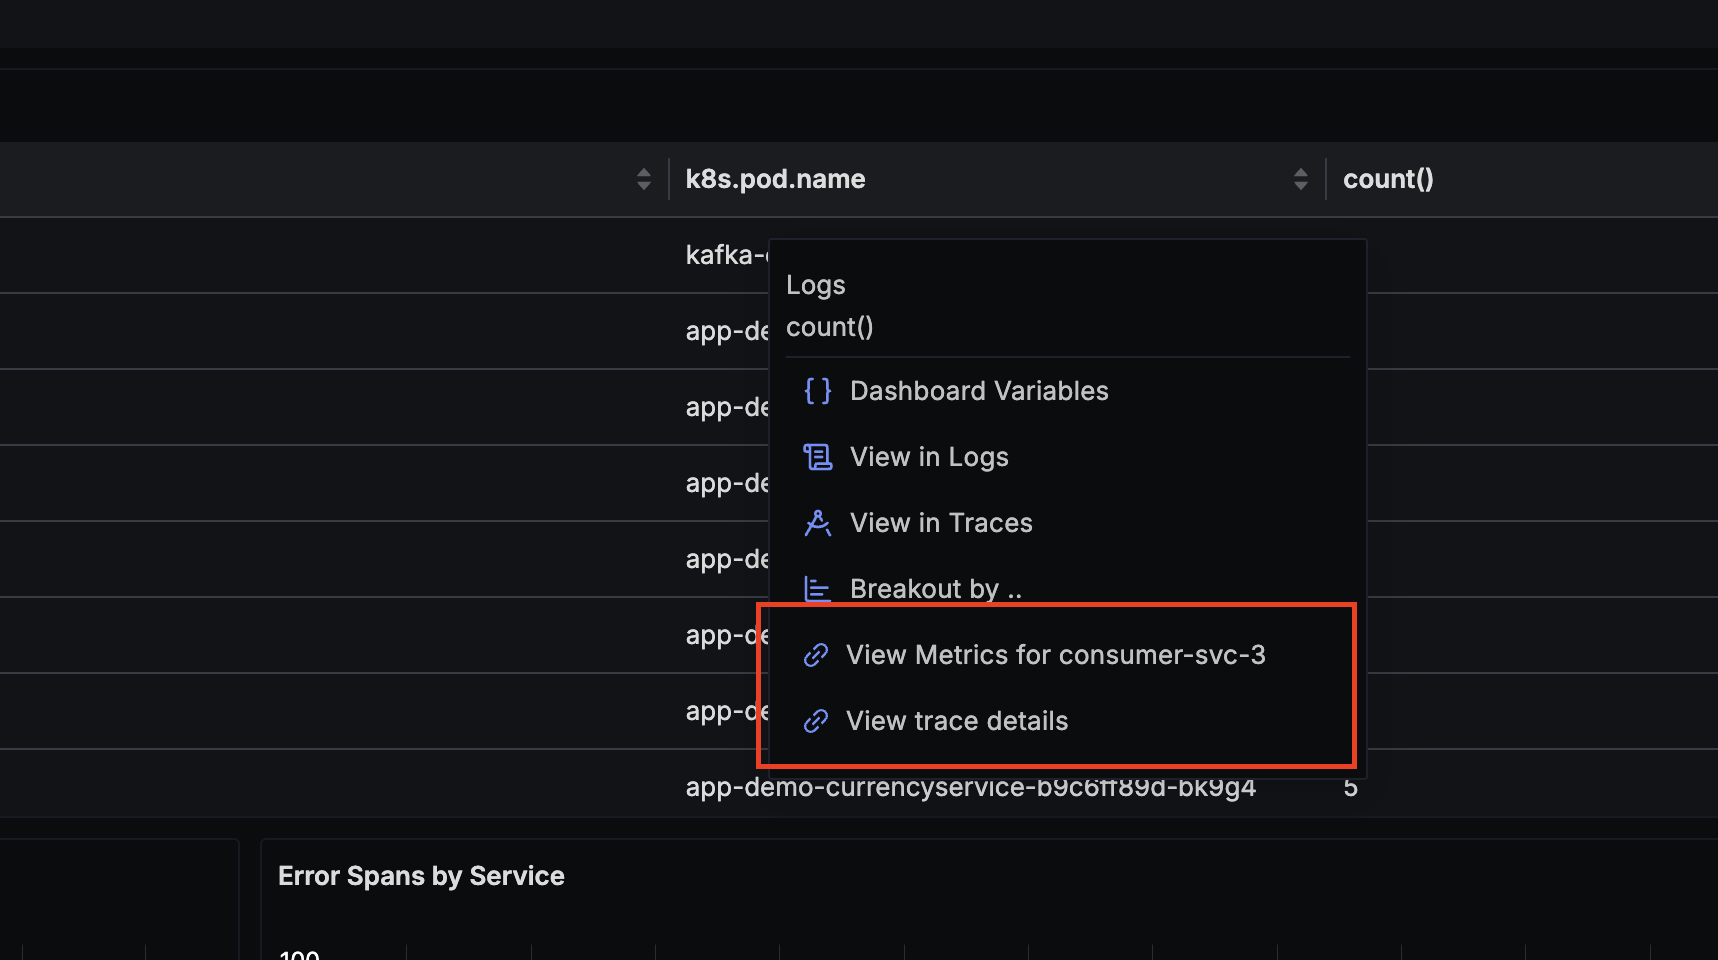
Context Links are links available in a panel’s context menu.
They let you attach dynamic URLs to a panel and navigate to internal explorers (Logs, Traces, Metrics) or external tools (e.g. Jenkins, PagerDuty) using the values of the datapoint you clicked.
How it works
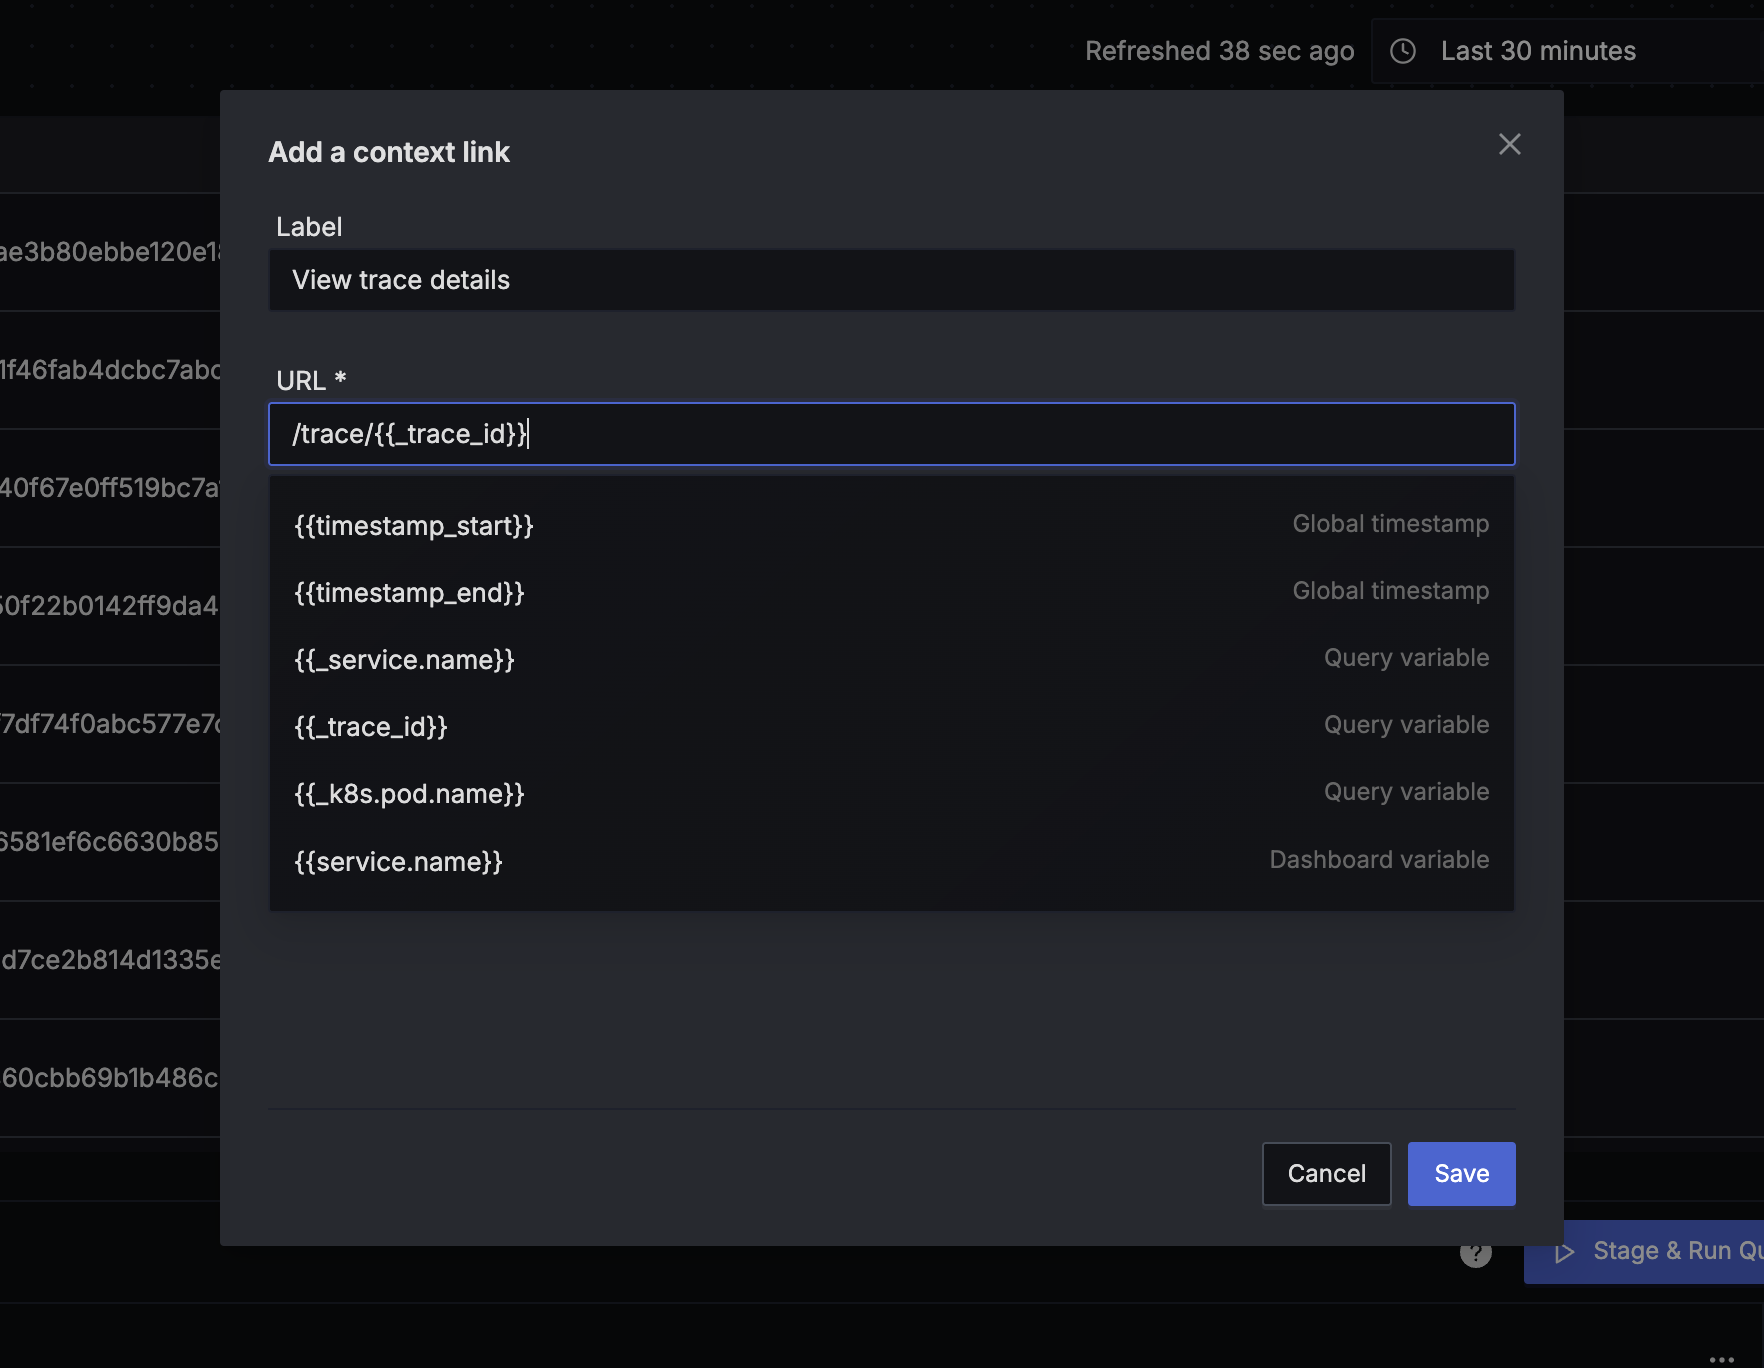
- Edit a panel and open the Context Links section.
- Click + Context Link and configure:
- Label: The menu text (fallback is the raw URL).
- URL: A template URL with variables like
{{_service.name}}or{{timestamp_start}}. - Query params: Manage key–value pairs visually in the table.
- The modal keeps the URL and key–value table in sync:
- Editing the URL auto-populates the params table (values are decoded).
- Editing the table updates the URL (values are encoded).
- In the dashboard, click a chart datapoint, bar segment, or table row to open the context menu.
- Select the created link — variables are resolved and the destination opens.
Available variables
You can use different types of variables inside the URL or param values:
| Type | Description | Syntax | Example |
|---|---|---|---|
| Time range | Inserts the current dashboard’s absolute start and end time (epoch ms). | {{timestamp_start}}, {{timestamp_end}} | from={{timestamp_start}}&to={{timestamp_end}} |
| Query variables | The group by fields in the query the user clicks on. Available only when the panel query has a GROUP BY. | {{_fieldName}} | {{_service.name}}, {{_trace_id}} |
| Dashboard variables | Any dashboard-level variable defined in the dashboard settings. | {{varName}} | {{host}}, {{env}} |
Examples
1. View trace details from a table
Label: View Trace Details
URL: /trace/{{_trace_id}}
2. External link with variables (Jenkins / PagerDuty)
Label: Open in Jenkins
URL: https://jenkins.example.com/job/{{_service.name}}?from={{timestamp_start}}&to={{timestamp_end}}

Label: PagerDuty Alerts
URL: https://pagerduty.example.com/incidents?service={{_service.name}}&since={{timestamp_start}}&until={{timestamp_end}}
Why use it
- Seamless navigation: Jump across signals (Logs ↔ Traces ↔ Metrics) or to external tools.
- Context preservation: Links carry the clicked value, filters, and time range automatically.
- Faster debugging: One-click access to deep-dive views without rebuilding queries.
Cross Filtering
Cross Filtering lets you use clicked data in a panel to update or create dashboard variables.
When you click on a service, pod, or trace ID, the panel’s context menu includes a Dashboard Variables option.
From here, the following actions are available:
- Set – Assign the clicked value to an existing dashboard variable.
- Unset – Remove the value from an existing dashboard variable.
- Create var – Add a new dynamic dashboard variable using the clicked field. By default, no panels are configured to use a newly created variable, but you can configure panels later to reference it.
If the clicked field already has a dynamic variable, you’ll see Set/Unset. Otherwise, the option will be Create var. Panels that use the updated variable will automatically refresh.
Why use it
- On-the-fly filtering: Narrow scope instantly without editing queries.
- Dynamic exploration: Create new variables directly from clicked data.
- Flexible workflows: Set, unset, or create variables depending on your analysis needs.
Filter in Tables
The Filter in Tables option allows you to quickly narrow results by applying filters directly from table cells. Instead of editing the query manually, you can click on a group-by value in a table and add conditions on the fly.
How it works
- Open a Table panel with a grouped query (for example,
COUNT(*) BY service.name). - Click on a cell in a group-by column.
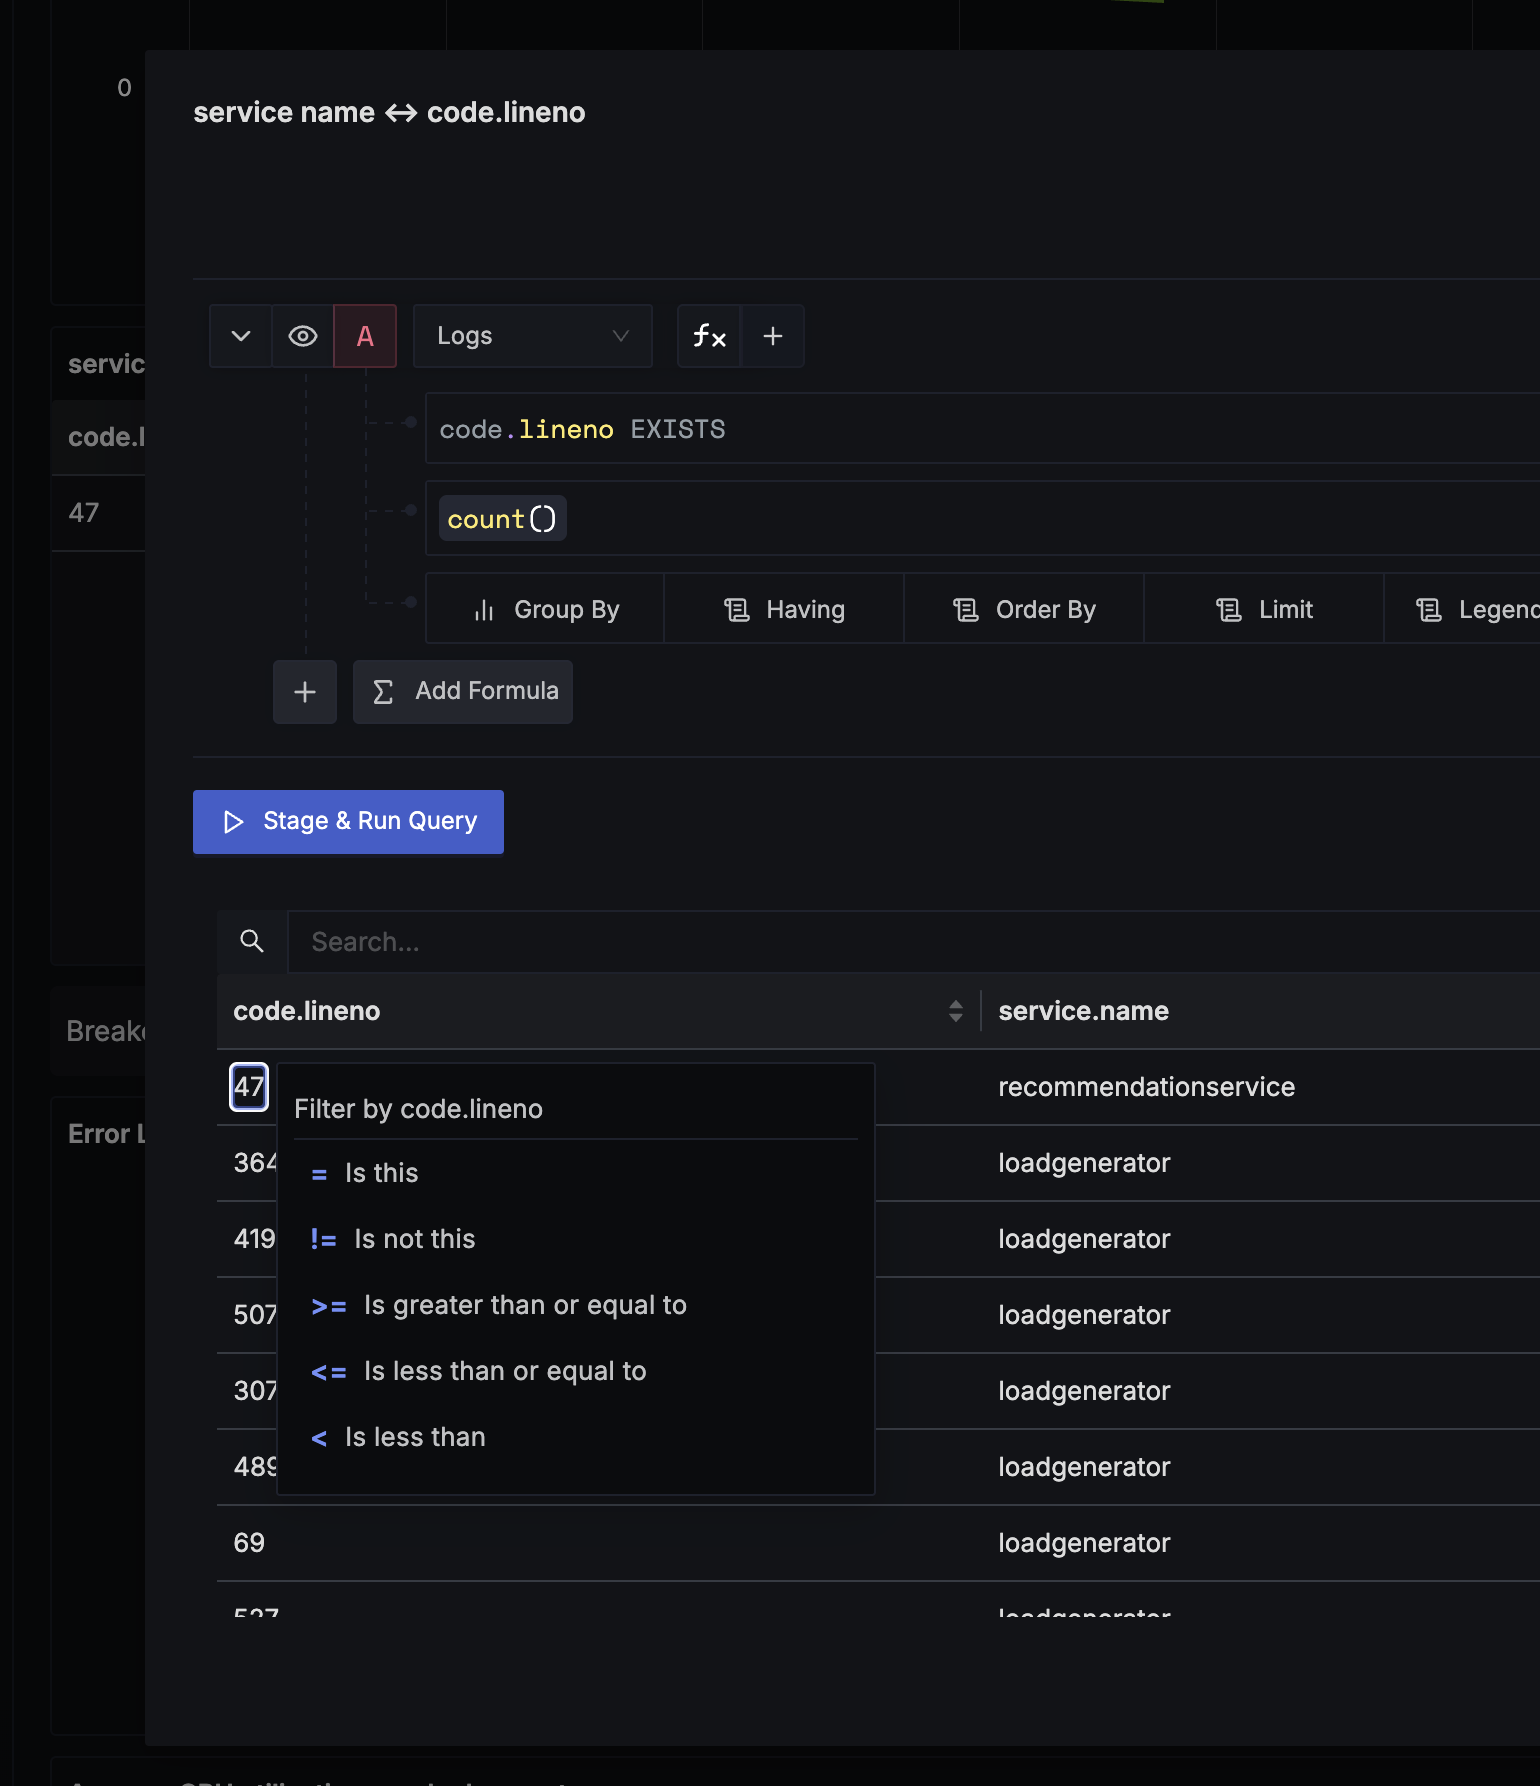
- From the context menu, select Filter by....
- Choose an operator based on the field type:
- String:
=or!= - Number:
=,>,<,>=,<= - Boolean:
is true,is false
- String:
- Enter or confirm the filter value.
- The table refreshes in place with the new filter applied — no manual edits or page reloads needed.
Why use it
- Faster narrowing: Apply filters directly from the data you are inspecting.
- Context-aware operators: Only valid operators for the column type are shown.
- No query editing: Instantly re-run the query without touching the Query Builder.
