What is DeepSeek Monitoring?
DeepSeek monitoring with OpenTelemetry gives you full visibility into your DeepSeek API calls. This guide walks you through instrumenting the DeepSeek API with OpenTelemetry and exporting traces, logs, and metrics to SigNoz, so you can track model latency, error rates, and token usage in one place.
With full DeepSeek monitoring in SigNoz, you can correlate traces, logs, and metrics in unified dashboards, configure alerts on latency and error rates, and gain actionable insights to continuously improve the reliability and responsiveness of your DeepSeek applications. This end-to-end DeepSeek observability makes it easier to debug issues, optimize performance, and understand user interactions across your AI workflows.
Prerequisites
- SigNoz setup (choose one):
- SigNoz Cloud account with an active ingestion key
- Self-hosted SigNoz instance
- Internet access to send telemetry data to SigNoz Cloud
- A DeepSeek API account with a working API Key
- For Python:
pipinstalled for managing Python packages and (optional but recommended) a Python virtual environment to isolate dependencies - For JavaScript: Node.js (version 14 or higher) and
npminstalled for managing Node.js packages
Monitoring DeepSeek with OpenTelemetry
The DeepSeek API uses an API format compatible with OpenAI. By modifying the configuration, you can use the OpenAI SDK or software compatible with the OpenAI API to access the DeepSeek API. Hence, a similar method to monitor OpenAI APIs can be used for monitoring DeepSeek APIs as well. To read more about this, you can read the DeepSeek API Docs
No-code auto-instrumentation is recommended for quick setup with minimal code changes. It's ideal when you want to get observability up and running without modifying your application code and are leveraging standard instrumentor libraries.
Step 1: Install the necessary packages in your Python environment.
pip install \
  opentelemetry-distro \
  opentelemetry-exporter-otlp \
  opentelemetry-instrumentation-httpx \
  opentelemetry-instrumentation-system-metrics \
  openai \
  openinference-instrumentation-openai
Step 2: Add Automatic Instrumentation
opentelemetry-bootstrap --action=install
Step 3: Configure logging level
To ensure logs are properly captured and exported, configure the root logger to emit logs at the INFO level or higher:
import logging

logging.getLogger().setLevel(logging.INFO)
logging.getLogger("httpx").setLevel(logging.INFO)
This sets the minimum log level for the root logger to INFO, which ensures that logger.info() calls and higher severity logs (WARNING, ERROR, CRITICAL) are captured by the OpenTelemetry logging auto-instrumentation and sent to SigNoz.
Step 4: Run an example
import openai
import os

client = OpenAI(api_key=os.getenv("DEEPSEEK_API_KEY"), base_url="https://api.deepseek.com")

response = client.chat.completions.create(
    model="deepseek-chat",
    messages=[
        {"role": "system", "content": "You are a helpful assistant"},
        {"role": "user", "content": "What is SigNoz?"},
    ],
    stream=False
)

print(response.choices[0].message.content)
📌 Note: Before running this code, ensure that you have set the environment variable
DEEPSEEK_API_KEYwith your generated API key.
Step 5: Run your application with auto-instrumentation
OTEL_RESOURCE_ATTRIBUTES="service.name=<service_name>" \
OTEL_EXPORTER_OTLP_ENDPOINT="https://ingest.<region>.signoz.cloud:443" \
OTEL_EXPORTER_OTLP_HEADERS="signoz-ingestion-key=<your-ingestion-key>" \
OTEL_EXPORTER_OTLP_PROTOCOL=grpc \
OTEL_TRACES_EXPORTER=otlp \
OTEL_METRICS_EXPORTER=otlp \
OTEL_LOGS_EXPORTER=otlp \
OTEL_PYTHON_LOG_CORRELATION=true \
OTEL_PYTHON_LOGGING_AUTO_INSTRUMENTATION_ENABLED=true \
opentelemetry-instrument <your_run_command>
<service_name>is the name of your service<region>: Your SigNoz Cloud region<your-ingestion-key>: Your SigNoz ingestion key- Replace
<your_run_command>with the actual command you would use to run your application. For example:python main.py
Code-based instrumentation gives you fine-grained control over your telemetry configuration. Use this approach when you need to customize resource attributes, sampling strategies, or integrate with existing observability infrastructure.
Step 1: Install the necessary packages in your Python environment.
pip install \
  opentelemetry-api \
  opentelemetry-sdk \
  opentelemetry-exporter-otlp \
  opentelemetry-instrumentation-httpx \
  opentelemetry-instrumentation-system-metrics \
  openai \
  openinference-instrumentation-openai
Step 2: Import the necessary modules in your Python application
Traces:
from openinference.instrumentation.openai import OpenAIInstrumentor
from opentelemetry import trace
from opentelemetry.sdk.resources import Resource
from opentelemetry.sdk.trace import TracerProvider
from opentelemetry.sdk.trace.export import BatchSpanProcessor
from opentelemetry.exporter.otlp.proto.http.trace_exporter import OTLPSpanExporter
Logs:
from opentelemetry.sdk._logs import LoggerProvider, LoggingHandler
from opentelemetry.sdk._logs.export import BatchLogRecordProcessor
from opentelemetry.exporter.otlp.proto.http._log_exporter import OTLPLogExporter
from opentelemetry._logs import set_logger_provider
import logging
Metrics:
from opentelemetry.sdk.metrics import MeterProvider
from opentelemetry.exporter.otlp.proto.http.metric_exporter import OTLPMetricExporter
from opentelemetry.sdk.metrics.export import PeriodicExportingMetricReader
from opentelemetry import metrics
from opentelemetry.instrumentation.system_metrics import SystemMetricsInstrumentor
from opentelemetry.instrumentation.httpx import HTTPXClientInstrumentor
Step 3: Set up the OpenTelemetry Tracer Provider to send traces directly to SigNoz Cloud
from opentelemetry.sdk.resources import Resource
from opentelemetry.sdk.trace import TracerProvider
from opentelemetry.sdk.trace.export import BatchSpanProcessor
from opentelemetry.exporter.otlp.proto.http.trace_exporter import OTLPSpanExporter
from opentelemetry import trace
import os

resource = Resource.create({"service.name": "<service_name>"})
provider = TracerProvider(resource=resource)
span_exporter = OTLPSpanExporter(
    endpoint= os.getenv("OTEL_EXPORTER_TRACES_ENDPOINT"),
    headers={"signoz-ingestion-key": os.getenv("SIGNOZ_INGESTION_KEY")},
)
processor = BatchSpanProcessor(span_exporter)
provider.add_span_processor(processor)
trace.set_tracer_provider(provider)
<service_name>is the name of your serviceOTEL_EXPORTER_TRACES_ENDPOINT→ SigNoz Cloud trace endpoint with appropriate region:https://ingest.<region>.signoz.cloud:443/v1/tracesSIGNOZ_INGESTION_KEY→ Your SigNoz ingestion key
Step 4: Instrument DeepSeek using OpenAInstrumentor and the configured Tracer Provider
from openinference.instrumentation.openai import OpenAIInstrumentor

OpenAIInstrumentor().instrument(tracer_provider=provider)
📌 Important: Place this code at the start of your application logic, before any DeepSeek functions are called or used, to ensure telemetry is correctly captured.
Step 5: Setup Logs
import logging
from opentelemetry.sdk.resources import Resource
from opentelemetry._logs import set_logger_provider
from opentelemetry.sdk._logs import LoggerProvider, LoggingHandler
from opentelemetry.sdk._logs.export import BatchLogRecordProcessor
from opentelemetry.exporter.otlp.proto.http._log_exporter import OTLPLogExporter
import os

resource = Resource.create({"service.name": "<service_name>"})
logger_provider = LoggerProvider(resource=resource)
set_logger_provider(logger_provider)

otlp_log_exporter = OTLPLogExporter(
    endpoint= os.getenv("OTEL_EXPORTER_LOGS_ENDPOINT"),
    headers={"signoz-ingestion-key": os.getenv("SIGNOZ_INGESTION_KEY")},
)
logger_provider.add_log_record_processor(
    BatchLogRecordProcessor(otlp_log_exporter)
)
# Attach OTel logging handler to root logger
handler = LoggingHandler(level=logging.INFO, logger_provider=logger_provider)
logging.basicConfig(level=logging.INFO, handlers=[handler])

logger = logging.getLogger(__name__)
<service_name>is the name of your serviceOTEL_EXPORTER_LOGS_ENDPOINT→ SigNoz Cloud endpoint with appropriate region:https://ingest.<region>.signoz.cloud:443/v1/logsSIGNOZ_INGESTION_KEY→ Your SigNoz ingestion key
Step 6: Setup Metrics
from opentelemetry.sdk.resources import Resource
from opentelemetry.sdk.metrics import MeterProvider
from opentelemetry.exporter.otlp.proto.http.metric_exporter import OTLPMetricExporter
from opentelemetry.sdk.metrics.export import PeriodicExportingMetricReader
from opentelemetry import metrics
from opentelemetry.instrumentation.system_metrics import SystemMetricsInstrumentor
from opentelemetry.instrumentation.httpx import HTTPXClientInstrumentor
import os

resource = Resource.create({"service.name": "<service-name>"})
metric_exporter = OTLPMetricExporter(
    endpoint= os.getenv("OTEL_EXPORTER_METRICS_ENDPOINT"),
    headers={"signoz-ingestion-key": os.getenv("SIGNOZ_INGESTION_KEY")},
)
reader = PeriodicExportingMetricReader(metric_exporter)
metric_provider = MeterProvider(metric_readers=[reader], resource=resource)
metrics.set_meter_provider(metric_provider)

meter = metrics.get_meter(__name__)

# turn on out-of-the-box metrics
SystemMetricsInstrumentor().instrument()
HTTPXClientInstrumentor().instrument()
<service_name>is the name of your serviceOTEL_EXPORTER_METRICS_ENDPOINT→ SigNoz Cloud endpoint with appropriate region:https://ingest.<region>.signoz.cloud:443/v1/metricsSIGNOZ_INGESTION_KEY→ Your SigNoz ingestion key
📌 Note: SystemMetricsInstrumentor provides system metrics (CPU, memory, etc.), and HTTPXClientInstrumentor provides outbound HTTP request metrics such as request duration. These are not DeepSeek-specific metrics. DeepSeek does not expose metrics as part of their SDK. If you want to add custom metrics to your DeepSeek application, see Python Custom Metrics.
Step 7: Run an example
import openai
import os

client = OpenAI(api_key=os.getenv("DEEPSEEK_API_KEY"), base_url="https://api.deepseek.com")

response = client.chat.completions.create(
    model="deepseek-chat",
    messages=[
        {"role": "system", "content": "You are a helpful assistant"},
        {"role": "user", "content": "What is SigNoz?"},
    ],
    stream=False
)

print(response.choices[0].message.content)
📌 Note: Before running this code, ensure that you have set the environment variable
DEEPSEEK_API_KEYwith your generated API key.
Step 1: Install the necessary packages in your Node.js project.
npm install \
  @opentelemetry/api \
  @opentelemetry/sdk-node \
  @opentelemetry/sdk-trace-node \
  @opentelemetry/sdk-logs \
  @opentelemetry/sdk-metrics \
  @opentelemetry/exporter-otlp-http \
  @opentelemetry/instrumentation \
  @opentelemetry/instrumentation-http \
  @opentelemetry/host-metrics \
  @opentelemetry/resources \
  @opentelemetry/semantic-conventions \
  @arizeai/openinference-instrumentation-openai \
  openai
Step 2: Import the necessary modules in your JavaScript/Node.js application
Traces:
const { NodeSDK } = require('@opentelemetry/sdk-node')
const { Resource } = require('@opentelemetry/resources')
const { ATTR_SERVICE_NAME } = require('@opentelemetry/semantic-conventions')
const { NodeTracerProvider } = require('@opentelemetry/sdk-trace-node')
const { BatchSpanProcessor } = require('@opentelemetry/sdk-trace-base')
const { OTLPTraceExporter } = require('@opentelemetry/exporter-otlp-http')
const { registerInstrumentations } = require('@opentelemetry/instrumentation')
const { OpenAIInstrumentation } = require('@arizeai/openinference-instrumentation-openai')
Logs:
const { LoggerProvider, BatchLogRecordProcessor } = require('@opentelemetry/sdk-logs')
const { OTLPLogExporter } = require('@opentelemetry/exporter-otlp-http')
const { logs } = require('@opentelemetry/api')
Metrics:
const { MeterProvider, PeriodicExportingMetricReader } = require('@opentelemetry/sdk-metrics')
const { OTLPMetricExporter } = require('@opentelemetry/exporter-otlp-http')
const { HttpInstrumentation } = require('@opentelemetry/instrumentation-http')
const { HostMetrics } = require('@opentelemetry/host-metrics')
const { metrics } = require('@opentelemetry/api')
Step 3: Set up the OpenTelemetry Tracer Provider to send traces directly to SigNoz Cloud
const { NodeTracerProvider } = require('@opentelemetry/sdk-trace-node')
const { BatchSpanProcessor } = require('@opentelemetry/sdk-trace-base')
const { OTLPTraceExporter } = require('@opentelemetry/exporter-otlp-http')
const { Resource } = require('@opentelemetry/resources')
const { ATTR_SERVICE_NAME } = require('@opentelemetry/semantic-conventions')
const { trace } = require('@opentelemetry/api')

const resource = Resource.default({
  attributes: {
    [ATTR_SERVICE_NAME]: '<service_name>',
  },
})

const provider = new NodeTracerProvider({
  resource: resource,
})

const traceExporter = new OTLPTraceExporter({
  url: process.env.OTEL_EXPORTER_TRACES_ENDPOINT,
  headers: {
    'signoz-ingestion-key': process.env.SIGNOZ_INGESTION_KEY,
  },
})

const spanProcessor = new BatchSpanProcessor(traceExporter)
provider.addSpanProcessor(spanProcessor)
provider.register()
<service_name>is the name of your serviceOTEL_EXPORTER_TRACES_ENDPOINT→ SigNoz Cloud trace endpoint with appropriate region:https://ingest.<region>.signoz.cloud:443/v1/tracesSIGNOZ_INGESTION_KEY→ Your SigNoz ingestion key
Step 4: Instrument DeepSeek using OpenAIInstrumentation and the configured Tracer Provider
const { registerInstrumentations } = require('@opentelemetry/instrumentation')
const { OpenAIInstrumentation } = require('@arizeai/openinference-instrumentation-openai')

registerInstrumentations({
  instrumentations: [
    new OpenAIInstrumentation({
      tracerProvider: provider,
    }),
  ],
})
📌 Important: Place this code at the start of your application logic, before any DeepSeek functions are called or used, to ensure telemetry is correctly captured.
Step 5: Setup Logs
const { LoggerProvider, BatchLogRecordProcessor } = require('@opentelemetry/sdk-logs')
const { OTLPLogExporter } = require('@opentelemetry/exporter-otlp-http')
const { Resource } = require('@opentelemetry/resources')
const { ATTR_SERVICE_NAME } = require('@opentelemetry/semantic-conventions')
const { logs } = require('@opentelemetry/api')

const logResource = Resource.default({
  attributes: {
    [ATTR_SERVICE_NAME]: '<service_name>',
  },
})

const loggerProvider = new LoggerProvider({
  resource: logResource,
})

const logExporter = new OTLPLogExporter({
  url: process.env.OTEL_EXPORTER_LOGS_ENDPOINT,
  headers: {
    'signoz-ingestion-key': process.env.SIGNOZ_INGESTION_KEY,
  },
})

loggerProvider.addLogRecordProcessor(new BatchLogRecordProcessor(logExporter))

logs.setGlobalLoggerProvider(loggerProvider)

// Create a logger instance
const logger = logs.getLogger('deepseek-app')
<service_name>is the name of your serviceOTEL_EXPORTER_LOGS_ENDPOINT→ SigNoz Cloud endpoint with appropriate region:https://ingest.<region>.signoz.cloud:443/v1/logsSIGNOZ_INGESTION_KEY→ Your SigNoz ingestion key
Step 6: Setup Metrics
const { MeterProvider, PeriodicExportingMetricReader } = require('@opentelemetry/sdk-metrics')
const { OTLPMetricExporter } = require('@opentelemetry/exporter-otlp-http')
const { Resource } = require('@opentelemetry/resources')
const { ATTR_SERVICE_NAME } = require('@opentelemetry/semantic-conventions')
const { metrics } = require('@opentelemetry/api')
const { HttpInstrumentation } = require('@opentelemetry/instrumentation-http')
const { registerInstrumentations } = require('@opentelemetry/instrumentation')

const metricResource = Resource.default({
  attributes: {
    [ATTR_SERVICE_NAME]: '<service_name>',
  },
})

const metricExporter = new OTLPMetricExporter({
  url: process.env.OTEL_EXPORTER_METRICS_ENDPOINT,
  headers: {
    'signoz-ingestion-key': process.env.SIGNOZ_INGESTION_KEY,
  },
})

const metricReader = new PeriodicExportingMetricReader({
  exporter: metricExporter,
  exportIntervalMillis: 10000,
})

const meterProvider = new MeterProvider({
  resource: metricResource,
  readers: [metricReader],
})

metrics.setGlobalMeterProvider(meterProvider)

// Create a meter instance
const meter = metrics.getMeter('deepseek-app')

// Register HTTP instrumentation for outbound HTTP metrics
registerInstrumentations({
  instrumentations: [new HttpInstrumentation()],
})

// Initialize host metrics for system-level monitoring
const hostMetrics = new HostMetrics({
  meterProvider: meterProvider,
})
hostMetrics.start()
<service_name>is the name of your serviceOTEL_EXPORTER_METRICS_ENDPOINT→ SigNoz Cloud endpoint with appropriate region:https://ingest.<region>.signoz.cloud:443/v1/metricsSIGNOZ_INGESTION_KEY→ Your SigNoz ingestion key
📌 Note: HostMetrics provides system-level metrics (CPU, memory, disk, network, etc.), and HttpInstrumentation provides outbound HTTP request metrics such as request duration. These are not DeepSeek-specific metrics. DeepSeek does not expose metrics as part of their SDK. If you want to add custom metrics to your DeepSeek application, see JavaScript Custom Metrics.
Step 7: Run an example
const OpenAI = require('openai')

const client = new OpenAI({
  apiKey: process.env.DEEPSEEK_API_KEY,
  baseURL: 'https://api.deepseek.com',
})

async function main() {
  try {
    const response = await client.chat.completions.create({
      model: 'deepseek-chat',
      messages: [
        { role: 'system', content: 'You are a helpful assistant' },
        { role: 'user', content: 'What is SigNoz?' },
      ],
      stream: false,
    })

    console.log(response.choices[0].message.content)

    // Optional: Log the interaction
    logger.emit({
      severityText: 'INFO',
      body: 'DeepSeek API call completed successfully',
      attributes: {
        'deepseek.model': 'deepseek-chat',
        'deepseek.response.length': response.choices[0].message.content.length,
      },
    })
  } catch (error) {
    console.error('Error calling DeepSeek API:', error)

    // Optional: Log the error
    logger.emit({
      severityText: 'ERROR',
      body: 'DeepSeek API call failed',
      attributes: {
        'error.message': error.message,
        'deepseek.model': 'deepseek-chat',
      },
    })
  }
}

main()
📌 Note: Before running this code, ensure that you have set the environment variable
DEEPSEEK_API_KEYwith your generated API key.
View DeepSeek Traces, Logs, and Metrics in SigNoz
Once configured, your DeepSeek application automatically emits traces, logs, and metrics.
DeepSeek traces are available in SigNoz under the Traces tab:

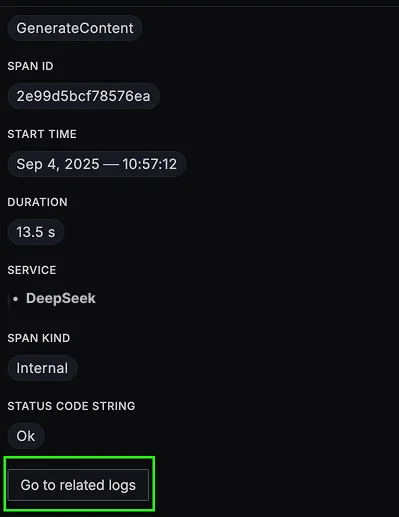
When you click on a trace in SigNoz, you'll see a detailed view of the trace, including all associated spans, along with their events and attributes.

DeepSeek logs are available in SigNoz under the Logs tab. You can also click the “Related Logs” button in the trace view to see correlated logs:

When you click on any of these logs in SigNoz, you'll see a detailed view of the log, including attributes:

DeepSeek related metrics are available in SigNoz under the Metrics tab:

When you click on any of these metrics in SigNoz, you'll see a detailed view of the metric, including attributes:

DeepSeek Monitoring Dashboard
The DeepSeek API dashboard template provides specialized visualizations for monitoring your DeepSeek API usage. It includes pre-built charts tailored for LLM usage, along with import instructions to get started quickly.

