Q.How do I add Billing address and email for invoice for SigNoz Cloud account?
Toggle for answer
This can be achieved in 2 simple step:
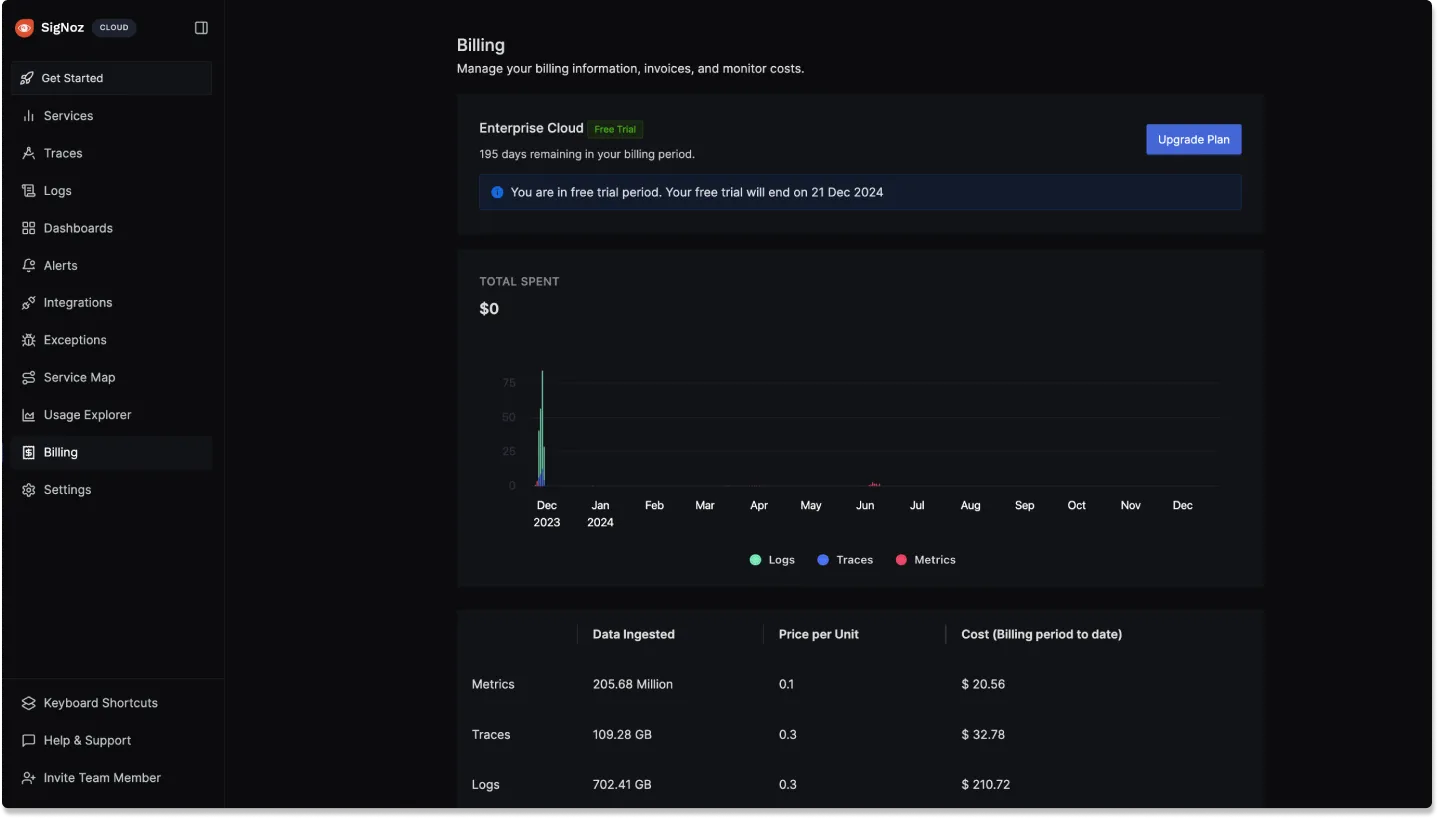
Step 1: Upgarde plan
Head Over to the Billing Tab in your SigNoz Cloud left hand navigation, there you will see a button to Upgrade Plan.
Click on the Upgrade Plan button.
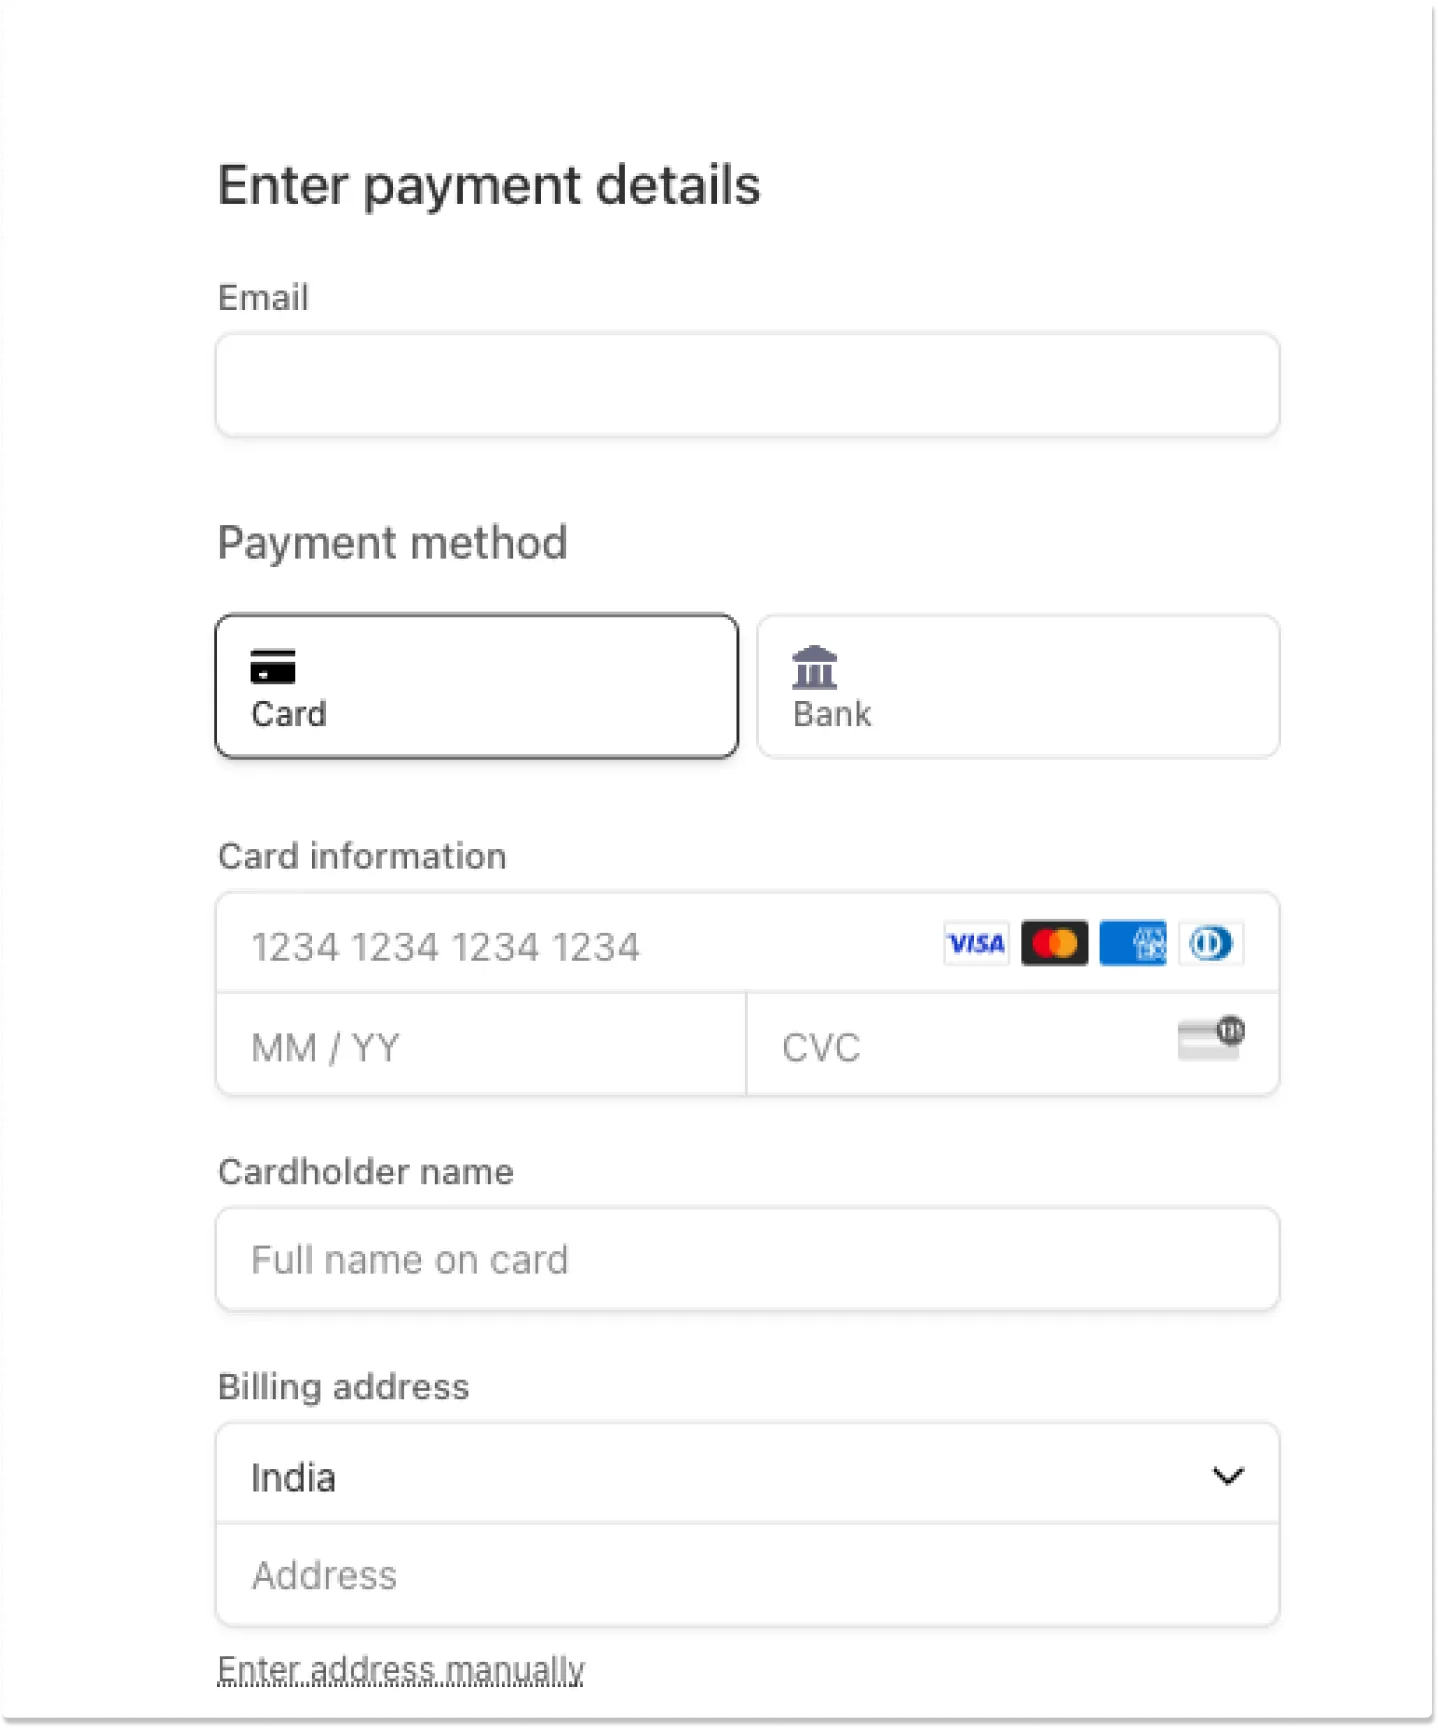
Step 2: Add Email and Billing address
Once you click the Upgrade Plan button, it will open a Page where you can add your details like email and Billing Address.
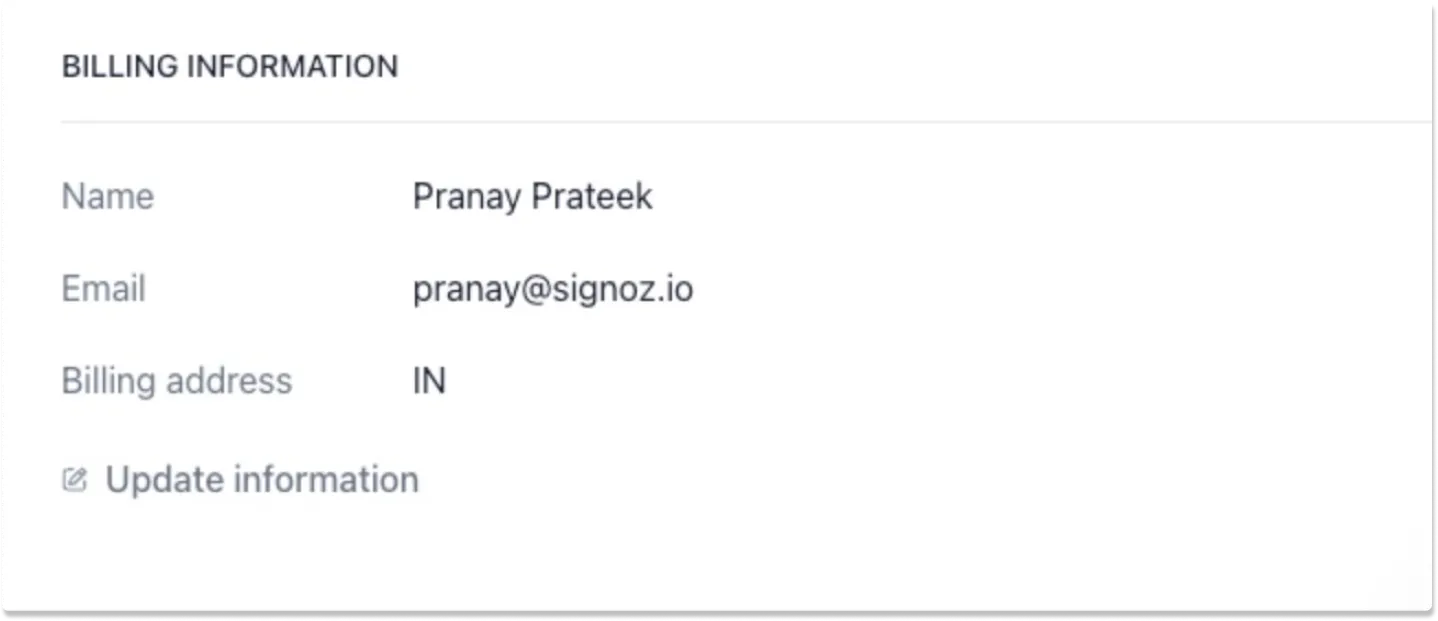
Optional Step: Update Billing Information
Once you have added your Credit Card successfully, you can go to the Billing tab in SigNoz Cloud and you'll see a button to Manage Plan which you can use to
add or update your info by clicking on Update information.
Q. How to view your past billing history and invoices
Toggle for answer
To access your billing history and view past invoices, follow these steps:
Navigate from Setting (in the sidebar)
- Settings
- Account settings
- Billing
- Click on the "Manage Billing" section.
- Scroll down to view your past invoices.
Note: If you only see the current month's billing information at first, make sure to scroll down within the Manage Billing section to locate your historical invoices and billing records.
Q. I am looking for an application monitoring tool, is SigNoz an APM?
Toggle for answer
SigNoz is a full-stack open source APM tool. It provides logs, metrics, and traces under a single dashboard. You can correlate these signals to debug performance issues quickly. SigNoz uses OpenTelemetry for instrumentation. OpenTelemetry is quietly becoming the world standard for instrumenting cloud-native applications.
SigNoz is an open source alternative to traditional SaaS APMs like DataDog.
Q. How is SigNoz different from Prometheus?
Toggle for answer
Prometheus is good if you want to do just metrics. But metrics are just one aspect of monitoring. Ideally, you would also use other telemetry signals like logs and traces to set up a robust monitoring framework for your application. SigNoz provides logs and traces too, everything under a single pane of glass.
Moreover, it’s not trivial to get application metrics with Prometheus. SigNoz provides out-of-box charts for application metrics like p99 latency of requests. You can also correlate your application metrics with traces seamlessly.
Our goal is to provide an integrated UI between all telemetry signals - metrics, traces, and logs - similar to what SaaS vendors like Datadog provide.
Q. What is the difference between signoz/alertmanager and prometheus/alertmanager?
Toggle for answer
prometheus/alertmanager mostly works via config and needs to restart for every change. The SigNoz team forked and created APIs to create, test and manage channels dynamically along with other functionalities like muting, inhibiting, etc
Q. How does SigNoz compare to Grafana stack ( Prometheus, Loki, Tempo)?
Toggle for answer
The advantages of SigNoz are powered by the choice of columnar database underlying it. Running aggregates on traces and logs would be much more efficient when doing in a columnar db. So, if you use Tempo you won't be able to get sum/rate/count/percentile on spans filtered by tags/labels. Similarly, for Loki if you look into their open issues on performance, you will find issues in running fast aggregations on millions of log lines. Moreover, running 3 stacks for metrics, traces and logs would prove to be more cumbersome for millions of events.
Using a single underlying datastore helps us in switching context from metrics to traces. Say, you see a spike in latency or error % of external calls or db calls from a service, SigNoz can take you to relevant traces on the click of a button which may not be as simple in Grafana (as far as we know).
To Summarise
- Underlying distributed columnar db to power analytical queries, Uber mentioned 80% of the queries over logs data were analytical and hence they shifted to clickhouse from elk. Here's the blog link.
- Ability to handle high cardinality traces as these types of databases support wide columns
- Single app vs combining different products for metrics, traces and logs
- UI streamlined for APM use cases
Q. Is Prometheus included in SigNoz?
Toggle for answer
We support PromQL and Prometheus remote read for users to shift seamlessly from Prometheus to SigNoz as their metrics monitoring tool. We also support PromQL for configuring alerts.
SigNoz supports all the exporters that are listed on the Exporters and Integrations page of the Prometheus documentation. If you have a running Prometheus instance and you expose metrics in Prometheus, then you can scrape them in SigNoz by configuring Prometheus receivers.
Q. I am using Jaeger, can I use SigNoz? How does it differ from Jaeger?
Toggle for answer
Yes, you can. SigNoz provides better distributed tracing capabilities than Jaeger. The traces tab of SigNoz provides advanced filtering based on different attributes. Moreover, you can also run aggregates on filtered traces. For example, you can get the p99 latency of spans with a tag of premium_customers.
Trace data is also visualized with Flamegraphs and Gantt charts.

With SigNoz, you get metrics, traces and logs in a single application unlike Jaeger which primarily focuses on distributed tracing.
Q. What is unique about SigNoz as an observability tool?
Toggle for answer
SigNoz is full-stack open source APM and observability tool. Some key aspects that make SigNoz unique are as follows:
-
SigNoz is open source and based on open standards. SigNoz is built to support OpenTelemetry natively.
-
SigNoz provides metrics, traces, and logs under a single pane of glass. Rather than running different projects like Prometheus for metrics and Jaeger for traces and stitching them together, you can use SigNoz as your one-stop observability solution.
-
SigNoz uses columnar datastores, which makes aggregating queries very fast. It also helps in slicing and dicing the data using
Group BYand aggregates. You can identify the root cause of performance issues quickly.
Q. How do you compare with Honeycomb feature-wise?
Toggle for answer
The last we checked Honeycomb (August 2022), they were primarily focused on traces and support for metrics in their pro plan.
We do have support for metrics, traces and also logs. So you can get all the 3 signals in a single app. You get out of the box dashboards for services with metrics like latency, etc. We have good support for trace aggregates and filters based on trace attributes, with a trace detail page with attributes. You can check more details in our docs
Though Honeycomb does have some features like Bubble up and correlation which we don't have currently, but we have some advanced correlation based features in our roadmap.
So, it depends on the use cases you are trying to solve - whether SigNoz will fit your needs today or not.
Q. Can I run SigNoz as a service in AWS?
Toggle for answer
Yes, you can run SigNoz in an AWS instance using Docker Compose or Docker Swarm. You can also use our helm chart to deploy SigNoz in EKS.
Refer here: https://signoz.io/docs/install/
Q. Is it possible to remove default SigNoz Services (Applications) from the dashboard that comes bundled with SigNoz installation?
If yes, after removing those, do I need to put my application's container and image in that place?
Q. Why does SigNoz not support Windows?
Toggle for answer
We currently do not support Windows because we are a small team. At first, we are focussing on MAC and Linux users.
Try SigNoz on your macOS or Linux system by following the Docker Standalone installation guide.
Q. We have deployed SigNoz in the Kubernetes cluster, does it show CPU and memory utilization metrics at the node level, as well as pod level like Prometheus does?
If yes, is it available by default on the dashboard or do we have to perform some additional configuration?
Toggle for answer
Yes, SigNoz can monitor resource utilization metrics at the node and pod level from your Kubernetes cluster. You can enable it by following the set of instructions here.
Q. Is there a provision to modify the base path of SigNoz UI and host it behind Nginx or others at the subpath?
For instance: instead of https://mydomain.com/, I want https://mydomain/signoz/, since my application is already running at the basepath.
Toggle for answer
We currently working on supporting custom baseURL to support that.
You can track it here: https://github.com/SigNoz/signoz/pull/1115
Q. Is there anything I need to do after upgrading SigNoz to a version with some breaking changes?
Toggle for answer
You need to follow our migration guides to upgrade SigNoz correctly.
Q. Is the frontend SigNoz level user data stored in ClickHouse DB?
Toggle for answer
No, it’s stored in SQLite. But we are planning to move to PostgreSQL. You can track the GitHub issue here.
