This documentation provides steps for sending traces from your frontend application to SigNoz.
SigNoz natively supports OpenTelemetry for collecting traces, so you can instrument your frontend applications with minimal setup and get deep visibility into user interactions and network activity.
Client side traces help you understand how user actions trigger requests, how long they take, and where latency is introduced, whether in the browser, network, or backend. This gives you a complete picture of user journeys and performance across your stack.
Prerequisites
- SigNoz Cloud or self-hosted account
- A web application from where you want to send traces
Setup
Step 1: Install dependencies
Install the following dependencies.
npm install @opentelemetry/sdk-trace-base
npm install @opentelemetry/sdk-trace-web
npm install @opentelemetry/exporter-trace-otlp-http
npm install @opentelemetry/instrumentation
npm install @opentelemetry/instrumentation-fetch
npm install @opentelemetry/instrumentation-xml-http-request
npm install @opentelemetry/context-zone
npm install @opentelemetry/resources
npm install @opentelemetry/instrumentation-user-interaction
yarn add @opentelemetry/sdk-trace-base
yarn add @opentelemetry/sdk-trace-web
yarn add @opentelemetry/exporter-trace-otlp-http
yarn add @opentelemetry/instrumentation
yarn add @opentelemetry/instrumentation-fetch
yarn add @opentelemetry/instrumentation-xml-http-request
yarn add @opentelemetry/context-zone
yarn add @opentelemetry/resources
yarn add @opentelemetry/instrumentation-user-interaction
Read more about the dependencies
@opentelemetry/sdk-trace-base: Contains the core tracing SDK implementation includingBatchSpanProcessorand base classes. This provides the foundation for creating and processing trace spans.@opentelemetry/sdk-trace-web: Provides theWebTracerProviderspecifically designed for browser environments. This is essential for web applications as it handles browser-specific tracing requirements.@opentelemetry/exporter-trace-otlp-http: Implements the OTLP (OpenTelemetry Protocol) HTTP exporter that sends your traces to the SigNoz collector. This handles the actual transmission of trace data over HTTP.@opentelemetry/instrumentation: Provides theregisterInstrumentationsfunction that allows you to register multiple instrumentations at once. This is the main API for setting up automatic instrumentation.@opentelemetry/instrumentation-fetch: Automatically instrumentsfetch()API calls to capture spans for network requests. This is crucial for tracking HTTP requests from your frontend to backend services.@opentelemetry/instrumentation-xml-http-request: Instruments legacy XMLHttpRequest calls for older code or libraries that don't usefetch. This ensures all network requests are captured regardless of the HTTP client used.@opentelemetry/context-zone: Provides context propagation for browser environments using Zone.js. This is essential for maintaining trace context across async operations and ensuring proper distributed tracing.@opentelemetry/resources: Provides resource attributes that identify your service (like service name, version, etc.). This helps distinguish traces from different services in your SigNoz dashboard.@opentelemetry/instrumentation-user-interaction: Automatically instruments user interactions like clicks, inputs, and form submissions. This helps correlate user actions with resulting operations and provides insights into user behavior.
Step 2: Create an instrumentation file
The instrumentation file is required to setup the OTLPTraceExporter and WebTracerProvider which are used to capture traces within your application and export them to your collector.
import { WebTracerProvider } from '@opentelemetry/sdk-trace-web';
import { BatchSpanProcessor } from '@opentelemetry/sdk-trace-base';
import { OTLPTraceExporter } from '@opentelemetry/exporter-trace-otlp-http';
import { FetchInstrumentation } from '@opentelemetry/instrumentation-fetch';
import { UserInteractionInstrumentation } from '@opentelemetry/instrumentation-user-interaction';
import { XMLHttpRequestInstrumentation } from '@opentelemetry/instrumentation-xml-http-request';
import { registerInstrumentations } from '@opentelemetry/instrumentation';
import { resourceFromAttributes } from '@opentelemetry/resources';
import { ZoneContextManager } from '@opentelemetry/context-zone';

const exporter = new OTLPTraceExporter({
  // For self-hosted version, please use the collector url instead.
  url: `https://ingest.<INGESTION_REGION>.signoz.cloud:443/v1/traces`,
  headers: {
    // Optional for the self-hosted version
    'signoz-ingestion-key': '<INGESTION_KEY>',
  },
});

const provider = new WebTracerProvider({
  resource: resourceFromAttributes({
    'service.name': '<SERVICE_NAME>',
  }),
  spanProcessors: [new BatchSpanProcessor(exporter)],
});

provider.register({
  contextManager: new ZoneContextManager(),
});

registerInstrumentations({
  instrumentations: [
    new FetchInstrumentation({
      // Selects which backend servers are allowed to receive trace headers for linking traces across services.
      // Using /.*/ acts as a wildcard. For safer usage in production, replace with specific domains:
      // e.g. propagateTraceHeaderCorsUrls: [/api\.example\.com/, /my-backend\.internal/]
      propagateTraceHeaderCorsUrls: /.*/,
    }),
    new UserInteractionInstrumentation({
      eventNames: ['click', 'input', 'submit'],
    }),
    new XMLHttpRequestInstrumentation({
      propagateTraceHeaderCorsUrls: /.*/,
    }),
  ],
});
- Set the
<INGESTION_REGION>to match your SigNoz Cloud region - Replace
<INGESTION_KEY>with your SigNoz ingestion key <SERVICE_NAME>is the name of your service
For self-hosted deployments, add the following CORS configuration to your OpenTelemetry Collector config file to allow browser requests from your frontend domain. Also, update the endpoint and remove the ingestion key header as shown in Cloud → Self-Hosted.
receivers:
  otlp:
    protocols:
      grpc:
        endpoint: 0.0.0.0:4317
      http:
        endpoint: 0.0.0.0:4318
        cors:
          allowed_origins:
            - <YOUR_FRONTEND_URL>
          allowed_headers: ['*']
<YOUR_FRONTEND_URL>is the url pointing to your frontend application
Going through each of the 3 instrumentations set up:
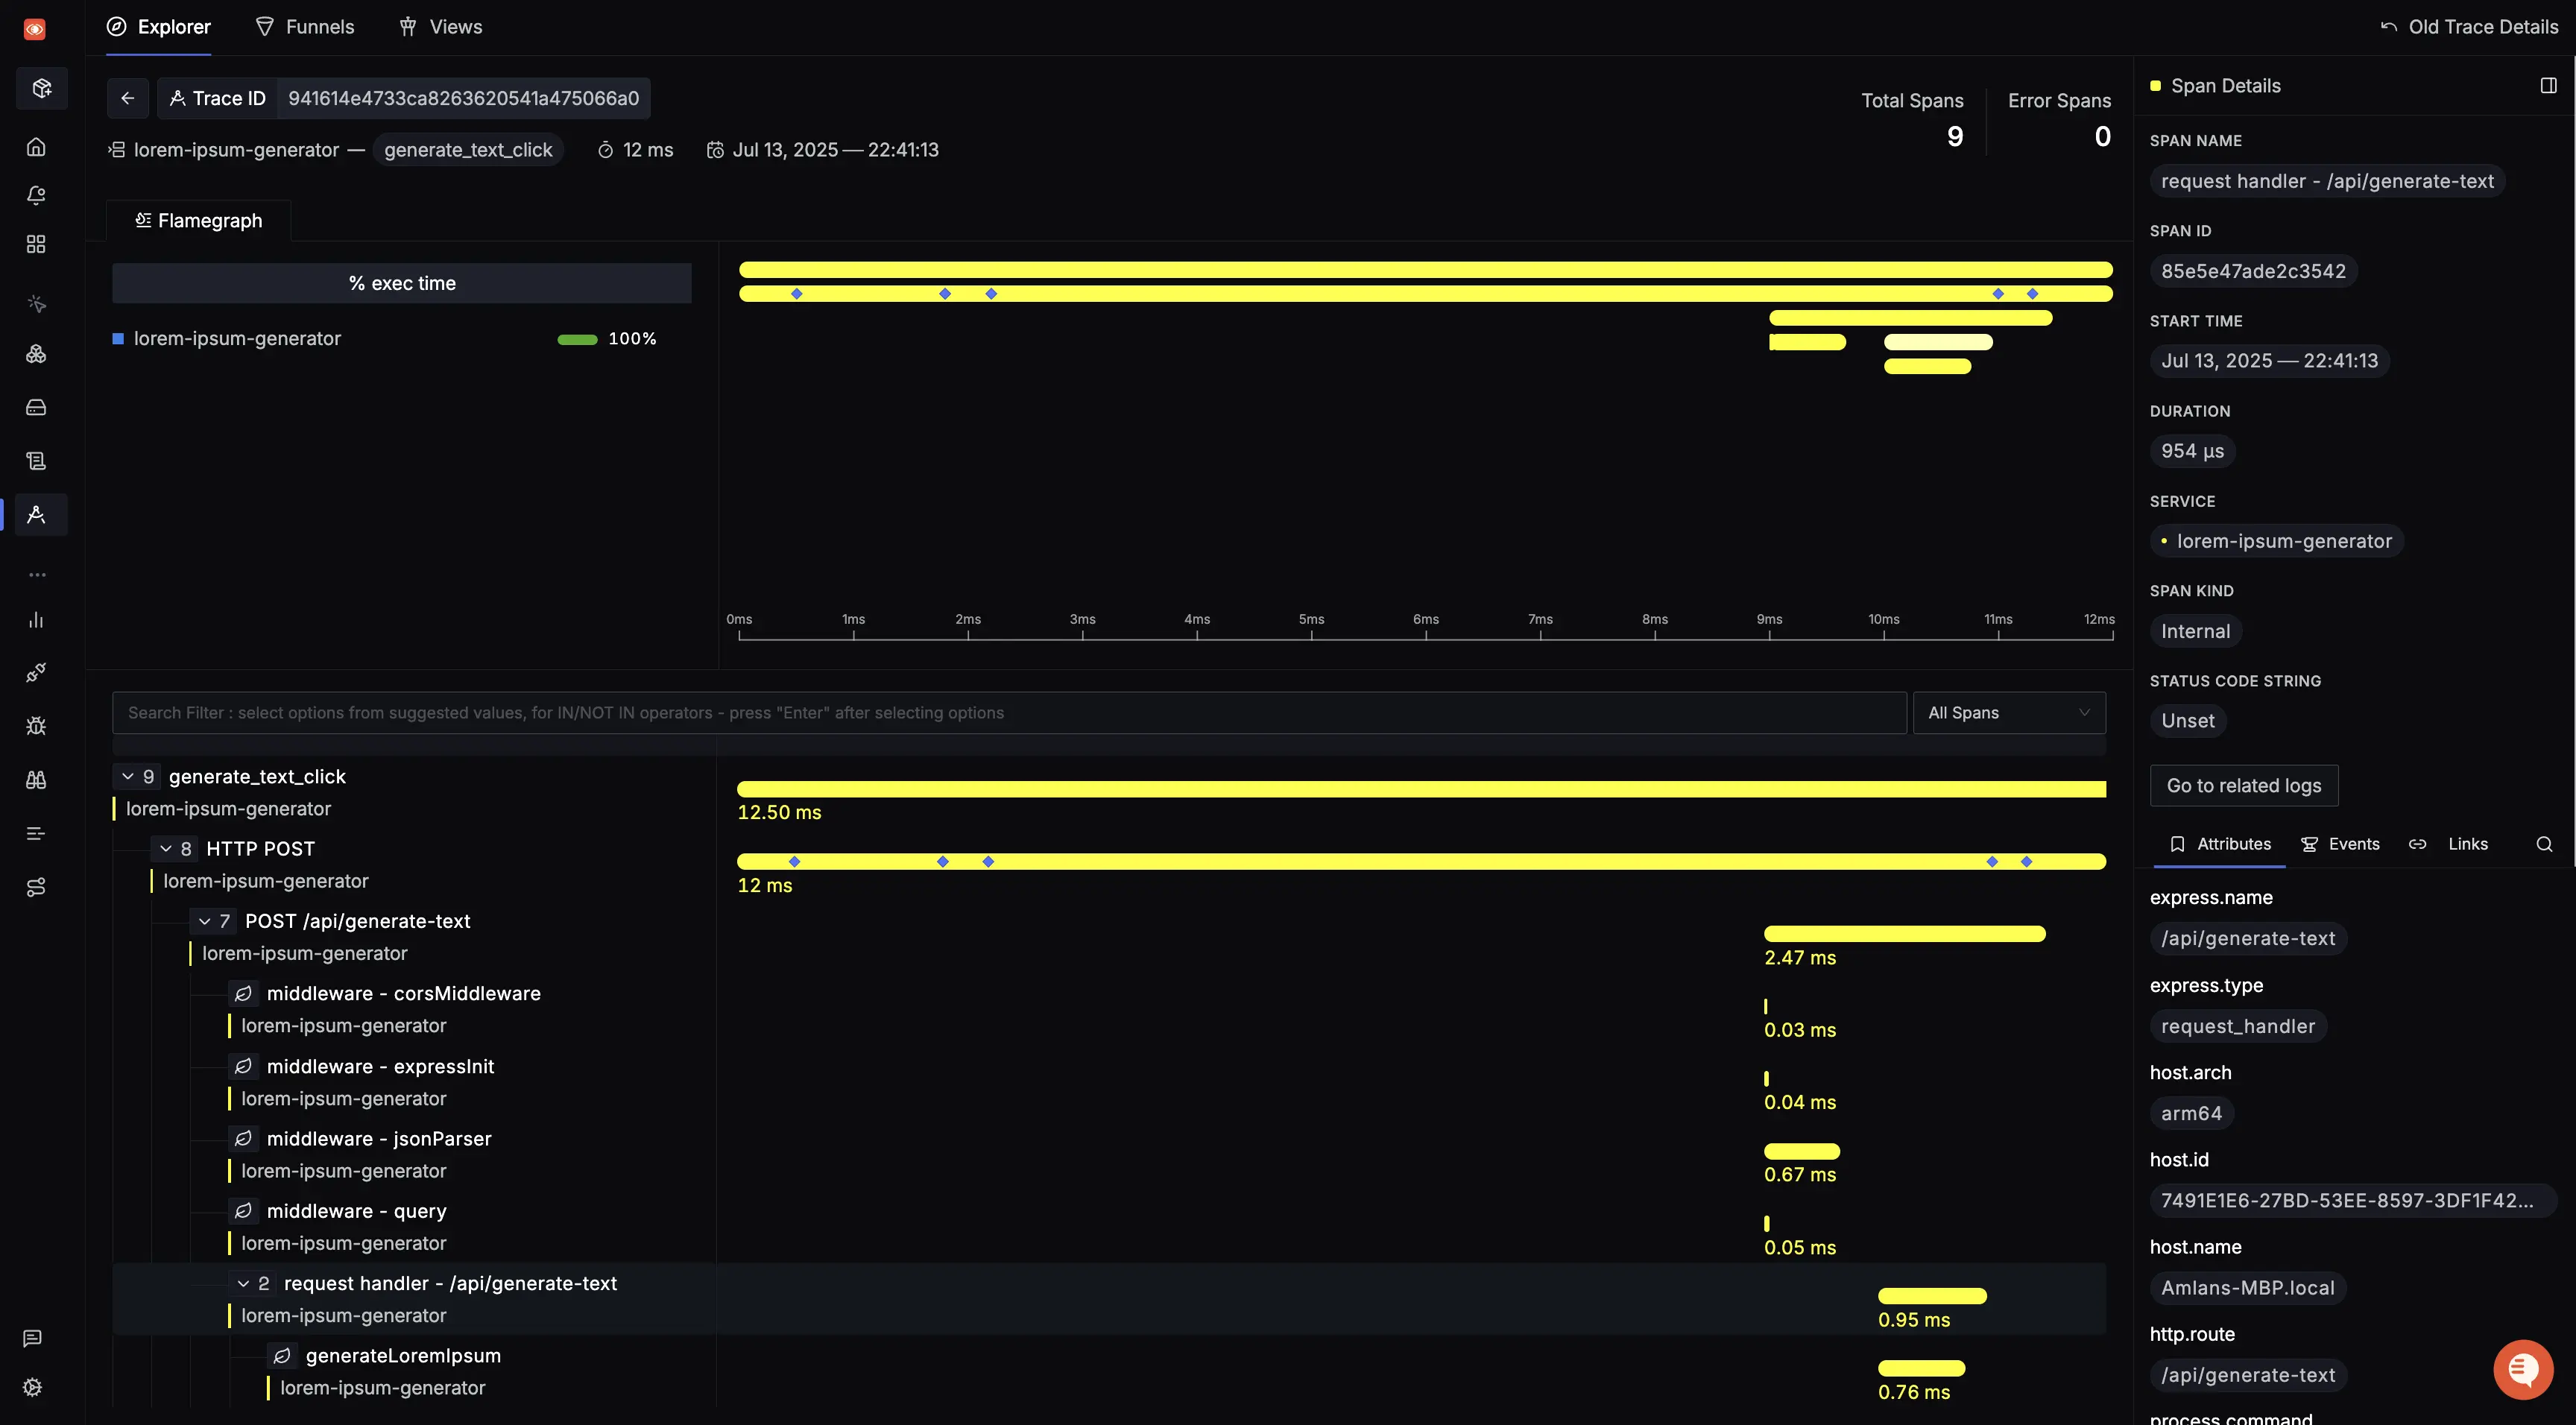
FetchInstrumentation– Automatically instrumentsfetch()API calls, capturing spans for each network request made viafetch. Supports propagating trace headers to backend services for distributed tracing.XMLHttpRequestInstrumentation– Instruments legacy XHR-based network requests (e.g., older libraries or custom implementations not usingfetch). Also adds trace headers to allow backend correlation.UserInteractionInstrumentation– Tracks meaningful user actions like clicks, form inputs, and submissions. This helps correlate user intent with resulting operations like network requests or page changes.
For example, you can trace that a backend request was triggered by a button click.
Step 3: Importing the instrumentation file
Import the instrumentation file at the top level of your application. This ensures that the OpenTelemetry instrumentation is initialized before any other code runs, allowing it to capture telemetry data from the very beginning of your application's execution.
In your main entry file (typically main.tsx or index.tsx), import the instrumentation file at the very top:
import './instrumentation';
import { StrictMode } from 'react';
import { createRoot } from 'react-dom/client';
import './index.css';
import App from './App';

createRoot(document.getElementById('root')!).render(
  <StrictMode>
    <App />
  </StrictMode>
);
Next.js (App Router) supports instrumentation through a special instrumentation.ts file at the root of your project (or inside src/ if using the src directory).
For client-side instrumentation, create a separate file and import it in your root layout:
// Your OpenTelemetry instrumentation code here
// (the code from Step 2)
Import it in your root layout:
import './instrumentation-client';

export default function RootLayout({ children }: { children: React.ReactNode }) {
  return (
    <html lang="en">
      <body>{children}</body>
    </html>
  );
}
Note: Make sure to enable instrumentation in next.config.js (Only required when using NextJs 14 and below):
module.exports = {
  experimental: {
    instrumentationHook: true,
  },
};
For Next.js with Pages Router, import the instrumentation in your _app.tsx file:
import '../instrumentation';
import type { AppProps } from 'next/app';

export default function App({ Component, pageProps }: AppProps) {
  return <Component {...pageProps} />;
}
Alternatively, you can use the instrumentation.ts file at the root (requires Next.js 13.2+):
export async function register() {
  if (typeof window !== 'undefined') {
    // Client-side instrumentation
    await import('./instrumentation-client');
  }
}
And enable it in next.config.js (Only required when using NextJs 14 and below):
module.exports = {
  experimental: {
    instrumentationHook: true,
  },
};
For Nuxt.js, create a plugin to initialize the instrumentation:
// Your OpenTelemetry instrumentation code here
// (the code from Step 2)

export default defineNuxtPlugin(() => {
  // Instrumentation is initialized when this plugin loads
});
The .client.ts suffix ensures this only runs on the client side. Nuxt will automatically load this plugin during application initialization.
Alternatively, you can import it directly in app.vue:
<script setup>
import './instrumentation';
</script>

<template>
  <NuxtPage />
</template>
For Angular, import the instrumentation file at the very top of your main.ts:
import './instrumentation';
import { bootstrapApplication } from '@angular/platform-browser';
import { appConfig } from './app/app.config';
import { AppComponent } from './app/app.component';

bootstrapApplication(AppComponent, appConfig)
  .catch((err) => console.error(err));
For older Angular versions using platformBrowserDynamic:
import './instrumentation';
import { platformBrowserDynamic } from '@angular/platform-browser-dynamic';
import { AppModule } from './app/app.module';

platformBrowserDynamic().bootstrapModule(AppModule)
  .catch(err => console.error(err));
For Vue.js, import the instrumentation file at the very top of your main.ts (or main.js):
import './instrumentation';
import { createApp } from 'vue';
import App from './App.vue';

createApp(App).mount('#app');
For Vue 2:
import './instrumentation';
import Vue from 'vue';
import App from './App.vue';

new Vue({
  render: h => h(App),
}).$mount('#app');
For Svelte (with Vite), import in your main.ts:
import './instrumentation';
import App from './App.svelte';

const app = new App({
  target: document.getElementById('app')!,
});

export default app;
For SvelteKit, create a hook in src/hooks.client.ts:
import './instrumentation';
Or import it in your root layout:
<script>
  import '../instrumentation';
</script>

<slot />
Step 4: Linking frontend traces with backend
To link your frontend and backend traces, you need to instrument your backend to send traces. Check out this document to instrument your backend. Once done, your frontend traces should automatically get linked with your backend traces.
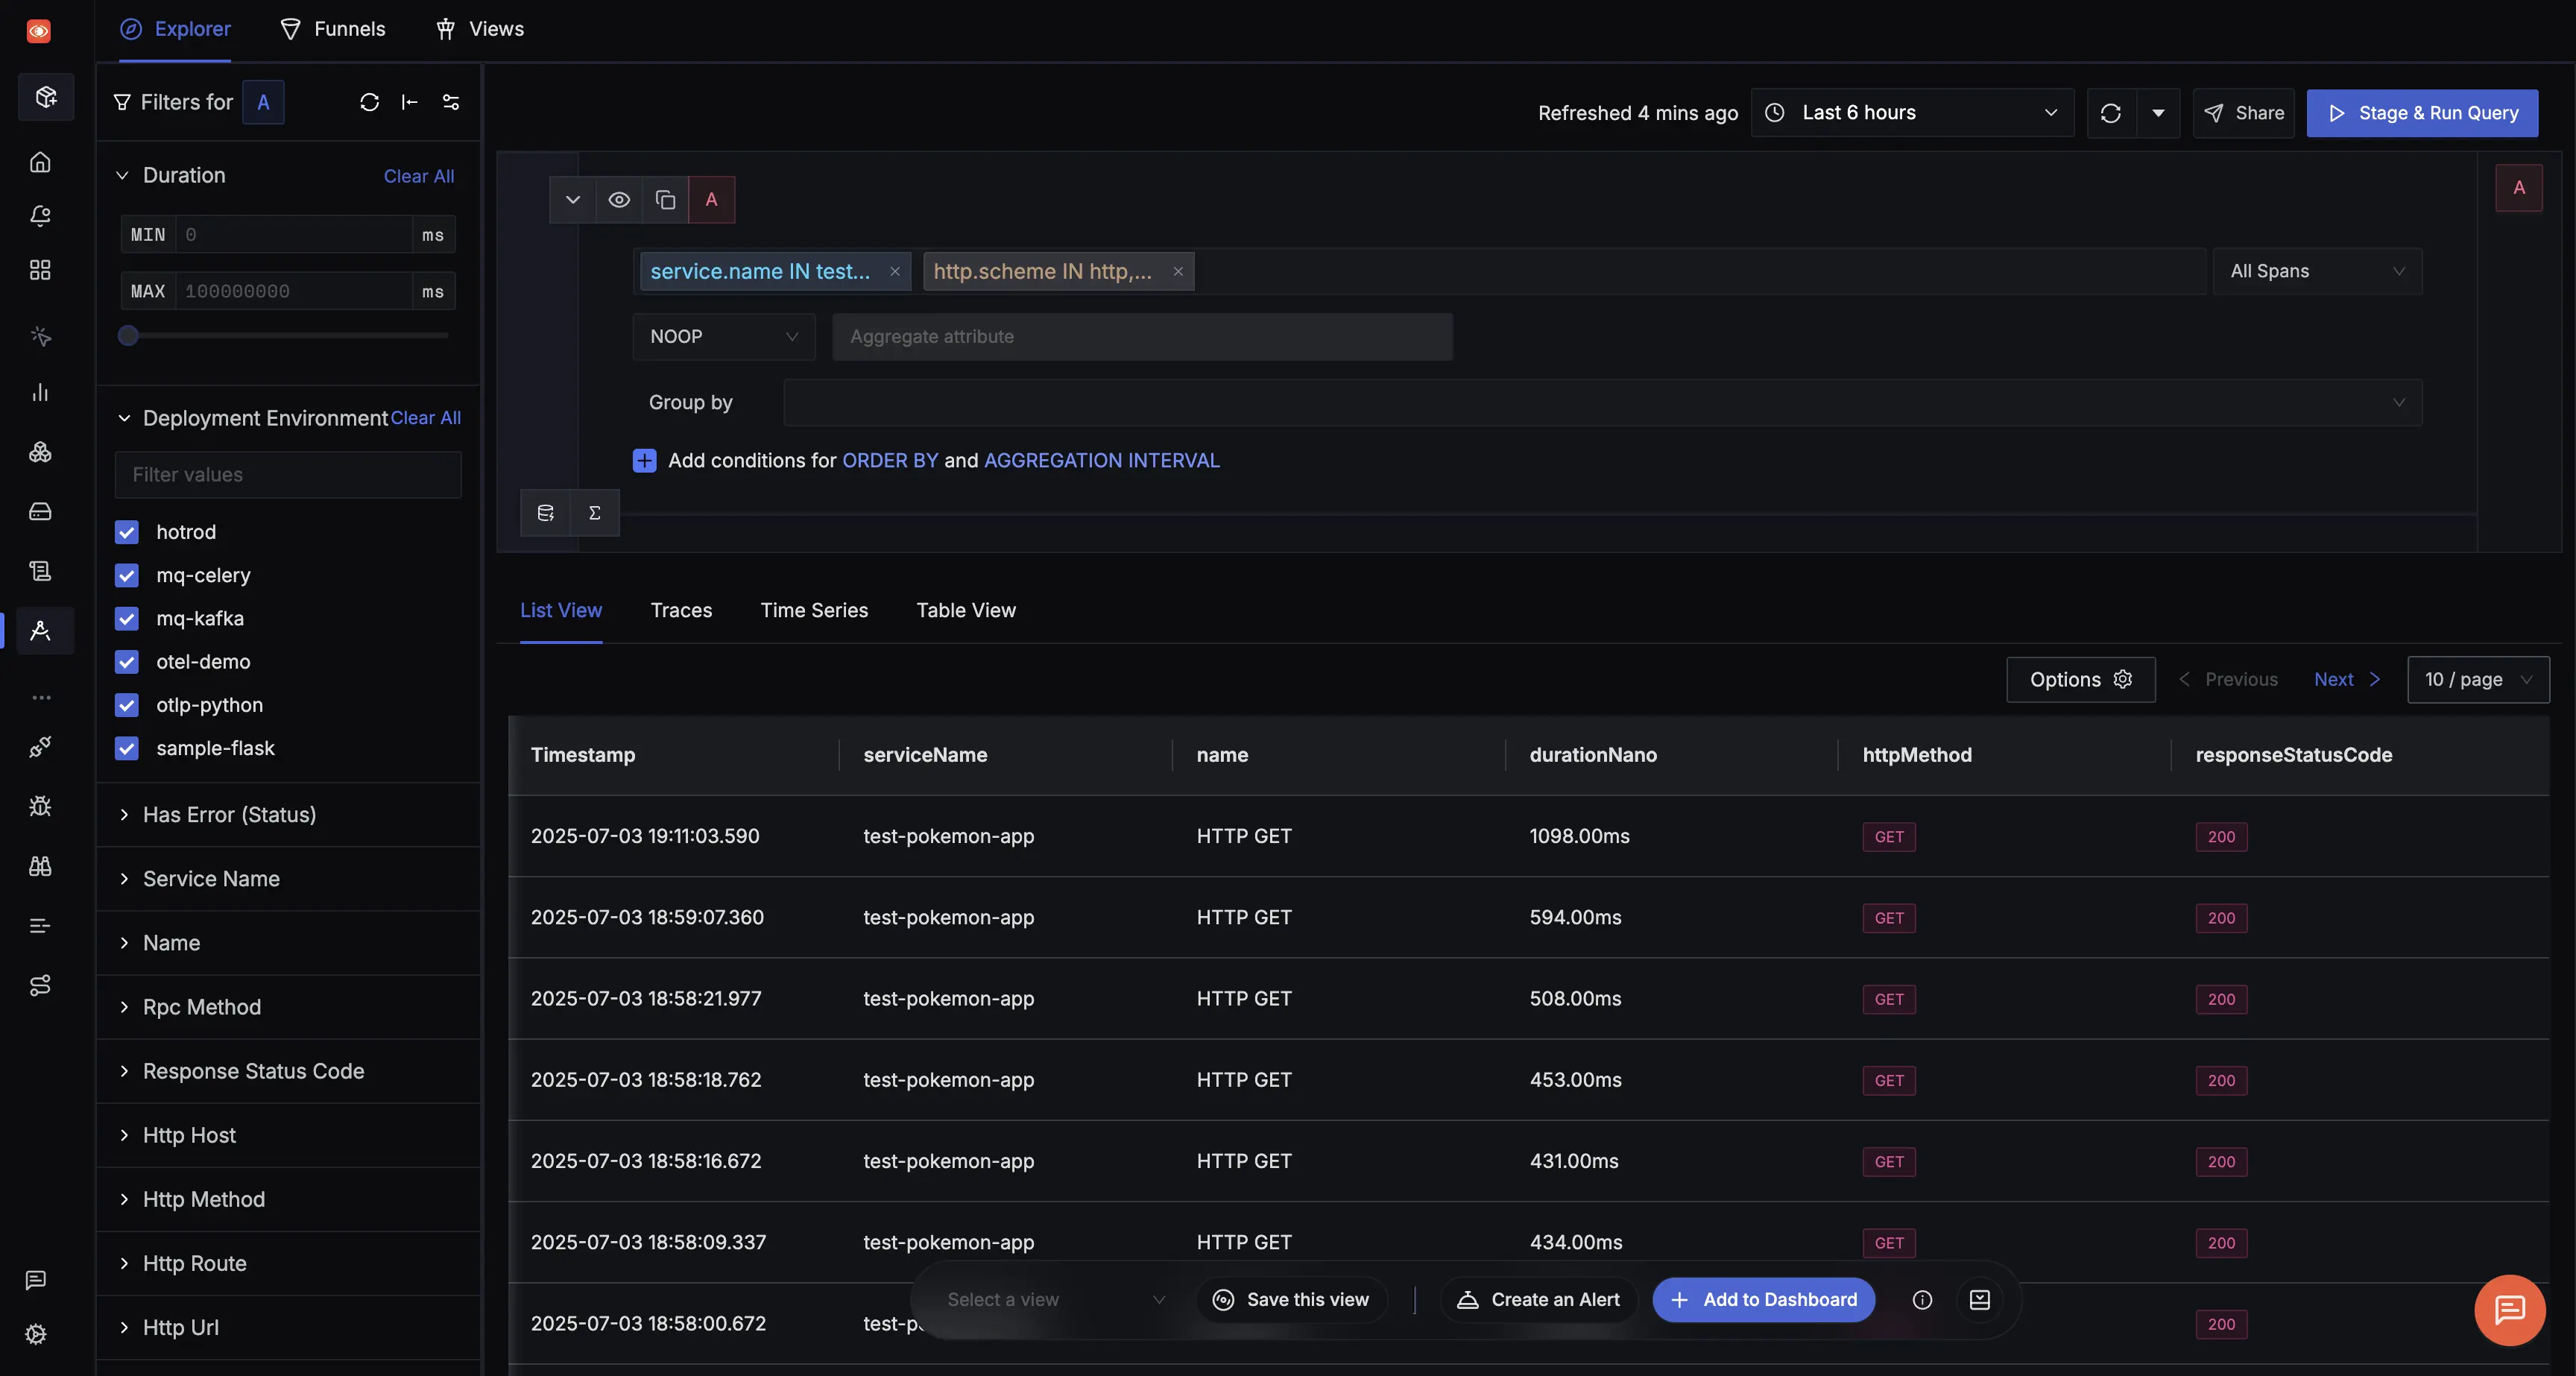
Step 5: Viewing Captured Traces in SigNoz
The captured traces can then be viewed in the Traces Explorer.
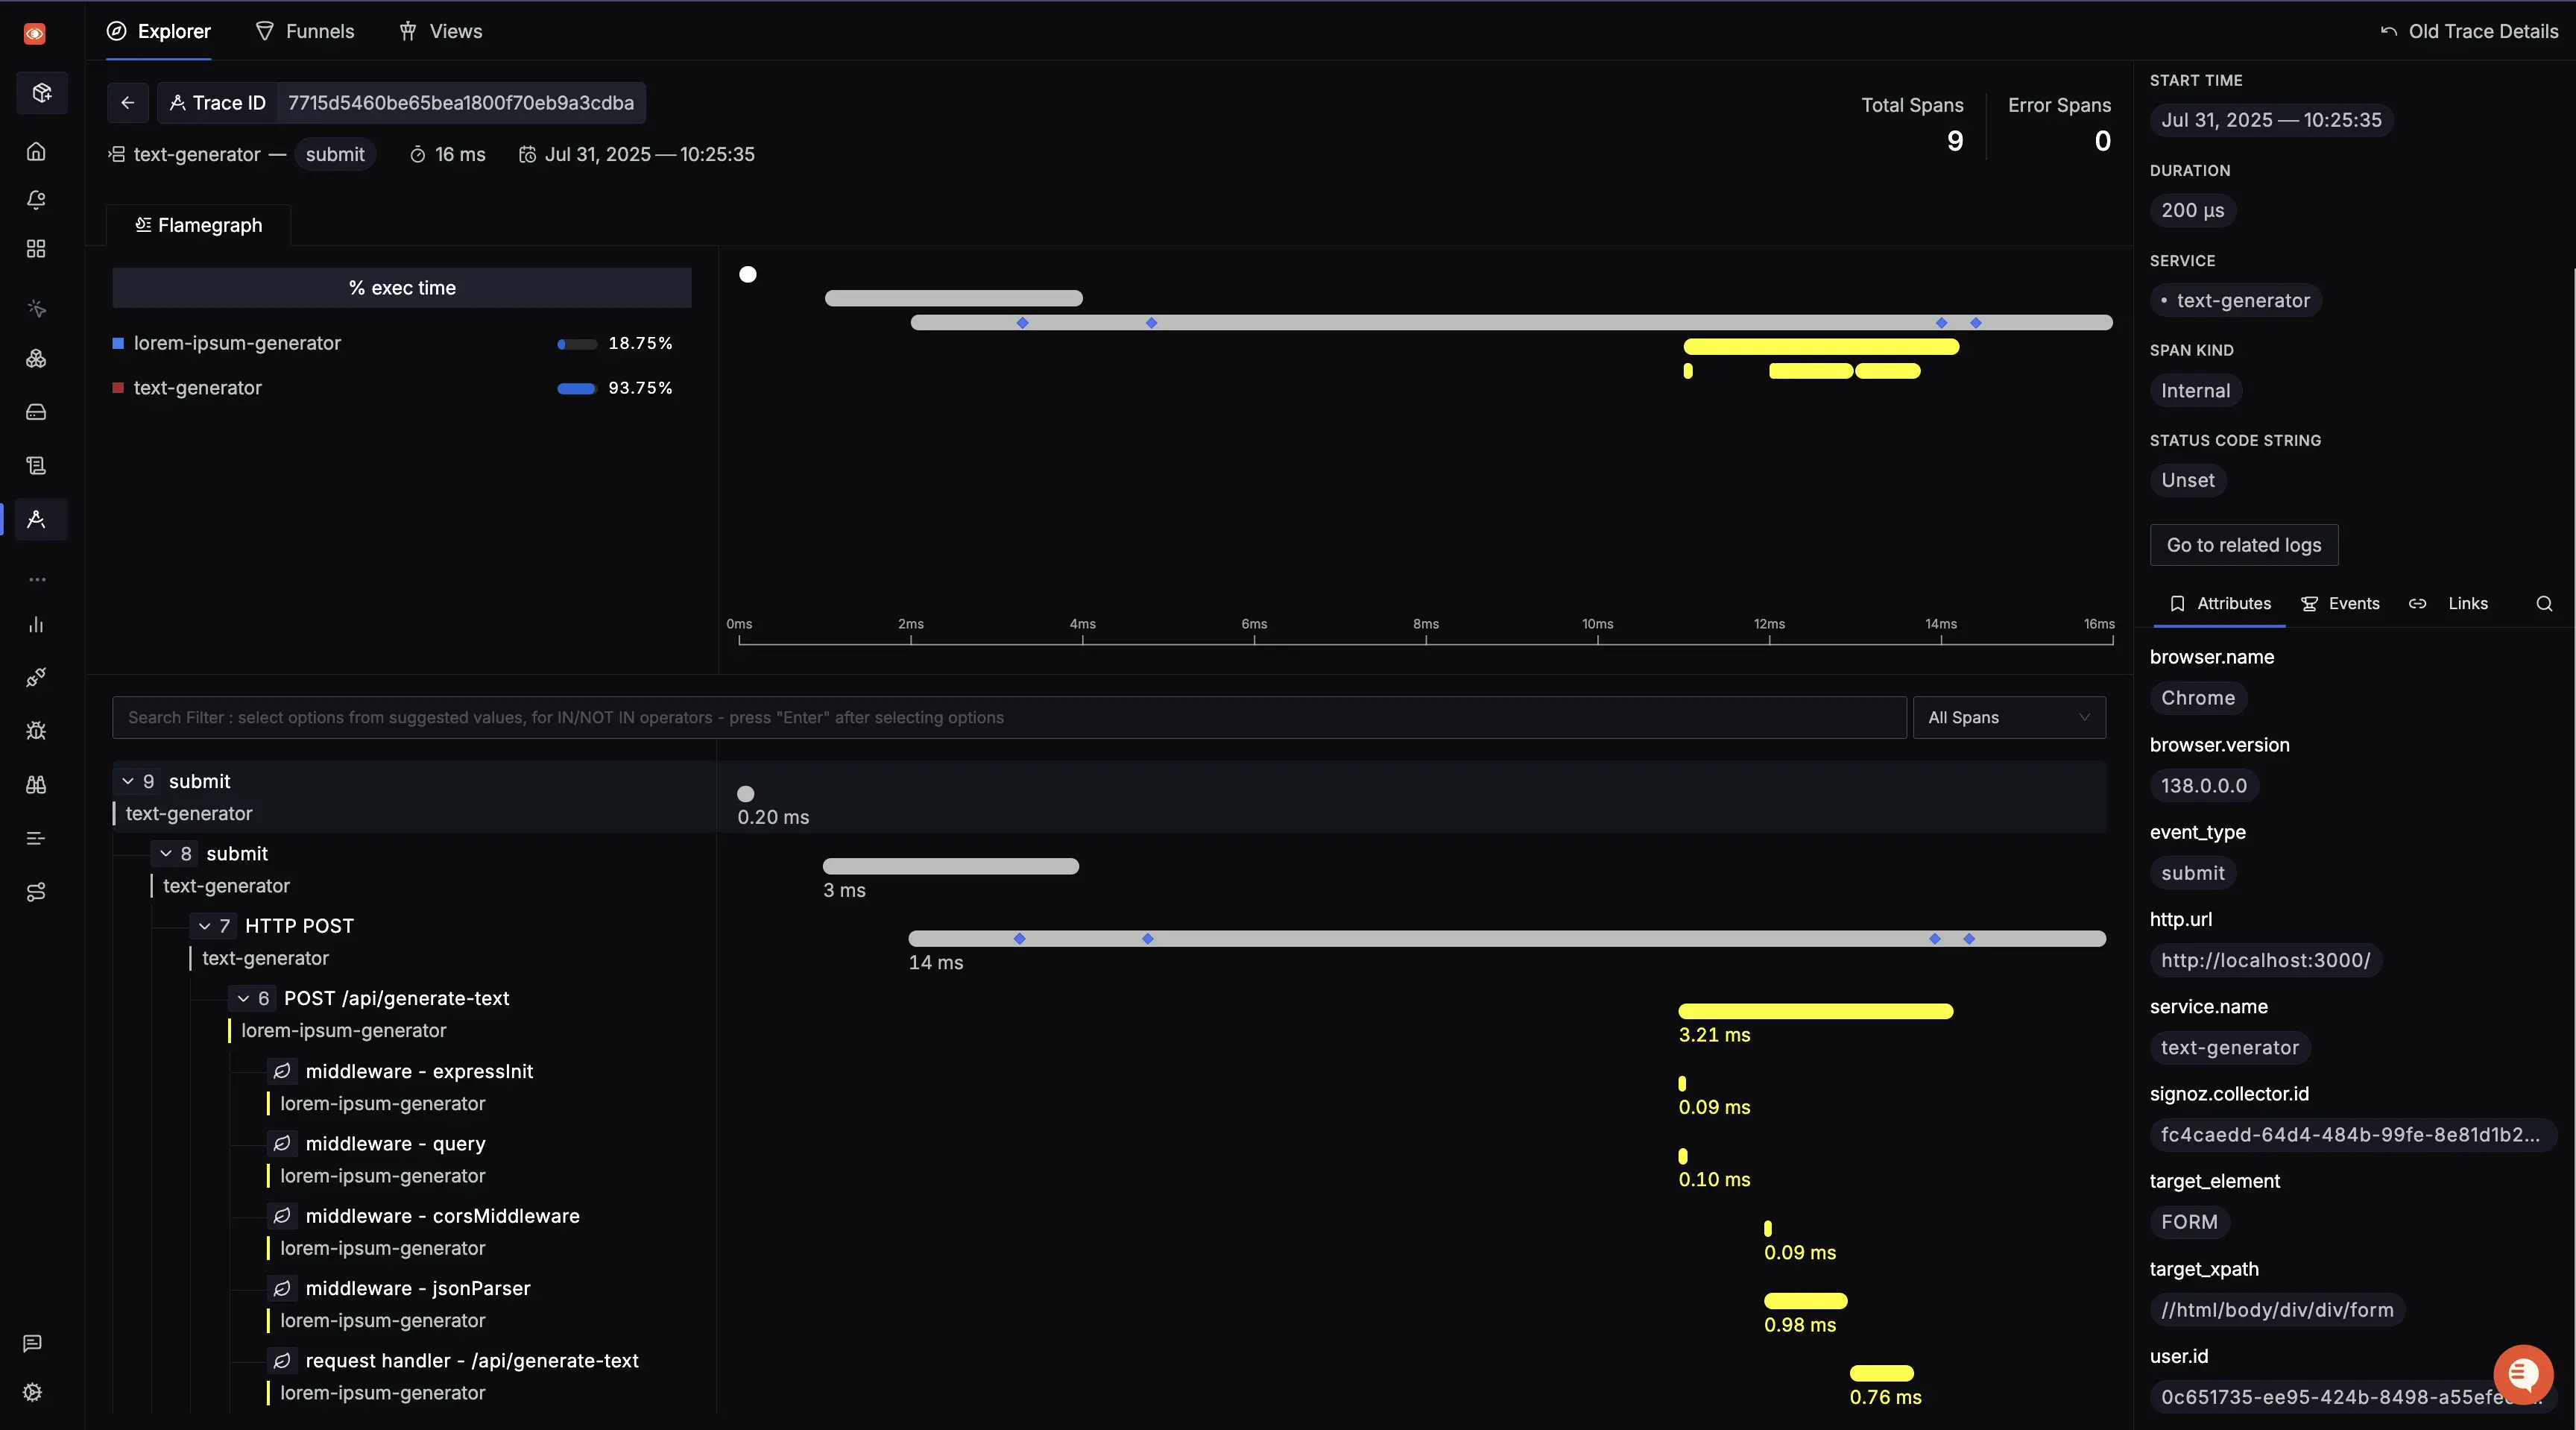
Attaching additional identifiers to your Traces
You can enrich traces with additional metadata like browser type, user ID etc. to enable real user monitoring (RUM)-like insights.
To do so, you need to write a custom implementation of SpanProcessor which will intercept all your exported spans and attach additional attributes to them.
import { SpanProcessor } from '@opentelemetry/sdk-trace-web';
import { UAParser } from 'ua-parser-js';

export const CONSTANTS = {
  USER_ID: 'user.id',
  USER_AGENT_ORIGINAL: 'user_agent.original',
  USER_AGENT_VERSION: 'user_agent.version',
  USER_AGENT_NAME: 'user_agent.name',
};

function getBrowserInfo() {
  // You can add your custom browser tracking logic here as well.
  // This example uses the ua-parser-js package.
  const parser = new UAParser();
  const result = parser.getResult();
  return {
    userAgentOriginal: result.ua || '',
    userAgentVersion: result.browser.version || '',
    userAgentName: result.browser.name || '',
  };
}

function getUserId() {
  // You can add your custom user ID tracking logic here as well.
  // This example uses localStorage.
  const userId = localStorage.getItem('userId');
  return {
    userId: userId || '',
  };
}

const CustomSpanProcessor: SpanProcessor = {
  onStart: span => {
    const userData = getUserId();
    const browserInfo = getBrowserInfo();

    span.setAttribute(CONSTANTS.USER_ID, userData.userId);
    span.setAttribute(
      CONSTANTS.USER_AGENT_ORIGINAL,
      browserInfo.userAgentOriginal
    );
    span.setAttribute(
      CONSTANTS.USER_AGENT_VERSION,
      browserInfo.userAgentVersion
    );
    span.setAttribute(CONSTANTS.USER_AGENT_NAME, browserInfo.userAgentName);
  },
  onEnd: () => Promise.resolve(),
  forceFlush: () => Promise.resolve(),
  shutdown: () => Promise.resolve(),
};

export default CustomSpanProcessor;
import { UAParser } from 'ua-parser-js';

export const CONSTANTS = {
  USER_ID: 'user.id',
  USER_AGENT_ORIGINAL: 'user_agent.original',
  USER_AGENT_VERSION: 'user_agent.version',
  USER_AGENT_NAME: 'user_agent.name',
};

function getBrowserInfo() {
  // You can add your custom browser tracking logic here as well.
  // This example uses the ua-parser-js package.
  const parser = new UAParser();
  const result = parser.getResult();
  return {
    userAgentOriginal: result.ua || '',
    userAgentVersion: result.browser.version || '',
    userAgentName: result.browser.name || '',
  };
}

function getUserId() {
  // You can add your custom user ID tracking logic here as well.
  // This example uses localStorage.
  const userId = localStorage.getItem('userId');
  return {
    userId: userId || '',
  };
}

const CustomSpanProcessor = {
  onStart: span => {
    const userData = getUserId();
    const browserInfo = getBrowserInfo();

    span.setAttribute(CONSTANTS.USER_ID, userData.userId);
    span.setAttribute(
      CONSTANTS.USER_AGENT_ORIGINAL,
      browserInfo.userAgentOriginal
    );
    span.setAttribute(
      CONSTANTS.USER_AGENT_VERSION,
      browserInfo.userAgentVersion
    );
    span.setAttribute(CONSTANTS.USER_AGENT_NAME, browserInfo.userAgentName);
  },
  onEnd: () => Promise.resolve(),
  forceFlush: () => Promise.resolve(),
  shutdown: () => Promise.resolve(),
};

export default CustomSpanProcessor;
Update your instrumentation file to include this processor.
const provider = new WebTracerProvider({
  resource: resourceFromAttributes({
    'service.name': 'text-generator',
  }),
  spanProcessors: [new BatchSpanProcessor(exporter), CustomSpanProcessor],
})
Now every span exported will include these additional contextual attributes.
Manual Instrumentation
If you need to create custom spans for capture activity, you can do so from any handler function in your code like this.
import { context, trace } from '@opentelemetry/api';

const tracer = trace.getTracer('<service-name>');

export async function eventHandler() {
  const span = tracer.startSpan('<span-name>');
  try {
    await context.with(trace.setSpan(context.active(), span), async () => {
      // Your data fetching logic
    });
  } catch (err) {
    // Your error fetching log
  } finally {
    // Close the span
    span.end();
  }
}
Demo Application
Check out this full-stack application that demonstrates sending traces from both frontend and backend to SigNoz.
